There is much documentation in the scientific literature (e.g. Clay et al. 1999, Hamouz et al. 2006, Gerhards et al. 2012) that weeds are distributed in a patchy manner throughout agricultural fields. An aggregated distribution pattern of weed popula-tions provides opportunity to reduce the herbicide application if site-specific weed management is adopted. Gerhards et al. (2002) achieved herbi-cide savings of 60% and 92% for dicotyledonous and monocotyledonous weeds, respectively, in spring barley (Hordeum vulgare L.) cultivation, and savings of 11% and 81% were achieved for the same weed groups for maize (Zea mays L.). In two winter wheat fields, Häusler et al. (1998) found that herbicide applications were necessary for 24% and 35% of the area for Galium aparine L., for 25% and 31% for other dicotyledonous weeds
and for 55% and 7.5% for grasses. Using a simu-lation, Christensen and Heisel (1998) estimated a 40% reduction of herbicide consumption, and Nordmeyer and Häusler (2000) calculated the need for herbicide application from 7% to 64% of the total area in various fields.
Site-specific weed management is based on the threshold concept: the aim is to adjust the intensity of management practices to the actual degree of weed infestation, with only those areas having a weed density exceeding the predefined control threshold typically being treated. However, site-specific weed management requires the precise setting of control thresholds for effectiveness and reliability. Furthermore, both areas that are treated superfluously and unsprayed areas that will show increases in weed infestation should be
Impact of site-specific weed management on herbicide
savings and winter wheat yield
P. Hamouz, K. Hamouzová, J. Holec, L. Tyšer
Department of Agroecology and Biometeorology, Faculty of Agrobiology, Food
and Natural Resources, Czech University of Life Sciences Prague, Prague, Czech Republic
ABSTRACT
An aggregated distribution pattern of weed populations provides opportunity to reduce the herbicide application if site-specific weed management is adopted. This work is focused on the practical testing of site-specific weed management in a winter wheat and the optimisation of the control thresholds. Patch spraying was applied to an ex-perimental field in Central Bohemia. Total numbers of 512 application cells were arranged into 16 blocks, which al-lowed the randomisation of four treatments in four replications. Treatment 1 represented blanket spraying and the other treatments differed by the herbicide application thresholds. The weed infestation was estimated immediately before the post-emergence herbicide application. Treatment maps for every weed group were created based on the weed abundance data and relevant treatment thresholds. The herbicides were applied using a sprayer equipped with boom section control. The herbicide savings were calculated for every treatment and the differences in the grain yield between the treatments were tested using the analysis of variance. The site-specific applications provided herbicide savings ranging from 15.6% to 100% according to the herbicide and application threshold used. The differ-ences in yield between the treatments were not statistically significant (P = 0.81). Thus, the yield was not lowered by site-specific weed management.
Keywords: economic thresholds; patch spraying; weed control; cereals; yield loss; Triticum aestivum L.
for grass weeds (Beer and Heitefuss 1981, Wahmhoff and Heitefuss 1985, Gerowitt and Heitefuss 1990, Zanin et al. 1993). Häusler et al. (1998) used the following application thresholds for the modelling of site-specific weed control in cereals: Elytrigia repens (L.) Nevski – 0.1 plants/m2; other
mono-cotyledonous weeds – 20 plants/m2; G. aparine
– 0.2 plants/m2; Cirsium arvense (L.) Scop. –
0.1 plants/m2 and other dicotyledonous weeds –
40 plants/m2.
However, the actual economic threshold values may vary considerably depending on crop density, crop and weed stage and other factors. There is little experience with the use of above mentioned thresholds for the site specific weed management applications. This work is focused on the practi-cal testing of site-specific weed management in a winter crop sequence and the optimisation of the control thresholds for this system.
MATERIAL AND METHODS
Site specific weed management was applied to an experimental field in Central Bohemia near Kolín in 2011. The annual average air temperature
viduals in four sampling quadrats placed in the central part of each cell. An area of 4 × 1.5 m2 was
analysed for G. aparine; C. arvense and E. repens, and the other weed species were evaluated in an area of 4 × 0.5 m2. The coverage of each species
was estimated visually in the same samples. The Patchiness index (PI) of Lloyd (1967) was calculated for the most abundant weed species to quantify the aggregation of their populations:
m m s
m 1
PI
2 − + =
Where: m – sample mean; s2 – sample variance. PI value higher than 1 indicates an aggregated population.
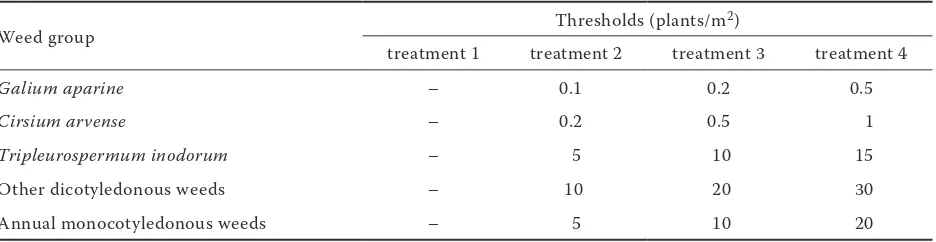
[image:2.595.65.533.636.757.2]All the cells were arranged into 16 blocks, which allowed the randomisation of four treatments in four replications (Figure 2a). Treatment 1 repre-sented blanket spraying, regardless of the weed infestation, and the other treatments differed by the application threshold used for the individual weed groups. The threshold values are listed in Table 1. Treatment maps for every weed group were created based on the weed abundance data and relevant treatment thresholds. The herbicides were
Table 1. Application thresholds for individual weed groups
Weed group Thresholds (plants/m
2)
treatment 1 treatment 2 treatment 3 treatment 4
Galium aparine – 0.1 0.2 0.5
Cirsium arvense – 0.2 0.5 1
Tripleurospermum inodorum – 5 10 15
Other dicotyledonous weeds – 10 20 30
applied using a 36 m boom sprayer equipped with boom section control (every section 6 m wide). The positioning of the sprayer was ensured using real time kinematic (RTK) navigation system with
[image:3.595.75.510.78.660.2]a horizontal error of less than 0.1 m. The sprayer was adjusted prior to the herbicide application, ensuring a horizontal error of application lower than 1 m and providing reasonable accuracy for Figure 1. Distribution maps of following weed groups: G. aparine (a); C. arvense (b); other dicotyledonous weeds (c) and annual monocotyledonous weeds (d)
Galium aparine
(plants m ) 0 - 0.20 > 0.2 - 0.5 > 0.5 - 1.0 > 5.00
Other
1.5 - 10.0 > 10.0 - 20.0 > 20.0 - 40.0 > 40.0
Annual
Monocot ledonousy
0 - 5.0 > 5.0 - 10.0 > 10.0 - 20.0 > 20.0
Cirsium arvense
0 - 0.2 > 0.2 - 1.0 > 1.0 - 5.0
> 05.
-2
(plants m )-2
(plants m )-2
(plants m )-2
Dicotyledonous
a)
b)
c)
d)
(a) (b)
(c) (d)
Galium aparine
(plants/m2) Cirsium arvense(plants/m2)
Other
dicotyledonous (plants/m2)
Annual
monocotyledonous (plants/m2) 0–0.20
> 0.2–0.5 > 0.5–1.0 > 5.00
0–0.2 > 0.2–1.0 > 1.0–5.0 > 5.00
1.5–10.0 > 10.0–20.0 > 20.0–40.0 > 40.0
bicide application against individual weed groups was performed separately; the herbicides were selected according to the actual weed spectrum and are listed in Table 2.The glyphosate-IPA her-bicide was applied as pre-harvest treatment to the whole trial field in order to control E. repens. The site-specific treatment was avoided in this case to maintain a homogeneous maturing of the crop.
The savings were calculated for every herbicide as a percentage ratio between the site-specific treatments and blanket spraying. The yield of the winter wheat was analysed by the harvest of 1.5 m strips in each cell and corrected for the standard grain moisture. The differences in the wheat grain yield between the treatments (i.e., application thresholds) were analysed using an analysis of vari-ance (ANOVA) at a probability level of α = 0.05. All statistical analyses were performed with Statistica 9.0 software (StatSoft Inc. 2010)
RESULTS AND DISCUSSION
Weed distribution. The experimental field showed a relatively high weed density, however
weed abundance reached 32.01 plants/m2. Viola arvensis Murray showed the highest abundance (15.51 plants/m2), followed by Tripleurospermum inodorum (L.) Schultz-Bip. (4.91 plants/m2) and E. repens (2.89 stems/m2). The distribution of most
of the weed species was patchy, and significantly large areas with a low weed infestation were found. The total weed density varied between 6.5 and 94.67 plants/m2. The annual grass weeds were
con-centrated in the southern part of the field, whereas patches of the annual dicotyledonous weeds were more evenly distributed throughout the area. C. arvense occurred in very small patches and covered a small area, but it was present in many of the application cells. G. aparine occurred in only a few cells and was of the marginal importance. The values of the mean density, mean coverage and Patchiness index for the most abundant weed species are listed in Table 3. Distribution maps of G. aparine, C. arvense, other dicotyledonous weeds and annual monocotyledonous weeds are presented in Figure 1.
Herbicide savings. The site-specific applica-tions of the herbicides provided herbicide savings ranging from 15.6% to 100% according to the
her-Table 3. Mean abundance, mean coverage and Patchiness index of the most abundant weed species
Weed species Mean abundance (plants or stems/m2) Mean coverage (%) Patchiness index
Viola arvensis 15.51 0.20 1.23
Tripleurospermum inodorum 4.91 0.08 1.98
Elytrigia repens 2.89 0.12 5.49
Papaver rhoeas 1.00 0.12 4.71
Cirsium arvense 0.90 0.15 7.72
Lamium amplexicaule 0.11 0.01 8.43
[image:4.595.62.533.102.230.2] [image:4.595.63.532.618.756.2]bicide and application threshold used. The highest savings (85.94–100%) were achieved in the case of the fluroxypyr application, because only small number of cells was infested with G. aparine. In
contrast, lower savings of metsulfuron-methyl + tribenuron-methyl herbicide (15.63–84.38%) were caused by relatively high abundance and homo-geneous distribution of V. arvensis and T. inodo-Figure 2. Experimental design (a) and application maps for metsulfuron-methyl + tribenuron methyl (b); pinox-aden (c) and clopyralid (d)
(a) (b)
(c) (d)
pinoxaden untreated treated
clopyralid untreated treated Experimental
design:
1 - blanket treatment 2 - low thresholds 3 - middle thresholds 4 - high thresholds
metsulfuron-methyl + tribenuron-methyl
untreated treated
a)
b)
c)
d)
Experimental design:
1 – blanket treatment 2 – low thresholds 3 – middle thresholds 4 – high thresholds
metsulfuron-methyl + tribenuron-methyl
untreated treated
untreated
treated untreatedtreated
[image:5.595.78.504.75.644.2]The application maps for pinoxaden, clopyralid and metsulfuron-methyl + tribenuron-methyl are shown in Figure 2. All of the herbicide savings for the individual treatments are listed in Table 4. The results confirm the patchy distribution of weed populations in crop fields and show that, even if the mean weed infestation is relatively high, site-specific weed management can provide a good potential for herbicide savings. Wallinga et al. (1998) showed that actual herbicide saving is considerably affected by spatial resolution of the sprayer. In this research, a 6 × 10 m grid was used for weed sampling and herbicide application. Increasing the spatial resolution will probably result in a higher reduction of herbicide use.
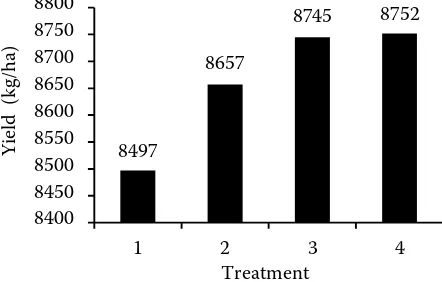
Winter wheat yield. The mean grain yield of the entire experimental field was 8664 kg/ha. The lowest yield (8497 kg/ha) was achieved at treatment 1 (blanket spraying). All site-specific treatments resulted in higher yields although the differences between treatments are relatively low. When compared with treatment 1, the treatment 2 resulted in 160 kg/ha yield increase, whereas treat-ments 3 and 4 provided 247 and 254 kg/ha yield
not statistically significant (P = 0.81). The yields of all of the treatments are presented in Figure 3. The results show that grain yield was little af-fected by the herbicide treatment, and, although the differences between the treatments were not statistically significant, the yield tended to be higher in all of the site-specific treatments com-pared to the blanket spraying. Therefore, even the highest thresholds (treatment 4) are acceptable for site-specific weed control in this case. A similar result was reported also by Ritter et al. (2008) who partially explained this by the absence of a negative side effect of the herbicide on the crop. The statistical insignificance was caused by high total variance of the analysed data, suggesting that the grain yield could be affected by other factors. Ritter et al. (2008) also mentioned that a high variance of the data can limit the statistical analyses of single effects but that the variance is crucial for the effective utilisation of precision farming techniques.
At present, site-specific weed management is still limited by the mapping costs, and automated weed sampling and mapping methods are being developed to reduce these costs (e.g. Gerhards and Oebel 2006, Gebhardt and Kühbauch 2007, Martín et al. 2011). Clearly, once the availability of rapid and reliable mapping methods allows the practical application of site-specific weed control, research analysing the impact of site-specific weed management on crop yield and weed populations, such as that presented here, will become more important.
The economic threshold does not take into ac-count the changes in the weed species populations in the ensuing years. Indeed, using the above-mentioned thresholds could lead to an increase in the weed populations in the untreated portions 8497
8657
8745 8752
8400 8450 8500 8550 8600 8650 8700 8750 8800
1 2 3 4
Yi
el
d (
kg
/ha)
[image:6.595.63.532.102.222.2]Treatment
[image:6.595.67.288.599.740.2]Corresponding author:
Ing. Pavel Hamouz, Ph.D., Česká zemědělská univerzita v Praze, Fakulta agrobiologie, potravinových a přírodních zdrojů, Katedra agroekologie a biometeorologie, Kamýcká 129, 165 21, Praha 6-Suchdol, Česká republika
phone: + 420 224 382 773, fax: + 420 224 382 780, e-mail: hamouzp@af.czu.cz of the field in the years following the application.
Our experiment will continue to study the im-pact of site-specific weed management and crop rotation on weed population dynamics. Other environmental factors will be also measured and involved in the statistical analyses.
REFERENCES
Beer E., Heitefuss R. (1981): Determination of control thresholds and economic injury thresholds for monocotyledonous and dicotyledonous weeds in winter wheat and winter barley. II. Zeitschrift für Pflanzenkrankheiten und Pflanzenschutz, 88: 321–336. (In German)
Clay S.A., Lems G.J., Forcella F., Ellsbury M.M., Carlson C.G. (1999): Sampling weed spatial variability on a fieldwide scale. Weed Science, 47: 674–681.
Christensen S., Heisel T. (1998): Patch spraying using histori-cal, manual and real-time monitoring of weeds in cereals. Zeitschrift für Pflanzenkrankheiten und Pflanzenschutz, 16 (Special Issue): 257–263.
Coble H.D., Mortensen D.A. (1992): The threshold concept and its application to weed science. Weed Technology, 6: 191–195. Gebhardt S., Kühbauch W. (2007): A new algorithm for automatic
Rumex obtusifolius detection in digital images using colour
and texture features and the influence of image resolution. Precision Agriculture, 8: 1–13.
Gerhards R., Gutjahr C., Weis M., Keller M., Sökefeld M., Möhring J., Piepho H.P. (2012): Using precision farming technology to quantify yield effects attributed to weed competition and herbicide application. Weed Research, 52: 6–15.
Gerhards R., Oebel H. (2006): Practical experiences with a system for site-specific weed control in arable crops using real-time image analysis and GPS-controlled patch spraying. Weed Re-search, 46: 185–193.
Gerhards R., Sökefeld M., Nabout A., Therburg R.D., Kühbauch W. (2002): Online weed control using digital image analysis. Journal of Plant Diseases and Protection, 18 (Special Issue): 421–427.
Gerowitt B., Heitefuss R. (1990): Weed economic thresholds in cereals in the Federal Republic of Germany. Crop Protection, 9: 323–331.
Hamouz P., Nováková K., Soukup J., Tyšer L. (2006): Evaluation of sampling and interpolation methods used for weed mapping. Jour-nal of Plant Diseases and Protection, 20 (Special Issue): 205–215. Häusler A., Nordmeyer H., Niemann P. (1998): Conditions for
the site-specific weed management. Zeitschrift für Pflanzen-krankheiten und Pflanzenschutz, 16 (Special Issue): 249–256. (In German)
Lloyd M. (1967): Mean crowding. Journal of Animal Ecology, 36: 1–30.
Martín M.P., Barreto L., Fernández-Quintanilla C. (2011): Dis-crimination of sterile oat (Avena sterilis) in winter barley
(Hordeum vulgare) using QuickBird satellite images. Crop
Protection, 30: 1363–1369.
Nordmeyer H., Häusler A. (2000): Experiences with site-specific weed control on a farm. Zeitschrift für Pflanzenkrankheiten und Pflanzenschutz, 17 (Special Issue): 195–205. (In German) Ritter C., Dicke D., Weis M., Oebel H., Piepho H.P., Büchse A.,
Gerhards R. (2008): An on-farm research approach to quantify yield variability and to derive decision rules for site-specific weed management. Precision Agriculture, 9: 133–146. StatSoft, Inc. (2010): STATISTICA (data analysis software system),
version 9.1. Avalable at www.statsoft.com
Wahmhof W., Heitefuss R. (1985): Investigations on the appli-cation of economic injury levels for weeds in winter barley. I: Factors of influence and possibilities of prognosis for the development of weed infestation. Zeitschrift für Pflanzenk-rankheiten und Pflanzenschutz, 92: 1–16. (In German) Wallinga J., Groeneveld R.M.W., Lotz L.A.P. (1998): Measures
that describe weed spatial patterns at different levels of resolu-tion, and their applications for patch spraying of weeds. Weed Research, 38: 351–359.
Zanin G., Berti A., Toniolo L. (1993): Estimation of economic thresholds for weed control in winter wheat. Weed Research, 33: 459–467.