There has been significant development in ac-tive packaging systems over the past 20 years. Some packaging concepts belonging to this category were used previously, but in the last two decades, there has been systematic research. Two types of packag-ing systems with interactive functions are currently distinguished, as described below.
Intelligent packaging is used to monitor condi-tions in the surroundings of the packaged product, and thus provides information about the quality of the packed food during transportation and storage. Temperature indicators and indicators of internal composition of the atmosphere are currently com-mercially available, along with indicators for the measurement of freshness of the packaged product. A new category of intelligent packaging systems uses elements based on radio-frequency identification (RFID) technology.
Because the application portion of this paper deals with the optimisation of a three-component mixture in antimicrobial packaging, only a more detailed description of active packaging will be given below.
Active packaging materials are defined as materials that aim at extending the shelf life or maintaining or improving the conditions of packaged food (Hauser et al. 2014). They combine non-active barrier properties with the active function of extending products’ shelf life and reducing the risk of pathogens (Hotchkiss 2002). The principal function of antimicrobial
pack-aging is the release of antimicrobial substances onto the surface of the packaged foodstuff. Whilst agents from the packaging material slowly migrate to the product surface, the packaging can help to maintain high concentrations where necessary (Quintavalla and Vicini 2002). For this purpose, the active substances can either be incorporated directly in the packaging material or inserted in an additional active layer.
Active packaging is able to spontaneously change its properties in response to changes in conditions inside or outside the package. This is achieved via active package elimination of the negative effects of environmental conditions on the quality of the food product (e.g. extending the shelf life of food).
In recent years, a great deal of research has focused on traditional preservatives (Cuq 1997), including active substances like sorbic acid, which was added in wheat gluten and bees wax (Guillard et al. 2009) or polyvinyl acetate, and coated on low-density polyethylene (LDPE) film (Hauser and Wunderlich 2011). Potassium sorbate has also been incorporated directly in LDPE (Silveira et al. 2007). To avoid syn-thetic preservatives, antimicrobial packaging based on natural extracts from herbs like essential oils and oleoresins has been developed (Muriel-Galet et al. 2013). Although low concentrations of essential oil were found to be effective in in vitro studies, how-ever, much higher concentrations were necessary in the food matrix to achieve comparable effects (Smid
Mixture design for food packaging in a modified
atmosphere
Jan HRON, Tomas MACAK
Department of Management, Faculty of Economics and Management, Czech University of Life Sciences Prague, Prague, Czech Republic
Abstract: In the past, food packaging was primarily used to support product sales and protect food from contamination or environmental eff ects which would reduce the life of the food. According to the World Health Organization (WHO), in the United States, from 6.5 to 33 million cases of food borne diseases occur each year, and nearly 9000 of these result in death. For this reason, we use active and intelligent packaging to extend the shelf life of food and improve its quality. Th is article aims to create an optimisation scheme for an optimum blend preference in food packaging with an active atmosphere. Th is will be accomplished by setting criteria for the production of antimicrobial food packaging.
Keywords: antimicrobial technology, shelf life of food, simplex lattice design, response optimiser
and Gorris 1999). In addition, the use of essential oils can have a great influence on the flavour of the preserved food (Burt 2004).
Maillard reaction products (MRPs) represent one possible form of antimicrobials. MRPs are created when carbonyl compounds (e.g. sugar) react with protein-bound amino acids. This can occur, for ex-ample, during the heat processing of bakery products or milk (Ledl and Schleicher 1990). In recent years, the antimicrobial effect of MRPs of mixture models (heated matter of amino acid plus reducing sugar) has been investigated. Thus, MRPs’ antimicrobial activity against different type of bacteria was detected (e.g.
Salmonella typhimurium, Listeria monocytogenes, Staphylococcus, etc.; Tauer et al. 2004; Ahmad et al. 2013).
Water content in food and the content of sub-stances which are a source of energy (e.g. sugars, alcohols, amino acids) and nitrogen (proteins, amino acids) have a significant effect on the shelf life of food and the speed of reproduction of microorganisms. Generally, a food containing low molecular weight and a greater amount of water degrades faster, as low molecular substances metabolise microorganisms directly. Meanwhile, proteins and high molecular carbohydrates (starch, cellulose) must first be split into low molecular products by microbial exo-enzymes; following this, they are metabolised by endo-enzymes. The growth of microorganisms and their biochemical activity are strongly affected by pH in foods. Each microbial species can reproduce only in a certain pH range. For the optimal growth of most bacteria, the range is relatively narrow. Extreme pH can kill microorganisms.
pH has a value ranging from 0 to 14 and is defined as the negative logarithm of the concentration of oxonium cations: pH = log [H3O+]. Neutral pH is around pH 7; ‘acidic’ foods have lower values, while ‘alkaline’ foods have higher values. Solutions with a pH less than 7 7 pH has an influence on the repro-duction of the bacteria in relation to the vitality and growth rate, as well as the intensity and character of the metabolism. The resistance of cells to increased temperatures is lower when there is increased devia-tion between the real and optimal pH values. This applies to both vegetative cells and spores.Most bacteria grow in a neutral or weakly alkaline pH (6.6 to 7.5).
Water activity, or aw, is the partial vapour pressure of water (p) in a substance divided by the standard state partial vapour pressure of water (p0):
ܽ௪=
(1)
In the field of food science, the standard state is most often defined as the partial vapour pressure of pure water at the same temperature. Using this definition, pure distilled water has a water activity of exactly 1. As temperature increases, aw typically increases, except in some products with crystalline salt or sugar. Pure water has an aw = 1.0.
If the amount of water available for the microorgan-isms in the food is reduced, the value of aw < 1.0. The optimal value for most microorganisms aw > 0.98.
Substances with higher aw tend to support more microorganisms. Bacteria usually require an aw of at least 0.91, and fungi at least 0.7.
Reduction potential (Eh; also known as redox potential, oxidation) is a measure of the tendency of a chemical species to acquire electrons and thereby be reduced. It is measured in volts (V) or millivolts (mV). Each environment has a redox potential which given by the presence of oxidising agents (e.g. oxygen, nitrates, peroxides) or reducing agents (e.g. ferrous ions, hydrogen). The Eh value depends on the ratio of the oxidised and reduced substances, and is de-termined by the chemical composition of the food and the partial pressure of oxygen in the foodstuff.
MATERIALS AND METHODS
The term experiment is defined as the systematic procedure carried out under controlled conditions in order to discover an unknown effect, to test or establish a hypothesis or to illustrate a known ef-fect. When analysing a process, experiments are often used to evaluate which process inputs have a significant impact on the process output, and what the target level of those inputs should be to achieve a desired result (output). Experiments can be designed in many different ways to collect this information (Birciakova et al. 2014). Design of ex-periments (DOE) is also referred to as designed experiments or experimental design – all of these terms have the same meaning.
lower manufacturing costs by minimising process variation and reducing rework.
Mixture experiments comprise a special class of response surface experiments in which the product under investigation is made up of several components or ingredients (Mongomery 2012). Designs for these experiments are useful because many product design and development activities in industrial situations involve formulations or mixtures. In these situations, the response is a function of the proportions of the different ingredients in the mixture.
EXACT FORMULATION
Let x = (x1, x2, …, xn) denote the vector of pro-portions of q mixing components and f(x) be the corresponding mean response. The factor space is simplex, given by:
ܻ=൝ݔ=൫ݔଵ, … ,ݔ൯:ݔ 0;݅= 1,2, … ,ݍ; ݔ= 1
ୀଵ
ൡ (2)
Scheffe introduced the following models in canoni-cal forms of different degrees to represent the mean response function:
Linear:
݂ሺݔሻ ൌ Ⱦݔ
(3)
Quadratic:
݂ሺݔሻ ൌ Ⱦݔ
Ⱦݔݔ ழ
(4)
In the above, we have used generic notations for the model parameters in different versions of mixture
models. Using the identity ∑xi = 1, model (4) can be converted to a canonical homogeneous quadratic model as follows:
݂ሺݔሻ ൌ Ⱦݔଶ
Ⱦݔݔ ழ
(5)
In the simplex mixture experiment, the response (the quality or performance of the product based on some criterion) depends on the relative proportions of the components (ingredients) (Antony 2001). The amount of components, measured in weights, volumes or some other units, add up to a common total. In contrast, in a factorial design, the response varies depending on the amount of each factor.
Before carrying out our experiments, we needed to determine what design will be most appropriate for the experiment. The theoretical apparatus pro-vides simplex centroid, simplex lattice and extreme vertices designs.
After we choose a design, we needed to carry out the following steps:
(1) Identify the components, process variables and mixture amounts are of interest;
(2) Determine the model;
(3) Ensure adequate coverage of the experimental region of interest; and
(4) Determine the impact that other considerations have on the selected design.
The default data for the experiment are listed in Table 1. Here, we chose a mixture design.
[image:3.595.64.536.577.741.2]We used the following contour plot to help you visualise the response surface. Contour plots are useful for establishing desirable response values, mixture blends and operating conditions.
Table 1. Default data of randomised trials of mixture design
StdOrder RunOrde PtTyp Blocks x1 (N2) x2 (CO2) x3 (O2) Y (colony count)
10 1 –1 1 0.16667 0.16667 0.6667 4900
2 2 2 1 0.50000 0.50000 0.00000 6300
9 3 –1 1 0.16667 0.66667 0.16667 5100
1 4 1 1 1.00000 0.00000 0.00000 8400
5 5 2 1 0.00000 0.50000 0.50000 4800
4 6 1 1 0.00000 1.00000 0.00000 8200
6 7 1 1 0.00000 0.00000 1.00000 7800
7 8 0 1 0.33333 0.33333 0.33333 4900
8 9 –1 1 0.66667 0.16667 0.16667 6500
3 10 2 1 0.50000 0.00000 0.50000 6600
The contour plot in Figure 1 shows how a response variable (colony count) relates to three components (the percentage of components of the modified
at-mosphere, which are N2, CO2 and O2) based on a model equation. Points which exhibit the same re-sponse are connected to produce the contour lines x1 (N2)
0 1
x2 (CO2)
1
0
x3 (O2)
1 0
7000
6000
5000
Mixture Contour Plot of Y (colony count: cfu /object) (component amounts)
x1 (N2)
0 1
x2 (CO2)
1
0
x3 (O2)
1 0
7000
6000
5000
[image:4.595.62.285.94.280.2]Mixture Contour Plot of Y (colony count: cfu /object) (component amounts)
Figure 2. Result of the simplex lattice design for modi-fied atmosphere packaging
[image:4.595.307.529.121.281.2]Source: own calculation
Figure 1. Mixture contour plot for modified atmosphere packaging
[image:4.595.64.535.414.728.2]Source: own calculation
Table 2. Regression model for mixtures: Y (colony count versus x1 [N2], x2 [CO2], x3 [O2])
Estimated regression coefficients for Y (colony count: cfu/object) (component proportions)
Term Coef SE Coef T P
VIF
x1 (N2) 8 548 378.2 * * 1.964
x2 (CO2) 8 148 378.2 * * 1.964
x3 (O2) 7 702 378.2 * * 1.964
x1 (N2)*x2 (CO2) –8 595 1 743.3 –4.93 0.008 1.982
x1 (N2)*x3 (O2) –6 686 1 743.3 –3.84 0.019 1.982
x2 (CO2)*x3 (O2) –13 886 1 743.3 –7.97 0.001 1.982
S = 392,187 PRESS = 9 926 598
R-Sq = 96.58% R-Sq(pred) = 44.81% R-Sq(adj) = 92.30%
Analysis of variance for Y (colony count: cfu/object) (component proportions)
Source DF Seq SS Adj SS Adj MS F P
Regression 5 17 369 756 17 369 756 3 473 951 22.59 0.005
Linear 2 1 774 444 393 515 196 758 1.28 0.372
Quadratic 3 15 595 311 15 595 311 5 198 37 33.80 0.003
x1 (N2)*x2 (CO2) 1 3 630 911 3 738 979 3 738 979 24.31 0.008 x1 (N2)*x3 (O2) 1 2 205 254 2 262 459 2 262 459 14.71 0.019 x2 (CO2)*x3 (O2) 1 9 759 146 9 759 146 9 759 146 63.45 0.001 Residual error 4 615 244 615 244 153 811
Total 9 17 985 000
of constant responses. Because a contour plot only shows three components at a time, whilst holding any other components and process variables at a constant level, contour plots are only valid for fixed levels of the extra variables. If the holding levels are changed, the response surface of the colony count changes as well, sometimes drastically.
We also added new experiment data to refine the solution area. For this purpose, we used a simplex lattice design, as illustrated by Figure 2.
Both plots show how the component proportions are related to the colony count of microorganisms/ objects. To minimise the colony count of bacteria, we would choose proportions for the components in the lower centre of the design space where the colony count ratings are the lowest. In both plots, the lightest green contour represents the lowest in the
design space. The blend which produces the lowest colony count rating is at the vertex, which comprises of the following:
10% X1 (N2) (p = 0.3), 48% X2 (CO2) (p = 0.3), and 51% X3 (O2) (p = 0.4).
These values are from the interval of admissible values (i.e. the percentages relate to coded values of the mixed factors). The regression model is shown in Table 2. Result of the binary form of the design is shown in Figure 3.
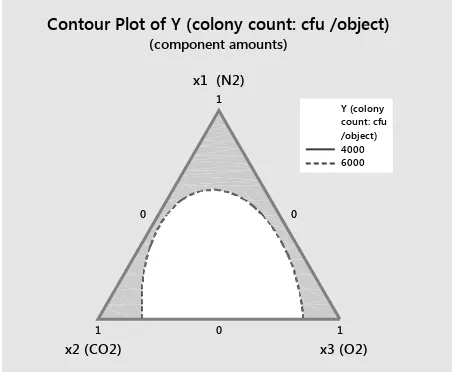
The results of the analysis are shown in Table 3. For the significance test, it was decided to select significance levels of a = 5% (0.05). If the p-value was less than the significance level (0.05), the fac-tor or interaction effect was then regarded to be statistically significant. For the present experiment, the main effects of N2, CO2 and O2 were statistically significant. The calculated effect factor in the coded values (response factor changing from –1 to +1) is shown in the first column of Table 3. The second column represents the regression coefficient (i.e. a half effect of each factor). Table 3 also shows that the quadratic model is more suitable than a linear model. The regression model therefore estimates the predicted response: Y (colony) = 4449.77 cfu/object. We used overlaid contour plots in binary form to jointly evaluate multiple responses. Overlaid con-tour plots can help to identify component settings which optimise a single response or set of responses. This plot showed us the function membership of a feasible set of responses in binary form (the range of responses was from 4000 to 6000 cfu/object).
[image:5.595.68.529.117.257.2]The optimum outcome provided by the response optimiser of microorganisms’ colony count/object
Table 3. Results from the optimiser of microorganisms’ colony count/object
Parameters
Y (colony co Minimum Goal Lower Target Upper Weight Import
4000 4000 6000 1 1
Global solution Components x1 (N2) = 0.0101010 x2 (CO2) = 0.479951 x3 (O2) = 0.509948
Predicted responses
Y (colony co = 4449.77, Composite desirability = 0.775115
Source: own calculation
x1 (N2)
0 1
x2 (CO2)
1
0
x3 (O2)
1 0
4000 6000 /object) count: cfu Y (colony Contour Plot of Y (colony count: cfu /object)
(component amounts)
Figure 3. Result of the binary form of the design for modified atmosphere packaging
[image:5.595.62.288.525.711.2]was very close to what was determined by visual inspection of the contour and surface plot. Table 3 shows that responses from the optimiser of micro-organisms’ colony count/object have the limitations when it comes to seeking the best possible result.
The proportions of components must be selected in such a manner that they sum to 1. We compared the plots showing concentrations of N2, CO2 and O2 in relation to temperature to see which level of the process variable resulted in a low count of colony microorganisms. The microorganism’s colony count/ object ratings in the lower centre of the design space and the optimum response belonged to the following
settings of modified atmosphere: low concentra-tion of N2 and middle concentrations of CO2 and O2 (Figure 4).
Figure 5 shows a response trace plot (also called a component effects plot) which illustrates how each component affects the response relative to a refer-ence blend. If the design contains process or amount variables, they must be held at a fixed level.
CONCLUSION
Food packaging data obtained under a modified atmosphere had three components and one process variable. Previous investigation showed that the mi-croorganism colony count/object was the best when x1 (N2) was set at 10.1%. Therefore, CO2 was fixed at 48% (low level) and O2 at 50% (medium level). For the modified atmosphere data, the reference blend was the centre point. The trace plot provided the information below about the component effects.
Starting at the location corresponding to the refer-ence blend:
As the proportion of N2 (black curve) in the mixture: – Increased (and the other mixture components de-creased), the microorganisms’ colony count/object rating decreased;
– Decreased (and the other mixture components increased), the microorganisms’ colony rating in-creases.
As the proportion of CO2 (red curve) in the mixture: – Increased (and the other mixture components
decreased), the microorganisms’ colony count/
Cur
High
Low D: 0,7751
Optimal
d = 0,77512 Minimum
Y (colon
y = 4449,7691
0,0 1,0
0,0 1,0
0,0
1,0 [ ]:x2 (CO2) [ ]:x3 (O2) [ ]:x1 (N2)
[image:6.595.87.501.97.274.2][0,0101] [0,4800] [0,5099]
Figure 4. Response optimiser of microorganisms’ colony count/object
Source: own calculation
0.75 0.50
0,25 0.00
–0.25 –0.50
9000
8000
7000
6000
5000
4000
deviation from reference blend in proportion
Fi
tt
ed
Y
(c
ol
on
y c
ount
: c
fu /
ob
je
ct
)
Cox Response Trace Plot
Figure 5. Response trace plot for a modified atmosphere of food packaging
[image:6.595.64.289.511.705.2]object rating decreased rapidly. This was valid in proportion from a 0.1 value of deviation from the reference blend;
– Decreased (and the other mixture components increased), the microorganisms’ colony count/ object rating increased rapidly. This was valid in proportion from a 0.1 value of deviation from the reference blend.
As the proportion of O2 (green curve) in the mixture: – Increased (and the other mixture components
decreased), the microorganisms’ colony count/ object rating decreased rapidly. This was valid in proportion from a 0.2 value of deviation from the reference blend;
– Decreased (and the other mixture components in-creased), the microorganisms’ colony count/object rating increased rapidly. This was valid in proportion from a 0.2 value of deviation from reference blend.
REFERENCES
Ahmad, J., Kausmann, T., Islam, I., Langrish, T. (2013): The effect of fats in whey protein isolate powder. Dry-ing Technology: An International Journal, 31: 619–632. Antony J. (2001): Improving the manufacturing process quality using design of experiments: a case study. Inter-national Journal of Operations and Production Manage-ment, 21: 812–822.
Birciakova N., Stavkova J., Antosova V. (2014): The impact of economic development in the Czech Republic on the income inequality between groups of households. Procedia Economics and Finance, 12: 57–65.
Burt S. (2004): Essential oils: their antibacterial properties and potential applications in foods. International Journal of Food Microbiology, 94: 223–253.
Cuq B. (1997): Antimicrobial packaging and wrappers. Industries Alimentaires et Agricoles, 114: 127–129. Guillard V., Issoupov V., Redl A., Gontard N. (2009): Food
preservative content reduction by controlling sorbic acid release from a superficial coating. Innovative Food Science & Emerging Technologies, 10: 108–115.
Hauser C., Mueller U., Sauer T., Augner K., Pischetsrieder M. (2014): Maillard reaction products as antimicrobial components for packaging films. Food Chemistry, 145: 608–613.
Hauser C., Wunderlich J. (2011): Antimicrobial packaging films with a sorbic acid based coating. Procedia Food Science, 1: 197–202.
Hotchkiss J.H., Loss C. R. (2002): Effect of dissolved carbon dioxide on thermal inactivation of microorganisms in milk. Journal of Food Protection, 65: 1924–1929. Mueller U., Sauer T., Weigel I., Pichner R., Pischetsrieder
M. (2011): Identification of H(2)O(2) as a major anti-microbial component in coffee. Food & Function, 2, 265–272.
Muriel-Galet V., Talbert J.N., Hernandez-Munoz P., Gavara R., Goddard J. M. (2013): Covalent immobilization of lysozyme on ethylene vinyl alcohol films for nonmi-grating antimicrobial packaging applications. Journal of Agricultural and Food Chemistry, 61: 6720–6727. Ledl F., Schleicher E. (1990): New aspects of the Maillard
reaction in foods and in the human body. Angewandte Chemie – International Edition, 29: 565–594.
Montgomery D.C. (2012): Design and Analysis of Experi-ments. Wiley Publishing.
Quintavalla S., Vicini L. (2002): Antimicrobial food packag-ing in meat industry. Meat Science, 62: 373–380. Silveira M.F.A., Soares N.F.F., Geraldine R.M., Andrade
N.J., Gonçalves M.P.J. (2007): Antimicrobial efficiency and sorbic acid migration from active films into pastry dough. Packaging Technology and Science, 20: 287–292. Smid E.J., Gorris L.G.M. (1999): Natural antimicrobials for
food preservation. In: Rahman M.S. (ed.): Handbook of Food Preservation. Marcel Dekker, New York: 285–308. Stojanova H., Tomsik P., (2014). Factors influencing em-ployment for tertiary education graduates at the selected universities. Agric. Econ. – Czech, 60: 376–387. Tauer A., Elss S., Frischmann M., Tellez P., Pischetsrieder
M. (2004): Influence of thermally processed carbo-hydrate/amino acid mixtures on the fermentation by Saccharomyces cerevisiae. Journal of Agricultural and Food Chemistry, 52: 2042–2046.
Received: 12th March 2015
Accepted: 6th May 2015
Contact address:
Jan Hron, Tomas Macak, Czech University of Life Sciences Prague, Faculty of Economics and Management, Kamýcká 129, 165 21 Prague, Czech Republic

![Table 2. Regression model for mixtures: Y (colony count versus x1 [N2], x2 [CO2], x3 [O2])](https://thumb-us.123doks.com/thumbv2/123dok_us/382331.535706/4.595.64.535.414.728/table-regression-model-for-mixtures-colony-count-versus.webp)