Linear models have been applied in animal breed-ing for a relatively long period. Among these mod-els the Best Linear Unbiased Prediction has been developed in such a way that the BLUP estimators make efficient use of available records (Hill and Meyer, 1988). As a result, during the last decade this procedure became an official method for deter-mining breeding values thus carrying out selection decisions in many European countries as far as the pig breeding sector is concerned (Götz, 2002). The realised responses of these programs (based on the BLUP method) were reported by several authors (e.g. Kovac and Groeneveld, 1990; Kaplon et al., 1991; Ducos et al., 1992; Sonesson et al., 1998; Wolf et al., 1998; Peškovičová et al., 1999).
Regardless of its efficiency under certain circum-stances (e.g. non-random distribution of contempo-rary group effects over sires) BLUP estimators can be biased (Hofer and Frey, 1995). In a previous study the present authors (Nagy et al., 2002) examined the
distribution of animals across herds. Using the sta-tion test database of Hungarian pig populasta-tions the phenotypic measurements and the predicted breed-ing values were regressed on the predicted herd effects. The phenotypic measurements were clearly positively associated with the predicted effects of herds of origin but the predicted breeding values seemed to be independent of the herd effects. The results suggested a possible random distribution of the animals across the herds and the authors con-cluded that the predicted breeding values might be unbiased. The authors’ choice for analysing the sta-tion test rather than the field test can be explained by the fact that in Hungary the station test is much more reliable than the field test. Moreover, in the course of the station test every effort is made to lessen the impact of station effect by careful stand-ardisation of the influencing factors. On the other hand, there is a great variability in the environ-mental conditions provided for test animals at their
Supported by the Österreichischer Austauschdienst (ÖAD).
Analysis of alternative models treating herd × year
effects as fixed or random
I. N���
1, J. S������
2, L. C����
1, J. F�����
1, L. R�������
31
University of Kaposvár, Kaposvár, Hungary
2University of Agricultural Sciences (BOKU), Vienna, Austria
3National Institute for Agricultural Quality Control (OMMI), Budapest, Hungary
ABSTRACT: The analysis was conducted of the national database of station tests carried out between May 1996– Feb-ruary 2001, using the Hungarian Large White breed. Days of test, total amount of consumed feed and valuable cuts were taken into the analysis. Using the method of cross validation, small subsets of the data were excluded and then predicted using the remaining part of the data treating herd × year effects either as fixed or as random. The size of the data excluded was 50 or 10 records at a time and the process was repeated 100 or 500 times, respectively. Mean squared error, bias and correlation between the excluded and predicted observations were calculated for all the excluded subsets. There was no significant difference between the fixed and random models but in the case of valuable cuts the random models showed a lower mean squared error and higher correlation between the excluded and predicted observations than the fixed models.
herds of origin prior to the station test. The boars are evaluated by a conventional index score. That means the test animals having experienced favour-able environmental conditions prior to the station test might also perform well during the station test (compared to other test animals that experienced poor environmental conditions prior to the station test) and provide their boar with a high index score. Hence, even though the herd of origin influences the station test results only indirectly, its impact on the station test results (perhaps surprisingly) is at least as large as that of the station effect.
The present study is a continuation of the previ-ous work with the objective to obtain numerically the possible bias (if present) using the method of cross validation (prediction of missing records), which at least to our best understanding has not yet been applied in the Hungarian Pig Breeding sector. Hence by conducting the analysis the pre-dictive ability of the BLUP models could be evalu-ated.
MATERIAL AND METHODS
Data recording
The genetic analysis was conducted on the data collected by the National Institute for Agricultural Quality Control of Hungary between May 1996 and February 2001, in the course of station tests. The Hungarian Large White (LW) breed was ana-lysed.
Station test (progeny test)
Concerning the station test performance cas-trates and females were evaluated from the age of 80 days to the age when they reached the final body weight of 105 kg. Detailed description of the station test can be found in Nagy et al. (2002) and OMMI (2002). The traits chosen for analysis were days of test (DOT), total amount of feed consumed during the test (FEED) and valuable lean cuts (VC) (neck, shoulder, loin and ham). Basic statistics of the sta-tion test data are presented in Table 1. Regarding the structure of the dataset there were 2 sex, 59 year × month and 169 herd × year classes respectively. The number of observations found in the different herd × year classes ranged between 5 and 162. The number of animals in the pedigree file was 10 398.
In the pedigree 54.1% of the animals had 6 or less known ancestors and only 19.4% of the animals had 10 or more (up to 38) known ancestors. The average number of known ancestors was 7.8.
Statistical analysis
Predicting ability of the applied BLUP models was compared using the method of cross valida-tion, similar to that described by Frey et al. (1997). In order to have at least 5 records in all herd × year classes 33 records had to be deleted from the origi-nal station test data (6 855 records). The data set to be analysed thus contained 6 822 records. From the station test data the authors randomly excluded either 50 records or 10 records at a time and the process was repeated 100 times in the former and 500 times in the la�er case. These repetitions created independent replicates as exclusions were made in such a way that one animal could be excluded only once. A random sequence (between 1 and 6 822) was used in order to select the line numbers of the station test data that were to be deleted taking the successive elements of the random sequence ei-ther by 10 or 50. Thus a�er carrying out the 100 or 500 deletions, the exclusions were finally carried out on the same 5 000 animals (viewing them alto-gether) for both types of exclusion.
[image:2.595.304.531.112.184.2]The excluded (50 or 10) animals’ performances were predicted using the remaining part (6 772 or 6 812 pigs) of the data set. Breeding values and other effects were estimated using a multi-trait animal model applying PEST (Groeneveld, 1990). For all the evaluated traits (i.e. DOT, FEED, VC) the fixed effects were sex, year-month (of the station test) and station. Random effects were the additive genetic effects and common environmental li�er effects. Herd × year effects were treated either as fixed or random depending on the model.
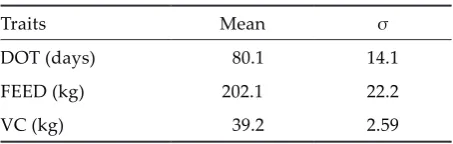
Table 1. Basic statistics of the examined traits for 6 822 Hungarian Large White test animals
Traits Mean σ
DOT (days) 80.1 14.1
FEED (kg) 202.1 22.2
VC (kg) 39.2 2.59
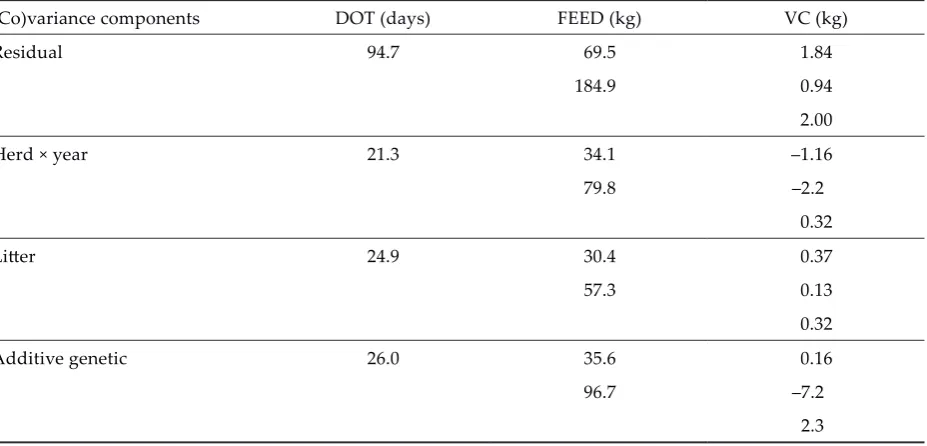
Prior to the genetic evaluations the (co)variance components of DOT, FEED, VC were estimated with VCE4 based on the REML method (Groeneveld, 1998) using the entire data set (Tables 2 and 3).
Mean squared error (MSE), bias and correlation between the observed and predicted performances were used to compare models treating herd × year effects either fixed or random.
[image:3.595.62.540.128.299.2]These criteria were obtained for all the excluded subsets – each subset containing 50 or 10 records (n = 50 or n = 10) – and resulted in 100 and 500 MSE, Bias and rŷi,yi values, respectively, for both models (fixed or random herd × year effects). Thus alto-gether 1 200 genetic evaluations were performed. In order to test the significant differences between the criteria of the fixed and random models a paired Table 2. Estimated (co)variance components of the analysed traits treating herd × year effects as fixed (estimated variances are presented in the diagonal elements, estimated covariances are presented in the off-diagonal ele-ments)
(Co)variance components DOT (days) FEED (kg) VC (kg)
Residual 94.7 70.5 1.73
187.7 0.72
2.10
Li�er 26.8 32.6 0.41
59.3 0.14
0.37
Additive genetic 23.8 31.6 0.25
90.1 –6.9
2.1
DOT = days of (station) test; FEED = consumed feed; VC = valuable cuts
Table 3. Estimated (co)variance components of the analysed traits treating herd × year effects as random (estimated variances are presented in the diagonal elements, estimated covariances are presented in the off-diagonal ele-ments)
(Co)variance components DOT (days) FEED (kg) VC (kg)
Residual 94.7 69.5 1.84
184.9 0.94
2.00
Herd × year 21.3 34.1 –1.16
79.8 –2.2
0.32
Li�er 24.9 30.4 0.37
57.3 0.13
0.32
Additive genetic 26.0 35.6 0.16
96.7 –7.2
2.3
[image:3.595.68.532.390.613.2]t-test (SPSS Inc., 1999) was used for the comparison of the fixed and random MSE, Bias andrŷi,yi values resulting from the cross validation process. In or-der to determine if the environmental factors (i.e. herd × year, year × month and sex classes) influence the deviation between the predicted and measured performances, the GLM procedure (SPSS Inc., 1999) was applied. Moreover, the mean deviation values between the predicted and measured performances were plo�ed against the different herd × year sizes.
RESULTS
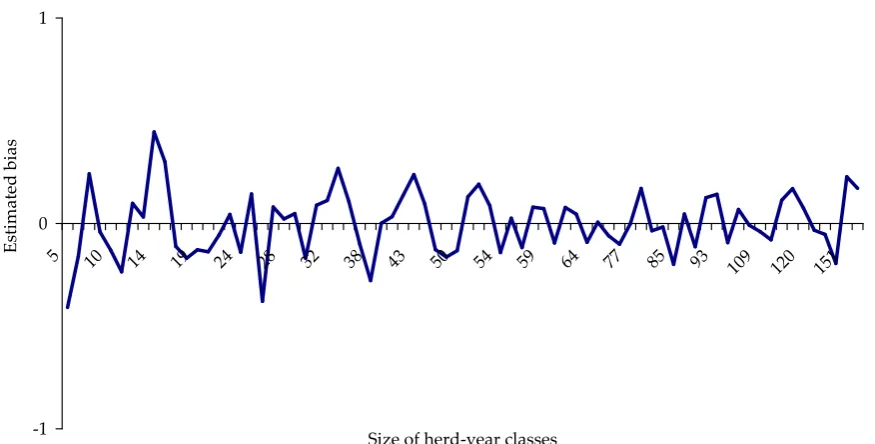
[image:4.595.74.522.247.746.2]A�er conducting the GLM procedure, the authors found that the herd × year, year × month and sex effects did not influence the deviation between the measured and predicted measurement in either trait or model. It can be seen from Figures 1–3 that the profiles of the estimated bias values differed across the traits. In order to compare these estimates, the bias values of the examined traits were divided
Figure 1. Bias of days of test
Figure 2. Bias of consumed feed -4
-2 0 2 4
5 10 14 19 24 28 32 38 43 50 54 59 64 77 85 93 109 120 151
Size of herd-year classes
Es
tim
at
ed
bi
as
-4 -2 0 2 4
5 10 14 19 24 28 32 38 43 50 54 59 64 77 85 93 109 120 151
Size of herd-year classes
Es
tim
at
ed
bi
by their genetic standard deviation (Tables 2–4). Related to the genetic standard deviation DOT and FEED had larger bias than VC.
Examining the results based on 100 independent excluded data sets each containing 50 observations (Table 4) it can be seen that the different models treating herd × year effects either as fixed or ran-dom generally showed similar values. Correlation coefficients between the measured and predicted values (rŷi,yi) were similar regardless of the
meas-ured trait. Concerning the different models no dif-ferences were found for the various criteria used for the predictive analysis except for VC where the model treating herd × year effects as random showed marginally higher rŷi,yi and lower MSE than in the case of the fixed model.
[image:5.595.77.515.82.304.2]Based on 500 independent excluded data sets each containing 10 observations the results were al-most identical with those of the previous approach (100 independent excluded data sets each contain-Figure 3. Bias of valuable cuts
Table 4. Mean squared error (MSE), Bias and correlation (rŷi,yi) of the analysed models based on 100 independent excluded datasets, each having 50 predicted observations
Trait Criterion Herd × year effect
Fixed Random
DOT MSE 112.5 112.6
Bias 0.10 0.12
rŷi,yi 0.60 0.60
FEED MSE 309.4 309.4
Bias –0.13 –0.14
rŷi,yi 0.62 0.62
VC MSE 4.04 4.00**
Bias 0.013 0.016
rŷi,yi 0.63 0.64**
DOT = days of (station) test; FEED = consumed feed; VC = valuable cuts **means are significantly different at the 0.01 level
-1 0 1
5 10 14 19 24 28 32 38 43 50 54 59 64 77 85 93
109 120 151
Size of herd-year classes
Es
tim
at
ed
bi
[image:5.595.62.534.534.724.2]ing 50 observations) therefore their presentation did not seem meaningful.
DISCUSSION
In the previous study of the present authors (Nagy et al., 2002) a possible random distribution of the tested animals across their herds of origin was found, which suggested that the prediction of breeding values might be unbiased. Now it is clear from the results (Table 4) that a small bias could be detected in every trait. Completely ran-dom distribution of animals across the herds could not therefore be affirmed, for which situation herd × year effects are o�en treated as fixed in animal breeding. The advantage of fi�ing herd × year effects as fixed in the mixed model equations can be that the expectation of the solution for genetic values does not include fixed effects. This means that, if a non-random use of sires across herds, years, sea-sons, or any other non-random association between animals and effects considered fixed occurs, then these effects may not introduce bias to genetic com-parisons (van Bebber et al., 1997). This supposition, however, could not be justified in our investigation. In fact there were no significant differences between bias values when considering herd × year effects fixed or random. Similarly, other authors (Visscher and Goddard, 1993; Frey et al., 1997; Schenkel et al., 2002) observed biased predictions even in those cases when contemporary group effects were con-sidered as fixed.
As there was no difference between the results of subsets omi�ing 10 or 50 records at a time, it need not be worthwhile to make too small (and many) samples in the course of cross validation because the longer computation time might not coincide with smaller MSE and Bias.
The results of Tables 3 and 4 show that VC was the only trait where the predictive ability of the random model exceeded that of the fixed (though the differences were marginal). The fraction of the phenotypic variance due to herd × year effects for this trait was small (0.06). Our results were in good agreement with those found by Estany and Sorensen (1995) and Babot et al. (2003), who reported that models considering herd × year effects as random resulted in smaller MSE and higher rŷi,yi between the excluded and predicted observations than those of the fixed models. In their case the fraction of the phenotypic variance due to herd × year effects was
also small (0.01–0.04). As pointed out by Frey et al. (1997), the small estimate of variance of herd × time effects is an indicator of small bias. Hence the superiority of the random models can be the result of the small bias indicated by the small variance due to herd × year effects.
Calculating the variance ratio of the residual to herd × year variance, for VC it was relatively high (6.26). Frey et al. (1997) reported that significant dif-ferences were found only for small herd × time periods in case the variance ratio of the residual to herd × year variance was high (35 or 34.8). In this case treating the herd × time period effects as ran-dom resulted in smaller MSE and higher rŷi,yi values between the excluded and predicted observations than in the models treating herd × time period ef-fects as fixed.
Computer simulations of other authors further supported these findings. Treating contemporary groups as random effects resulted in smaller MSE between the true and predicted breeding values than that of the models treating this effect as fixed, supposing the ratio of the environmental to con-temporary group variance was high (5.25 or 17.75) (Ugarte et al., 1992). The random models generally showed higher rŷi,yi between the true and predict-ed brepredict-eding values. Visscher and Goddard (1993) received similar results (i.e. the superiority of the random models) in case non-random distribution of sires meant that the best sires were used in the best herds. Oikawa and Sato (1996) simulating a non-random association between sires and herds (good sire in good herd and bad sire in bad herd) found that random models showed lower MSE and higher rŷi,yi between the true and predicted breeding values. Preferential treatment towards animals of high genetic merit did not change the superiority of the random models unless the amount of the preferential treatment was extremely large. Under selection of sires the superiority of the random models did not change regardless of preferential treatment.
et al., 1997). In the present study there was found no case when the predictive ability of the fixed models exceeded that of the random models. Nevertheless, in a special form of the non-random distributions of animals across the herds when the best sires were used in the worst herds then treating contempo-rary groups as fixed resulted in lower MSE and Bias compared to the random models. In this case the correlation between the true and predicted breeding values for the random model could become negative (Visscher and Goddard, 1993).
CONCLUSIONS
According to the results of the present and other authors it can be concluded that the official applica-tion of BLUP in the Hungarian pig breeding sector can be recommended as there was not found any systematic under- or overprediction due to environ-mental factors. Treating herd × year effect as random was superior to fixed effects when the variance due to herd × year effects was small (i.e. in the case of VC). However, the received differences were small. No significant differences were found for the other cases between the predictive abilities of alternative models. Based on the results it may be concluded that the use of either fixed or random models did not influence the predicting ability of the applied BLUP models for the analysed data set.
However, as noted by Visscher and Goddard (1993), when a genetic evaluation is going to be conducted, careful investigation of the data set is needed prior to the determination of the herd × year effect status. In case there is a special form of non-random distri-bution of sires across the contemporary groups (i.e. the best sires are used in the worst herds), then the application of the fixed model is preferable.
REFERENCES
Babot D., Nougera J.L., Alfonso L., Estany J. (2003): Fixed or random contemporary groups in genetic evaluation for li�er size in pigs using a single trait repeatability animal model. J. Anim. Breed. Genet., 120, 12–22. Bebber J. van, Reinsch N., Junge W., Kalm E. (1997):
Ac-counting for herd, year and season effects in genetic evaluations of dairy ca�le: a review. Livest. Prod. Sci., 51, 191–203.
Ducos A., Bidanel J.P., Naveau J. (1992): Estimation of genetic parameters and genetic trends for production
traits in the Sino-European Tiameslan composite line. J. Anim. Breed. Genet., 109, 108–118.
Estany J., Sorensen D. (1995): Estimation of genetic pa-rameters for li�er size in Danish Landrace and Yorksire pigs. Anim. Sci., 60, 315–324.
Götz K.U. (2002): Status of performance testing and ge-netic evaluation in the participating countries. In: In-ternational Workshop on Genetic Evaluation of Pigs, 17–21 April. Research Institute of Animal Production, Nitra, Slovakia.
Groeneveld E. (1990): PEST Users’ Manual. Institute of Animal Husbandry and Animal Behaviour Federal Research Centre, Neustadt. 1–80.
Groeneveld E. (1998): VCE4 Users’ Guide. Institute of Animal Husbandry and Animal Behaviour Federal Research Centre, Neustadt. 1–61.
Frey M., Hofer A., Künzi N. (1997): Comparison of mod-els with a fixed or a random contemporary group effect for the genetic evaluation for li�er size in pigs. Livest. Prod. Sci., 48, 135–141.
Hill W.G., Meyer K. (1988): Developments in methods for breeding value and parameter estimation in livestock. Occ. Publ. Brit. Soc. Anim. Prod,. 12, 81–98.
Hofer A., Frey M. (1995): Prediction of breeding values for li�er size in pigs using an animal model with fixed or random herd × year effect. In: 2nd Workshop on Advanced Biometrical Methods in Animal Breeding, June 12–20, Salzburg.
Kaplon M.J., Rothschild M.F., Berger P.J., Healy M. (1991): Genetic and phenotypic trends in Polish Large White nucleus swine herds. J. Anim. Sci., 69, 551–558. Kovac M., Groeneveld E. (1990): Genetic and
environ-mental trends in German Swine Herdbook Populations. J. Anim. Sci., 68, 3523-–3535.
Nagy I., Csató L., Farkas J., Radnóczi L., Szabó A., Vígh Zs. (2002): Analysis of the random distribution of the station tested pigs based on their genetic merit. Acta Vet. Hung., 50, 373–383.
Oikawa T., Sato K. (1997): Treating small herds as fixed or random in an animal model. J. Anim. Breed. Genet., 114, 177–183.
OMMI (National Institute for Agricultural Quality Control) (2002): Pig performance testing code. 4th ed. Budapest. Peškovičová D., Groeneveld E., Kumicík M., Hetényi L.,
Demo P. (1999): Genetic and environmental trends for production traits in the Slovakian pig population (in Slovak). Czech J. Anim. Sci., 44, 447–455.
ABSTRAKT
Analýza alternativních modelů uvažujících efekty interakce stádo × rok jako pevné nebo náhodné
Byla provedena analýza národní databáze staničních testů, které se uskutečnily v období od května 1996 do února 2001 a v nichž bylo použito maďarské bílé ušlechtilé plemeno. Do této analýzy byl zařazen počet dní v testu, celkové množství spotřebovaného krmiva a podíl cenných masitých částí. S použitím metody křížové validace byly vyřazeny malé podsoubory dat a provedena predikce tak, že byla použita zbývající část dat a efekty interakce stádo × rok uvažovány buď jako pevné, nebo jako náhodné. Velikost vyřazených dat byla 50 nebo 10 záznamů naráz a tento postup byl opakován 100krát, resp. 500krát. Pro všechny vyřazené podsoubory byla vypočítána střední kvadratická chyba, zkreslení a korelace. Významný rozdíl mezi pevnými a náhodnými modely nebyl zjištěn. U podílu cenných masitých částí náhodné modely vykazovaly menší střední kvadratickou chybu a vyšší korelaci mezi vyřazenými a predikovanými pozorováními než pevné modely.
Klíčová slova: predikční schopnost; BLUP; staniční test; plemena prasat
Corresponding Author
PhDr. István Nagy, University of Kaposvár, Guba Sándor str. 40, Kaposvár, H 7400, Hungary Tel. + 36 82 314 155, fax + 36 82 320 175, e-mail: [email protected]
Sonesson A.K., de Greef K.H., Meuwissen T.H.E. (1998): Genetic parameters and trends of meat quality carcass composition and performance traits in two selected lines of Large White pigs. Livest. Prod. Sci., 57, 23–32. SPSS Inc. (1999): SPSS for Windows. Version 10. Ugarte E., Alenda R., Carabano M.J. (1992): Fixed or
Ran-dom Contemporary Groups in Genetic Evaluations. J. Dairy Sci., 75, 269–278.
Visscher P.M., Goddard M.E. (1993): Fixed and Random Contemporary Groups. J. Dairy Sci., 76, 1444–1454. Wolf J., Wolfova M., Groeneveld E., Jelinkova V. (1998):
Estimation of genetic and environmental trends for production traits in Czech Landrace and Large White Pigs. Czech J. Anim. Sci., 43, 545–550.