Research paper
The contribution of visual information to the perception of speech in
noise with and without informative temporal
fi
ne structure
Paula C. Stacey
a,*, P
adraig T. Kitterick
b, Saffron D. Morris
c, Christian J. Sumner
c aDivision of Psychology, Nottingham Trent University, Burton Street, Nottingham NG1 4BU, UKbNIHR Nottingham Hearing Biomedical Research Unit, Ropewalk House, 113 The Ropewalk, Nottingham NG1 5DU, UK cMRC Institute of Hearing Research, University Park, Nottingham NG7 2RD, UK
a r t i c l e i n f o
Article history:
Received 3 December 2015 Received in revised form 6 April 2016
Accepted 11 April 2016 Available online 13 April 2016
Keywords:
Audio-visual Visual speech Temporalfine structure Sine-wave vocoding Cochlear implants
a b s t r a c t
Understanding what is said in demanding listening situations is assisted greatly by looking at the face of a talker. Previous studies have observed that normal-hearing listeners can benefit from this visual in-formation when a talker's voice is presented in background noise. These benefits have also been observed in quiet listening conditions in cochlear-implant users, whose device does not convey the informative temporal fine structure cues in speech, and when normal-hearing individuals listen to speech processed to remove these informative temporal fine structure cues. The current study (1) characterised the benefits of visual information when listening in background noise; and (2) used sine-wave vocoding to compare the size of the visual benefit when speech is presented with or without informative temporal fine structure. The accuracy with which normal-hearing individuals reported words in spoken sentences was assessed across three experiments. The availability of visual information and informative temporalfine structure cues was varied within and across the experiments. The results showed that visual benefit was observed using open- and closed-set tests of speech perception. The size of the benefit increased when informative temporalfine structure cues were removed. Thisfinding suggests that visual information may play an important role in the ability of cochlear-implant users to understand speech in many everyday situations. Models of audio-visual integration were able to account for the additional benefit of visual information when speech was degraded and suggested that auditory and visual information was being integrated in a similar way in all conditions. The modelling results were consistent with the notion that audio-visual benefit is derived from the optimal combination of auditory and visual sensory cues.
©2016 The Authors. Published by Elsevier B.V. This is an open access article under the CC BY-NC-ND license (http://creativecommons.org/licenses/by-nc-nd/4.0/).
1. Introduction
Speech perception in normal-hearing listeners is very resilient to distortions in the auditory signal and the presence of background noise. In contrast, understanding speech in background noise is
difficult for adults with hearing impairment (Davis, 1989; Kramer
et al., 1998) and is particularly problematic for users of cochlear implants (CI) whose device degrades the spectral and temporal
information in speech (Schafer and Thibodeau, 2004; Wolfe et al.,
2009; Fu et al., 1998; Skinner et al., 1994). Shannon et al. (1995) showed that when signals were presented in quiet, listeners with
normal hearing were able to tolerate a dramatic reduction in the amount of spectral and temporal information present in the speech signal before there was any appreciable effect on performance. The
‘noise-vocoding’technique used byShannon et al. (1995)involved:
(1) dividing the speech signal into a limited number of frequency
bands; (2) extracting the slow amplitude modulations or‘temporal
envelope’within each frequency band; and (3) using these
enve-lopes to modulate a wide-band random-noise carrier signal which
was thenfiltered by the samefilters used in stage (1). The use of a
random-noise carrier has the effect of replacing the informative
high-ratefluctuations in frequency near the centre-frequency of
each band with non-informative fine structure. As the first two
stages of this process mimic the processing stages implemented by a speech processor of a cochlear implant, vocoders have been
widely used to investigate the difficulties experienced by users of
cochlear implants. *Corresponding author.
E-mail addresses:[email protected](P.C. Stacey),[email protected]. uk (P.T. Kitterick), [email protected] (S.D. Morris), [email protected]
(C.J. Sumner).
Contents lists available atScienceDirect
Hearing Research
jo u rn a l h o m e p a g e :w w w . e l s e v i e r . c o m / l o c a t e / h e a r e s
http://dx.doi.org/10.1016/j.heares.2016.04.002
The inability of cochlear implants to convey informative
tem-poralfine structure cues has severe consequences for the ability of
cochlear-implant users to perceive speech in the presence of
background noise (e.g. Schafer and Thibodeau, 2004), and this
difficulty has been replicated using noise-vocoding in
normally-hearing individuals (Qin and Oxenham, 2003; Ihlefeld et al., 2010;
Rosen et al., 2013).Qin and Oxenham (2003)investigated speech perception in noise with 4-, 8-, and 24-channel vocoders. Normal-hearing listeners were presented with IEEE sentences, and the signal-to-noise ratio (SNR) at which performance was 50% correct
(known as the Speech Reception Threshold, SRT50) was estimated
by varying the relative levels of speech and noise. When speech was unprocessed and presented in single-talker background noise, participants could achieve 50% correct performance at an SNR
of 10.3 dB. When speech was then processed by an 8-channel
vocoder, listeners required the level of the speech to be 6.4-dB higher than the noise to reach the same performance level. The addition of more spectral channels improved performance with the
vocoder but a positive SNR (þ0.7 dB) was still required to report
50% of keywords correctly even in the 24 channel condition.Qin
and Oxenham (2003)concluded that the reduction of pitch cues
found in the temporalfine structure and low frequency harmonics
of speech may be responsible for this performance detriment. Somewhat lower levels of susceptibility to the presence of noise
have been reported for speech processed using a ‘sine-wave
vocoder’ in which the informative temporal fine structure is
replaced with sine waves rather than noise (Whitmal et al., 2007).
There is some evidence that sine-wave vocoders match the percept of cochlear-implant users more closely than noise-band vocoders
(e.g.Dorman et al., 1997) and are better at preserving the envelope
fluctuations present in speech (e.g.Whitmal et al., 2007; Dau et al.,
1999).
Although the impact of removing informative temporal fine
structure cues has been studied extensively for audio-only
situa-tions, its impact on the audio-visualperception of speech in noisy
conditions has received little attention, despite this being the more
ecologically relevant problem.Sumby and Pollack's (1954)seminal
work with normal-hearing adults showed that word recognition improved considerably under audio-visual conditions compared to listening to the audio alone. In fact, the addition of visual speech information was found to be equivalent to increasing the
signal-to-noise ratio byþ15 dB compared with audio-only presentation. It is
perhaps not surprising therefore that people with impaired hearing
and users of cochlear implants gain considerable benefit from being
able to see the faces of talkers (Erber, 1975; Kaiser et al., 2003; Tyler
et al., 1997).
Kaiser et al. (2003)tested only, visual-only, and audio-visual recognition of monosyllabic English words in both normal-hearing listeners and cochlear-implant users. Normal-normal-hearing
lis-teners were presented with words at 5 dB SNR, and
cochlear-implant users were presented with words in quiet. The results showed that both groups of listeners performed best in the audio-visual condition in which word recognition scores were similar in both groups. There was some evidence that cochlear-implant users made better use of visual information when listening conditions
were more difficult, such as when they were required to identify
lexically difficult words (low frequency words with many phonetic
neighbours,Luce and Pisoni, 1998). More recent studies have added
support to the idea that people with cochlear implants may be better at integrating auditory and visual information than
normal-hearing listeners (Rouger et al., 2007; Desai et al., 2008).
A number of previous studies have found that benefits from
visual speech information depend on the nature of the auditory
signal.Grant et al. (1985, 1991, 1994)investigated the way in which
different sorts of degraded speech signals combined with visual
speech cues. More recently,McGettigan et al. (2012)demonstrated
greater benefits from visual speech information for speech lacking
in auditory clarity, such that visual speech information boosted performance more for 2- and 4-channel noise-vocoded speech than it did for 6-channel vocoded speech.
These studies lead logically to the idea that the value of any
sensory input is notfixed, but can depend of the value or nature of
another sensory input; i.e. the visual signal is of greater value when
the auditory input is degraded. This is consistent with the‘Principle
of Inverse Effectiveness’(Lakatos et al., 2007; Tye-Murray et al.,
2010) which asserts that the value of one modality will increase as
the value of another declines. A number of models have been proposed to try to explain the nature of multisensory integration (Massaro, 1987; Blamey et al., 1989; Braida, 1991; Grant et al., 1998; Kong and Carlyon, 2007; Rouger et al., 2007; Micheyl and Oxenham, 2012). Models can be broadly categorised as to whether information is integrated in some raw sensory form before
any decision is made (‘pre-labelling’) or after decision processes are
applied separately to each modality (‘post-labelling’;Braida, 1991;
Peelle and Sommers, 2015).
Recently,Micheyl and Oxenham (2012)proposed a pre-labelling
model based on Signal Detection Theory (SDT) to explain the ca-pacity of normal-hearing listeners to integrate vocoded informa-tion in one ear with low-frequency acoustic informainforma-tion in the other ear. Their model and those applied in other similar studies
suggested that the benefits of integrating electric and acoustic
in-formation can be explained as an additive interaction (Seldran
et al., 2011; Micheyl and Oxenham, 2012; Rader et al., 2015) of
the raw sensory information prior to any decision.Rouger et al.
(2007)applied a post-labelling model to examine the properties of audio-visual integration, which assumes that decisions are made about individual cues prior to integrating these to make an overall
decision. Their model is an extension of the‘probability summation
model’ (Treisman, 1998), which states that the probability of
answering correctly is equal to the probability that either one or both of the modalities presented individually would result in the
correct answer. Interestingly, Rouger et al.’s implementation of this
model on their data suggested that integration across modalities operated differently in cochlear implantees and normal hearing subjects listening to noise-vocoded speech.
The current project systematically investigates the perception of sine-wave vocoded speech (labelled as ENV speech) at a range of
SNRs, and compares this with performance in‘clear’speech
con-ditions where informative temporal fine structure cues remain
(labelled as TFS speech). The primary question of interest is
whether the size of the benefit received from visual speech
infor-mation depends on the presence of informative temporal fine
structure information. This question was addressed using both open-set and closed-set tests of speech perception as we might
expect tofind differences between different types of speech tests
(seeLunner et al., 2012). Not only were we interested in whether any numeric improvement in performance with the addition of visual information depended on the presence of TFS, but also whether any observed differences implied a difference in the un-derlying integration process. Three experiments are presented
below; in thefirst participants completed an open-set sentence test
using a between participants design, the second reports an open-set sentence test using a mixed participants design, and the third reports a closed-set sentence test using a mixed participants design. Background noise consisted of multi-talker babble. In each
experiment we expected to find that visual speech information
2. General methods
2.1. Apparatus
The presentation of stimuli and collection of responses was achieved using the EPrime software (Version 2.0, Psychology Software Tools Inc., Sharpsburg, US). Acoustic stimuli were pre-sented over HD280pro headphones (Sennheiser, Wedemark, Ger-many) via a custom built digital-to-analogue converter. The presentation level of the acoustic stimuli was calibrated to achieve an average presentation level between 70 and 73 dB sound pres-sure level (SPL). Calibration was performed by coupling the
head-phones to an artificial ear (Brüel&Kjær Type 4153) using afl
at-plate adaptor. Calibration measurements were made using a
0.5-inch pressurefield microphone (Type 4192) connected to a sound
level meter (Type 2260). Visual stimuli were presented on a computer-controlled visual display unit measuring 25.4 cm high by 44.5 cm wide positioned approximately 0.5 m away from the par-ticipants and at head height.
2.2. Signal processing
Audio-visual sentence materials (IEEE sentences, IEEE, 1969)
were processed using the Matlab programming environment (Mathworks, Nantick MA). The desired signal-to-noise ratio (SNR) was achieved by attenuating the stimulus (for negative SNRs) or a multi-talker babble (for positive SNRs) and summing before nor-malising the RMS of the composite signal. The composite signal was
then band-passfiltered into 8 adjacent frequency bands spaced
equally on an equivalent rectangular bandwidth frequency scale
between 100 Hz and 8 kHz (Glasberg and Moore, 1990) using Finite
Impulse Responsefilters. In experimental conditions that included
informative temporalfine structure (TFS), the auditory stimuli were
constructed by summing the output of the eight band-passfilters.
In all other conditions (referred to as ENV), the temporal envelope
of eachfilter output was extracted using the Hilbert transform and
used to modulate a sine wave at the centre frequency of thefilter
and with alternating phase. The eight sine waves were then sum-med to form an auditory stimulus with uninformative TFS. This processing method ensured that the temporal envelopes were
similar regardless of whether thefine structure was informative
(TFS conditions) or uninformative (ENV conditions) (Eaves et al.,
2011).
2.3. Procedure
Participants sat in a quiet room in front of the computer-controlled visual display unit. On each trial, a stimulus was selected randomly from the corpus of audio-visual sentence ma-terials and the acoustic stimulus was presented over headphones while the visual display unit remained blank. In audio-visual con-ditions, a video showing the animated face of the talker uttering the same sentence was displayed simultaneously with the acoustic stimulus.
Four experimental conditions were defined by whether or not
the processing preserved informative TFS (processing
manipula-tion) and whether visual information was presented or not (
mo-dalitymanipulation). Stimuli were presented at a range of SNRs in
each condition. The specific range of SNRs in any particular
con-dition was chosen according to the stimulus materials used and the type of signal processing applied based on pilot testing in order to span the widest possible range of performance levels. The order of trials within each condition was randomised so that the SNR varied unpredictably from trial to trial.
A summary performance level was calculated for each SNR
within each condition. The method of calculating the summary performance level varied across the experiments according to the
materials used. A three- or four-parameter logistic function wasfit
to each participant's data using Matlab to describe the relationship between SNR and accuracy:
fðSNRÞ ¼aminþ ðamaxaminÞ
1þeðSNRx0Þ=
b
Whereamaxandaminare the asymptotic values of the function,x0is
the mid-point of the function, andbis the slope of the function. For
Experiments 1 and 2,aminwas always set to 0 to reflect the open-set
nature of the speech perception task that was used. As we show in
Section6.2, performance in visual-only conditions is non-zero but
very poor. The relatively small total number of key-words for each participant at each SNR (experiment 1: 50; experiment 2: 25) mean that small percentage differences cannot be resolved. In addition
allowing theaminparameter to vary tofit the data results in poorer
fits. Thefitted function was used to determine the SNR at which the
participant achieved an accuracy of 50% correct (the Speech
Reception Threshold, SRT50), as follows:
SRT50¼x0ln
ðamaxaminÞ
ð0:5aminÞ
1
3. Experiment 1
This experiment used an open-set test of speech understanding
to test the hypothesis that the benefit from visual speech when
listening in noise is larger when informative temporalfine
struc-ture is not available, such as in those who hear using a cochlear implant alone, compared to when informative TFS is available.
3.1. Methods
3.1.1. Participants
Twenty-eight students (9 male, age range 18e29 years) from the
Nottingham Trent University took part. All reported having normal hearing, normal or corrected-to-normal vision, and spoke English
as theirfirst language. Ethical approval was granted by the
Not-tingham Trent University.
3.1.2. Stimulus materials
The audio-visual materials were 80 IEEE sentences spoken by a single male talker with a British accent. Each sentence contained 5 key words. An example sentence with the key words underlined is
“The slang name for all alcohol is booze.”The auditory stimulus had
a sample rate of 44 100 Hz with 16-bits of quantization. The cor-responding video stimulus was recorded at 25 frames per second and measured 19 cm high by 24 cm wide on the visual display unit. Each sentence was approximately 3 s long.
3.1.3. Procedure
Each participant completed one of the four experimental
con-ditions defined by the factorial combination ofprocessingand
mo-dalitymanipulations, resulting in seven participants per condition. Pilot testing had indicated that the full range of performance levels could be spanned in most conditions by presenting the sentences at
SNRs between20 dB andþ8 dB in 4-dB intervals. In the condition
with auditory-only presentation and ENV speech, the range was adjusted as pilot testing indicated that participants required more favourable SNRs to achieve highly-accurate performance levels. In
andþ16 dB, with thefirst three participants being presented with
stimuli between16 andþ12 dB. On each trial, participants were
instructed to listen carefully to the sentence and repeat any words they could hear out loud. The experimenter recorded which words
were correctly identified and participants initiated the next trial. A
total of 10 sentences were presented at each SNR with each con-taining 5 key words. Performance at each SNR was summarised as
the percentage of the 50 key words that were identified correctly.
3.2. Results and discussion
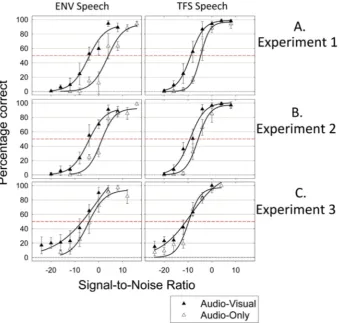
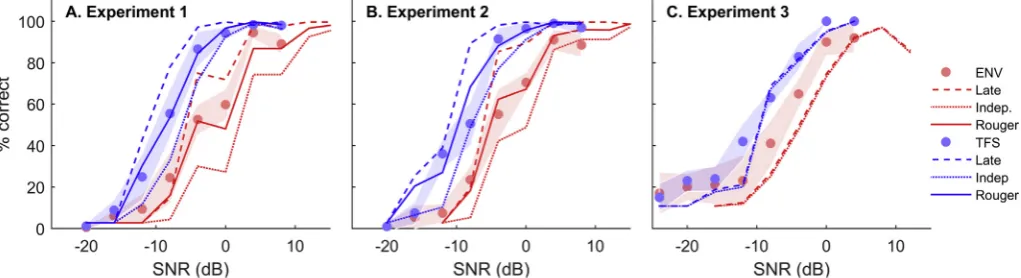
Fig. 1(Panel A) shows the percentage of key words identified correctly as a function of SNR in the four conditions of the main
experiment, with three-parameter logistic functions fit to the
average data. The pattern of the data confirmed that the
experi-ment had been successful in spanning the full range of performance levels and also that the data were well-described by a sigmoidal function. As expected, the location of the function varied as a
function of the availability of TFS and visual information. Fig. 2
(Panel A) shows the SRT50s for all conditions. Participants were
able to report 50% of key words correct (the SRT50) at
highly-adverse SNRs when both visual speech and TFS information were
available (mean 8.8 dB, s.d. 1.8) but required more favourable
SNRs to achieve the same performance level when neither type of information was available (mean 3.4 dB, s.d. 3.2).
The average SRT50s were subjected to an analysis of variance
with between-subject factors ofprocessing(TFS vs. ENV) and
mo-dality(auditory only vs. audio-visual). The analysis confirmed that
the SNR required to reach an accuracy of 50% correct was infl
u-enced by the presence of both visual information (F(1,24)¼48.19,
p<0.001,
hp
2¼0.69) and informative TFS (F(1,24)¼66.16, p<0.001,hp
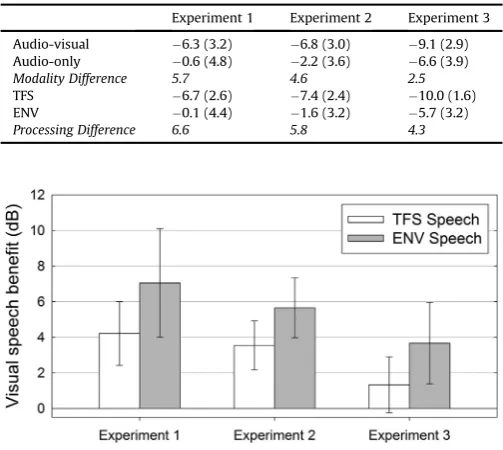
2¼0.73). The presence of visual speech information improvedperformance by a similar magnitude as the presence of TFS infor-mation, with an overall difference of 5.6 dB between audio-visual and audio-only conditions, and an overall difference of 6.6 dB
be-tween TFS and ENV conditions (Table 1).
The benefit gained from the addition of visual speech in each
condition is shown inFig. 3. The data did not support the
hypoth-esis that visual information is more valuable when informative TFS
is not available as no significant interaction was observed
(F(1,24)¼3.07, p¼0.092,
hp
2¼0.11). An analysis of the gradients ofthefitted sigmoidal functions revealed no significant main effect of
processingand no interaction, but slopes were marginally steeper in the audio-only conditions (mean slope at the 50%-correct point 19.6%/dB, s.d. 22.0) than in the audio-visual conditions (mean slope
at the 50%-correct point 8.3%/dB, s.d. 2.8) (F(1, 24)¼3.99, p¼0.057,
hp
2¼0.14).The results are compatible with the idea that seeing the face of the talker provides additional cues that can aid speech under-standing when acoustic information is degraded, whether by the presence of a background noise or by the unavailability of
infor-mative TFS. However, the lack of a significant interaction meant
that the results did not support the hypothesis that visual benefit
[image:4.595.125.468.378.701.2]when listening in noise is larger for those listeners who do not have access to informative TFS information such as cochlear-implant users.
Fig. 1.Speech perception performance (in % correct) as function of Signal-to-Noise ratio. The plots on the left show data for ENV speech, while the plots on the right show performance for TFS speech. Thefilled triangles show data from the Audio-visual conditions, and the open triangles show Audio-only performance. Error bars indicate sample 95% confidence intervals. Sigmoidal curves have beenfit to the averaged data. The red dashed line shows 50% correct performance. (For interpretation of the references to colour in this
Post-hoc power analyses indicated that the experiment had
sufficient power to detect the main effects ofprocessingand
mo-dality(power>0.99) but may have been underpowered to detect
the interaction effect (power¼0.27). An additional experiment was
therefore conducted which was powered prospectively to detect the interaction effect using a mixed experimental design in which
the effect of modality was assessed within rather than between participants.
4. Experiment 2
This experiment sought to replicate the main effects of manip-ulating the availability of informative TFS and visual information observed Experiment 1 but was prospectively designed and pow-ered to detect an interaction between the two manipulations. The experiment therefore tested the hypothesis that visual information
is more beneficial in the absence of informative TFS than when it is
present.
4.1. Methods
4.1.1. Power calculation
An analysis of the results of Experiment 1 suggested that the size of the interaction effect, expressed in terms of number of standard deviations, was 0.38. Presuming a within-subjects corre-lation between auditory-only and audio-visual performance of 0.5, detecting an interaction effect of this size in a mixed experimental
design with a power of 0.80 and
a
¼0.05 would require 16par-ticipants (Faul et al., 2007).
4.1.2. Participants
Sixteen students from the Nottingham Trent University, who
had not participated in Experiment 1 (3 male, age range 18e23
years) took part. All reported having normal hearing, normal or
corrected-to-normal vision, and spoke English as their first
language.
4.1.3. Procedure
The procedure was similar to that of Experiment 1. The SNR of
the sentences was varied between20 andþ8 dB in 4-dB intervals
except in the condition without either informative TFS or visual
information, in which the SNR was varied between 12 dB
andþ16 dB in 4-dB intervals for all participants. Participants were
presented with 5 sentences at each SNR rather than 10 as used in
Experiment 1. The factorial combination ofprocessing(TFS vs ENV)
[image:5.595.132.477.63.230.2]and modality(auditory-only vs audio-visual) defined four condi-tions. The modality of the stimuli was varied within participants while the type of processing applied was varied across two groups of eight participants. The scoring of responses and analysis of
Fig. 2.Speech Reception Thresholds: The Signal-to-Noise ratio at which performance was 50% correct. Calculated from 3-parameter sigmoidal functionsfit for each participant. Error bars indicate sample 95% confidence intervals. The dashed and dotted lines show the three models' (SDT Independent Noise, SDT Late Noise, and Rouger et al.’s model) predictions of the audio-visual (AV) data.
Table 1
Average SRT50s for each of the experiments, including the overall differences in
SRT50s according to modality and processing; formodalitythe Audio-visual and
Audio-only SRT50s have been averaged across both types of processing (TFS and
ENV) and forprocessingthe TFS and ENV SRT50s have been averaged over both
modalities (Audio-visual and Audio-only). All values show dBs, and standard de-viations are shown in brackets.
Experiment 1 Experiment 2 Experiment 3
Audio-visual 6.3 (3.2) 6.8 (3.0) 9.1 (2.9) Audio-only 0.6 (4.8) 2.2 (3.6) 6.6 (3.9)
Modality Difference 5.7 4.6 2.5
TFS 6.7 (2.6) 7.4 (2.4) 10.0 (1.6) ENV 0.1 (4.4) 1.6 (3.2) 5.7 (3.2)
Processing Difference 6.6 5.8 4.3
[image:5.595.42.294.346.571.2]performance was identical to that used in Experiment 1.
4.2. Results and discussion
The overall pattern of results was found to be very similar to that
of Experiment 1 (Fig. 1, panel B). The manner in which average
performance varied as a function of SNR was well-described by a sigmoidal function, whose place was similarly affected by both the type of processing applied to the auditory stimulus and the
avail-ability of visual information. An analysis of variance on SRT50s
(Fig. 2) confirmed a significant effect of both modality
(F(1,14) ¼ 100.21, p < 0.001,
hp
2 ¼ 0.88) and processing(F(1,14)¼105.30, p<0.001,
hp
2¼0.88). As in Experiment 1, visualspeech information and TFS cues impacted on SRT50s to a similar
degree (Table 1).
Unlike in Experiment 1, the interaction term was found to be
significant (F(1,14)¼5.30, p¼0.038,
hp
2¼0.27;Fig. 2). Inspection ofthe data confirmed that the effect of providing visual information
was larger when informative TFS was not available (Fig. 3). SRT50
decreased from5.6 dB to9.2 dB with the provision of visual
information in the TFS condition (mean change 3.5 dB, s.d. 1.7), and
from 1.3 dB to4.4 dB with the provision of visual information in
the ENV condition (mean change 5.7 dB, s.d. 2.0). An analysis of the
gradients of the logistic functions revealed no significant main
ef-fects or interactions.
The results of Experiment 2 supported the hypothesis that the
benefits of visual information are larger when speech is lacking in
informative TFS. Thisfinding is compatible with the idea that visual
information may be more beneficial for those who listen
exclu-sively through a cochlear implant. When listening in noise, the absence of informative TFS can hinder the ability to identify the target talker based on vocal characteristics and also to segregate speech from background noise based on cues such as periodicity (Moore, 2008). Listeners who cannot access TFS cues experience
severe difficulties with understanding speech in noise are therefore
more likely to benefit from exploiting the additional information
and redundancy provided through visual cues.
5. Experiment 3
Using an open-set test of speech perception, Experiments 1 and 2 demonstrated that the visual information provided by a talker's face can aid speech perception both when speech is degraded by background noise and when it is processed to remove informative TFS cues. It is possible that the contribution of TFS and visual speech cues may vary between open and closed-set tests due to differences
in the predictability of the target stimuli. For example,Lunner et al.
(2012)found larger benefits from TFS information for their young normal-hearing participants when they were presented with open-set tests of speech perception than when they completed a closed-set test. Therefore, the current experiment sought to establish whether the effects observed in Experiments 1 and 2 generalise to a closed-set test of speech perception using stimuli recorded by a different talker.
5.1. Method
5.1.1. Power calculation
No data were available with which to conduct a power calcu-lation to determine how many participants would be required to detect the interaction between modality and processing on a closed-set test. The previous power calculation for experiment 2 indicated that 16 participants would be required for an open-set test where the effect size for the interaction was estimated to be 0.38. As it was unclear whether this effect size would be larger or
smaller for a closed-set test, twenty participants were recruited
which was sufficient to detect an effect as small as 0.34 with a
power of 0.80 and
a
¼0.05.5.1.2. Participants
Twenty students (2 male, age range 18e25 years) from the
Nottingham Trent University took part. All reported having normal hearing, normal or corrected-to-normal vision, and spoke English
as theirfirst language.
5.1.3. Stimulus materials
The closed-set materials were 160 sentences from the GRID
corpus produced by the University of Sheffield (Cooke et al., 2006).
Each sentence took the form“Put Colour at Letter Number now.”An
example sentence is“Put Blue at G 9 now”. A single female talker
with a northern British accent was selected from the set of available talkers; this talker was of average intelligibility according to the
audio-only intelligibility tests carried out byCooke et al. (2006).
The auditory stimulus was recorded at a sample rate of 25,000 Hz with 16-bits of quantization. The corresponding video stimulus was recorded at 25 frames per second. Each sentence was approxi-mately 3 s long. The 160 sentences selected incorporated the 10
most difficult letter words to identify based on pilot testing.
5.1.4. Procedure
The procedure was similar to that of Experiments 1 and 2. The
SNR of the sentences was varied between24 andþ4 dB in 4-dB
intervals except when neither visual information nor informative TFS was available. In that condition, the SNR was varied
between16 andþ12 dB to avoidfloor effects at multiple SNRs.
Ten sentences were presented at each of the 8 SNRs providing 80 trials in both the auditory-only and audio-visual conditions. After a set of 10 practice trials, participants were presented with the 160 sentences in a random order. The type of processing (TFS or ENV) was varied between two groups of 10 participants.
On each trial, participants were instructed to listen carefully to the sentence and to use a computer mouse to select the correct letter word from a matrix of possible options. The matrix was shown on the visual display unit after the stimulus had ended. They were also asked to identify the number word from 5 alternatives. Pilot testing had indicated that performance on this secondary task approached ceiling and it was included to ensure that participants were attending and listening to the sentences throughout. The experiment took approximately 20 min to complete. Performance was summarised as the percentage of sentences on which the
correct letter word was identified at each SNR.
5.2. Results and discussion
In general terms, the results of Experiment 3 were similar to
those of Experiments 1 and 2.Fig. 1(Panel C) shows the average
performance at each SNR for the auditory-only and audio-visual materials in the TFS and ENV groups. An analysis of variance on
SRT50s confirmed the main effects of modality (F(1,18) ¼16.61,
p<0.001,
hp
2 ¼0.48) andprocessing(F(1,18)¼34.80, p <0.001,hp
2 ¼ 0.66) but the interaction failed to reach significance(F(1,18)¼3.63, p¼0.073,
hp
2¼0.17).Table 1shows that the overalldifference between audio-visual and audio-only conditions was numerically smaller (2.5 dB) than the difference between TFS and ENV conditions (4.36 dB). While performance in all conditions was well-described by a logistic function, as in Experiments 1 and 2, the slope of the function was less steep in conditions where visual in-formation was provided (mean audio-visual slope 6.3%/dB, s.d. 5.6;
mean auditory-only slope 16.7%/dB, s.d. 20.6) (F(1,18) ¼ 7.59,
revealed no other main effects or interactions.
The contribution of TFS and visual speech information was calculated individually for each of the 10 letter words participants
were presented with. Data were collapsed across16 toþ4 dB
SNRs (as these were used in all conditions) in order to give the
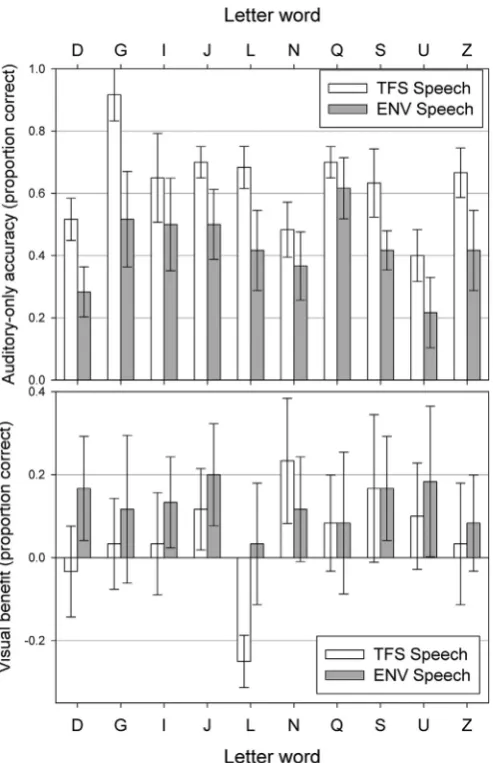
overall proportion of letter words correct. The top panel ofFig. 4
shows that TFS information benefitted the recognition of all the
letter words, with particularly large benefits for‘D’,‘G’,‘L’, and‘Z’. A
10 (letter word) x 2 (processing) mixed ANOVA on overall
perfor-mance in the Auditory-Only condition revealed a significant main
effect ofletter word(F(9,162)¼15.13, p<0.001,
hp
2¼0.46)con-firming that some words were easier to identify than others, a main
effect ofprocessing(F(1,18)¼86.98, p<0.001,
hp
2¼0.83) such thatoverall performance was better with informative TFS, and a
marginally significant interaction (F(9,162) ¼ 1.93, p ¼ 0.051,
hp
2 ¼0.097). Post-hoc t-tests with a False Discovery Rate (FDR)correction for multiple comparisons revealed that performance was
better in the TFS condition for all letter words except‘I’,‘N’, and‘Q’.
The bottom panel ofFig. 4 shows the visual benefit for each
letter word in TFS and ENV conditions. For the TFS condition, there
was significant visual benefit for ‘J’ and ‘N’, while for the ENV
condition there was significant visual benefit for‘D’,‘I’,‘J’,‘S’, and
‘U’. A 10 (letter word) x 2 (processing) mixed ANOVA on visual
speech benefit revealed a significant main effect of letter word
(F(9,162)¼4.40, p<0.001,
hp
2¼0.20) confirming that some wordsbenefitted more from visual speech than others, a main effect of
processing(F(1,18)¼4.42, p<0.05,
hp
2¼0.20) such that there wasoverall more benefit from visual speech for the ENV condition, and
a marginally significant interaction (F(9,162) ¼1.90, p ¼ 0.055,
hp
2¼0.096). Post-hoc t-tests with FDR correction revealed that theonly significant difference in visual speech benefit between TFS and
ENV was for the letter word“L”, where performance was poorer
with visual speech information in the TFS condition.
The results of Experiment 3 were broadly similar to the previous
experiments in confirming the beneficial nature of visual
infor-mation and informative temporal fine structure when reporting
words embedded in sentences spoken in the presence of
back-ground noise. The benefit from visual information was also found to
be numerically greater in ENV than in TFS conditions. To examine the consistency of this interaction effect and to better estimate the
true size of the additional benefit of visual information without
informative TFS, the results from the three experiments were subject to a random-effects meta-analysis. The analysis indicated that heterogeneity, expressed in terms of the ratio between the
total heterogeneity and total variance, was low (I2¼0%) and not
significant (Cochran's Q(2)¼0.16, p>0.05), indicating that the size
and variability of the effect was similar across the three
experi-ments. The pooled estimate of the size of the additional benefit that
visual information provides in the ENV compared to TFS condition
was 2.3 dB and was found to be significantly greater than zero (95%
confidence interval 1. to 3.6 dB;Fig. 5). This meta-analysis suggests
that visual information contributes significantly more to speech
understanding in noise when informative TFS information is not available, akin to the input to cochlear-implant users, compared to when informative TFS cues are available as in normal-hearing listeners.
6. Modelling the audio-visual interaction
The meta-analysis of Experiments 1 to 3 suggests that there is a
modest but consistent increase in benefit from visual information
[image:7.595.46.293.327.709.2]when acoustic signals are degraded: introducing visual information
Fig. 4.Proportion of letter words correct. The top panel shows auditory-only accuracy for TFS and ENV conditions, and the bottom panel shows Visual Benefit. Error bars indicate 95% confidence intervals.
[image:7.595.316.556.496.692.2]lowers (improves) SRT50s to a greater degree when informative TFS information is not available compared to when it is available. One possible explanation for the increased utility of visual information when auditory information is degraded is that listeners integrate
information more efficiently in some way under these adverse
conditions. An alternative explanation is that performance differ-ences arise naturally from the way that the two sources of
infor-mation are combined. The plausibility of these differing
explanations was explored by re-analysing the data from Experi-ments 1 to 3 using two different types of decision models based on signal detection theory, and a model based on probability-summation.
6.1. Methods
Signal detection theory (SDT) considers that a sensory decision must be made on the basis of one or more noisy sensory variables (Green and Swets, 1966). In SDT, the discriminability of two different signals depends on the both the mean difference between sensory variables for the two stimuli and the trial-to-trial
vari-ability (or‘noise’). The proportion of correct trials that an observer
will achieve when presented with stimuli in a single modality can
be expressed as a function of theoverall discriminability,d’, of them
different stimulus categories that are presented:
P¼
Zþ∞
∞
fðzd0Þ
F
mðzÞdz (1)where
f
(.) is the standard normal probability density function andF
(.) is the cumulative standard normal function. This approach canbe extended to multiple sources of information such as auditory and visual speech used in the present experiments. There are many ways information could be combined. Here we adopt a previously
described model for combining such information (seeMicheyl and
Oxenham, 2012).
In SDT, the variability of the sensory representation is in part
considered to be due to ‘internal’noise. In the case of multiple
sources of information, noise can arise both before (‘independent
noise’) and after (‘late noise’) integration (but still prior to any
decision; i.e. pre-labelling). These different sources of noise affect the integration process in different ways. The equation below as-sumes that raw sensory information is combined prior to arriving a
decision (Braida, 1991), and that noise arises in the observer's
in-ternal representation of both the auditory and visual stimuli independently before the sources of information are integrated (Micheyl and Oxenham, 2012)1:
P¼
Zþ∞
∞
f
z
ffiffiffiffiffiffiffiffiffiffiffiffiffiffiffiffiffiffiffiffiffiffiffiffiffiffiffiffiffiffiffiffiffi
d0A2 þ d0V2
q
F
mðzÞdz independent noise model(2)
where d’A and d’V represent the overall discriminability of the
auditory and visual stimuli respectively. An alternative assumption is that noise arises in the observer's internal representation of the audio-visual stimulus after the information in the two modalities
has been combined (the so-called ‘late noise’ model). This ‘late
noise’model can be expressed through a further revision of
Equa-tion(2), as follows:
P¼
Zþ∞
∞
fzd0Aþ d0V
F
mðzÞdz late noise model (3)FollowingMicheyl and Oxenham (2012), Equations(2) and (3)
represent the extreme cases where one source of internal noise
dominates; i.e. all noise is assumed to arise before (Equation(2)) or
after (Equation (3)) integration. Following previous studies that
have suggested that open set speech perception is best modelled as dependent on vocabulary size (Musch and Buus, 2001), the value of
min Experiments 1 and 2 was set to 8000. For Experiment 3,mwas
set to 10 to reflect the number of possible response options on the
closed-set test of speech discrimination.
To examine the capacity of the SDT noise models to explain the pattern of performance observed across the three experiments,
Equations(2) and (3) were used to generate predictions for
per-formance in the AV conditions. Predictions with and without informative TFS information were generated at each SNR and
independently for each experiment. As equations (2) and (3)
require data on Visual-only (VO) performance, an additional 10
participants (age range 21e71 years, 7 male) from the MRC Institute
of Hearing Research were recruited in a supplemental experiment. They completed both the open-set sentence test (from Experiments 1 and 2) and the closed-set test (from Experiment 3) in an order counterbalanced across participants. For the open-set test, partic-ipants were asked to attend carefully to each sentence and report any words they could perceive. Participants were presented with 80 IEEE sentences, leading to a total of 400 key-words per participant. For the closed-set test, participants were presented with 80 GRID sentences, which incorporated 8 of each of the 10 consonant sounds that were used.
The value of the parametersd’Aandd’Vin Equations(2) and (3)
were therefore computed directly from the AO and VO conditions
using Equation(1), with the performance levelPat a particular SNR
set to the observed mean performance level in the data. The ability of one model to generate accurate predictions of AV performance within a single experiment could be interpreted as evidence that a
particular model of audio-visual integration better reflects the
underlying decision processes adopted by listeners. Performance intermediate to the two models would suggest a mix of unisensory and crossmodal noise sources. Performance outside of the extremes of the two models would imply either a supra-additive, or sub-additive combination of sensory information.
The results were also modelled using Rouger et al.’s (2007)
extension of the‘probability summation model’(Treisman, 1998).
The probability summation model states that the probability of answering correctly is equal to the probability that either one or both of the modalities presented individually would result in the correct answer. Formally this can be written:
P¼PAOþPVOPAOPVO (4)
wherePAOandPVOare the probability of answering correctly in the
AO and VO conditions. Rouger et al. generalised this model to one in which there were an arbitrary number of independent unisensory
‘cues’and that overall probability of answering correctly was equal
to the probability thatTor more of those cues would be correctly
identified. The case where T¼1corresponds to equation(4), and
1 We chose this model because it is often superior to the alternative
provides the lower bound for this kind of model. They term this the
‘minimal integration’ model since it assumes that auditory and
visual information are evaluated as independent single sources of information. This family of models fall into the post-labelling category since integration is modelled as the combination of the probability of correct decisions. Note that this model cannot work
with a closed set. For eqn.(4), in Experiment 3 chance performance
is 10% and it predicts 19.9%.
The goodness of fit of each model to each experiment was
assessed using aХ2test between the data and each of the models
(Table 2). To indicate whether the data was significantly different from a resulting model, we performed bootstrap simulations of a
simple version of thefitted model (Langeheine et al., 1996). In a
single simulation, for each AV condition (SNR, TFS vs. ENV), numbers were drawn from a binomial distribution with a
proba-bility corresponding to the fitted model value and sample size
corresponding to that point in the data. From the number of correct
and incorrect trials in each condition we computed X2 of these
simulated values against the mean model output. This gave the
goodness offit for a single simulated run of the model against mean
model values. Repeating this simulation of the model many (5000)
times yielded a distribution ofX2values, and the likelihood (i.e.
p-value) of observing a given goodness offit under the assumption
that the model was correct. From this were able to compute the likelihood of observing the data if the model were correct.
6.2. Results and discussion
The average visual-only performance for the open-set IEEE test was 2.85% key-words correct (s.d. 3.20), and was 10.8% (s.d. 3.5) letter-words correct in the closed-set GRID test.
The two variants of SDT models were evaluated by their ability to predict the AV condition, given the performance in the AO and VO conditions. The results of applying the models revealed that the observed AV performance for ENV and TFS conditions in
Experi-ments 1 and 2 lay between the‘independent’and‘late’noise SDT
models (Fig. 6, Panels A and B, seeTable 2for mean signed errors
andX2). The Rouger model, applied directly to the data with no
fitting of the parameters (T¼6, as inRouger et al., 2007), provided a
reasonable qualitativefit to all the conditions in Experiments 1 and
2.
Both models under predicted AV performance in Experiment 3
[image:9.595.42.568.668.743.2]for both the ENV and TFS conditions by ~8% (Fig. 6, Panel C and
Table 2). This result stemmed from the fact that performance in the VO condition of Experiment 3 did not exceed chance levels. Therefore, no further evaluation of modelling Experiment 3 was conducted (see discussion).
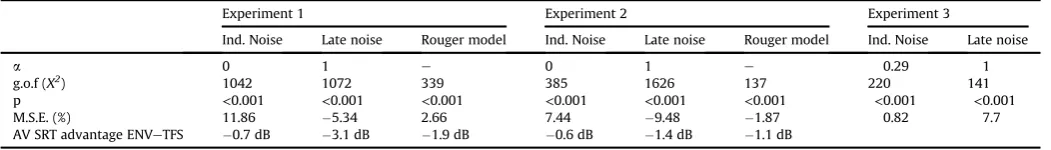
Fig. 2shows thefits of the models to the data in terms of SRT50s. Table 2providesX2goodness offit and estimates of the likelihood of
the model being correct. Both SDT models are significantly different
from the data, implying an intermediate model would be required to explain both TFS and ENV data. Thus, the data in both TFS and
ENV conditions appear to be consistent with the optimal combi-nation of auditory and visual information, and may result from a
mixture of independent and late noise sources. The visual benefit
varied from0.6 dB to3.1 dB (seeTable 2) and the size of the
observed visual benefit did not exceed that predicted by the
purely-additive SDT models of integration. The data are also reasonably consistent with the post-labelling model proposed by Rouger et al., even using the exact same model parameters as they did, although
this model is nevertheless not a perfectfit to the data (p<0.05,
Table 2). Thus, overall no models can account completely for the data. However, qualitatively they suggest that the way in which acoustic and visual information is combined is similar for acoustic input with and without informative TFS, whether assessed in the light of pre-labelling or post-labelling models.
7. General discussion
The current series of experiments investigated the benefits
ob-tained from visual speech information when listening to degraded speech in background noise. The results show that the availability of visual speech information improves the understanding of speech with and without informative TFS; i.e. listeners were able to tolerate more noise in the signal when visual speech information is present. In addition, the present results suggest that the size of the
benefit from visual speech information is greater, by roughly
dou-ble the amount, when informative TFS is not availadou-ble. This pattern of results was found to be consistent across different experimental designs (between or mixed groups), speech tasks (open vs closed set), and stimuli.
7.1. Effects of visual speech and TFS information
In the open-set experiments reported in Experiments 1 and 2,
the size of the benefit received from TFS and visual speech
infor-mation are similar in magnitude. In Experiment 1, when combined
across AV and AO modalities, the SRT50was 6.6 dB lower for TFS
than for EVV speech. This compares with a difference of 5.6 dB between audio-visual and audio-only conditions when combined across TFS and ENV speech types. For Experiment 2 the speech processing difference was 5.8 dB compared with 4.6 dB for the
modality difference. Thesefigures reinforce the importance of
vi-sual speech information when processing speech in background
noise. The difficulties faced by cochlear-implant users are well
documented, and many studies have demonstrated the poor per-formance of normal-hearing participants when TFS information is removed in vocoder simulations, especially when listening in
background noise (Qin and Oxenham, 2003; Ihlefeld et al., 2010;
Rosen et al., 2013). However, the importance of visual speech in-formation when listening to degraded speech in background noise
has received little investigation. Therefore, in order to truly reflect
the performance of listeners in demanding situations, the role of visual speech information needs to be taken into account.
Table 2
For each experiment the results offitting the different models. The goodness offit is expressed as theX2statistic between the AV data conditions and model,prepresents that
probability that these are indistinguishable, and the mean signed error (in % correct) between the data and model indicates where the real performance is greater than or less than the models. The bottom row gives the SRT advantage of adding visual information for the ENV condition over the TFS condition.
Experiment 1 Experiment 2 Experiment 3
Ind. Noise Late noise Rouger model Ind. Noise Late noise Rouger model Ind. Noise Late noise
a 0 1 e 0 1 e 0.29 1
g.o.f (X2) 1042 1072 339 385 1626 137 220 141
p <0.001 <0.001 <0.001 <0.001 <0.001 <0.001 <0.001 <0.001
M.S.E. (%) 11.86 5.34 2.66 7.44 9.48 1.87 0.82 7.7
A strength of the current series of experiments is that we have demonstrated similar effects of visual speech and TFS information across open- and closed-set tests of speech perception. This is
important as some research (e.g.Lunner et al., 2012) has shown that
the importance of TFS information may vary according to the type
of speech test used. Consistent with the predictions fromLunner
et al. (2012) we did find numerically smaller benefits of visual speech information and TFS cues in Experiment 3, where the choices presented to participants reduced uncertainty, and perhaps also reduced the usefulness of TFS cues and visual speech information.
The closed-set test also allowed us to look more closely at which
stimuli in particular benefitted from visual speech and TFS
infor-mation, with some letter words being more affected than others.
Specific letter words that benefitted from TFS information included
‘D’,‘G’,‘L’, and‘Z’, and the letter words‘J’and‘N’benefitted most
from visual speech information. However, due to limitations in the nature of the stimuli (being letter words and not consonant sounds), a full phonetic analysis was not possible. Future research with consonant sounds would allow an information transfer
anal-ysis (Miller and Nicely, 1995) to be performed, which would enable
an analysis of the extent to which different speech sounds (e.g. place, manner, and voicing) were transmitted to the listener. This would reveal further insights into the way in which visual speech and TFS cues interact for different features under noisy speech conditions that were not possible to perform using data from the current study.
7.2. Visual-only performance
Visual-only (VO) performance was also tested for the open-set IEEE sentences used in Experiments 1 and 2, and for the closed-set GRID test used in Experiment 3. The average VO performance was 2.85% keywords correct for the IEEE sentences and was 10.8% consonants correct for the GRID sentences. The average perfor-mance levels for the IEEE sentences demonstrates the fact listeners were on average able speechread some information from the
sen-tences, although to a limited extent.Altieri et al. (2011)found much
higher levels of performance for a group of young normal-hearing
participants when given the CUNY sentence test (Boothroyd et al.,
1988); participants reported an average of 12.4% of words correct
(standard deviation 6.67%). Higher levels of performance are however to be expected for CUNY sentences as they are semanti-cally and syntactisemanti-cally more predictable than IEEE sentences. The average VO performance of 10.8% on the closed-set GRID sentences
reflects the fact that participants were not able to lipread the target
letters at a level above chance (given that there were ten response
options). Part of the difficulty with these tasks is that visual speech
reading performance is challenging and participants may well have struggled to maintain motivation. In all experiments VO conditions were performed as a separate block. For the open-set task, verbal responses were recorded by an experimenter present in the sound booth, and we can be sure that the participants were engaged appropriately in the task. For the closed-set task, responses were made via a computer in isolation in a sound booth, making it
difficult to monitor task engagement. Motivation was less likely to
be a problem in AO or AV conditions, since the overall performance was higher. Consistent with this interpretation, asymptotic per-formance at the lowest SNRs in the AV conditions was considerably higher than chance, whilst AO conditions were not.
7.3. The nature of multisensory integration
Although there is a significant numerical advantage of visual
speech information for ENV speech, this advantage is consistent with models which assume that visual information is integrated in a consistent way and regardless of whether TFS is available or not. The results from the SDT models are consistent with previous research that has modelled the advantages that arise from receiving
combined electrical and residual acoustic stimulation (Seldran
et al., 2011; Micheyl and Oxenham, 2012; Rader et al., 2015). In fact, the diversity in the balance between independent and late
noise is also seen across other experiments (Micheyl and Oxenham,
2012). In addition, using Braida's (1991) pre-labelling model of
integration,Grant et al. (2007)showed that normal-hearing and
hearing-impaired listeners exhibited a similar degree of integration
efficiency of auditory and visual information. These findings
therefore imply that the larger body of data on audio-visual
inte-gration in conditions of normal, undegraded speech (e.g.
Tye-Murray et al., 2010; Sumby and Pollack, 1954), and studies of
audio-visual integration in hearing impaired listeners (e.g.Grant
et al., 1998; Grant et al., 2007) may well apply to degraded speech conditions and perhaps to users of cochlear implants.
Our data for both ENV and TFS speech were also well explained
by the model used byRouger et al. (2007). Thefinding that Rouger
et al.’s modelfit our data for the vocoded speech condition is
inconsistent with their data which suggested that compared with cochlear-implant users, normal-hearing participants integrated sub-optimally when listening to noise-vocoded speech. However,
given that Rouger's modelfits our data well, it is clear that the
differences in conclusions reflect differences between their data
[image:10.595.39.550.67.206.2]and ours; while the normal-hearing participants who listened to vocoded speech integrated sub-optimally in Rouger's study, our normal-hearing participants displayed optimal integration of
auditory and visual information.
The models failed to predict the data for Experiment 3. However, performance in the VO condition here was very close to chance.
Since d’~0, we would not expectanymodel of integration to predict
the AV performance, which was improved over AO conditions, albeit only slightly overall. This could indicate some fundamental limitation of such models. However we think it more likely that it
reflected poor motivation for the AO conditions in Experiment 3, as
discussed above.
Finally, we note that although our data are consistent with a mixed noise source additive-SDT model, we do not know of an
analytical equation similar to Equations (2) and (3) that can
parameterise such a mix of noise sources, which would allow a
quantitativefit to the data to be assessed. The lack of a more precise
fit of the SDT models cannot be taken as evidence in favour of
post-labelling models such as proposed by Rouger et al. We refer the
reader to Micheyl and Oxenham (2012) for a discussion of the
theoretical merits of different models.
7.4. Limitations&future research
The current work provides a starting point for investigations of
the benefits obtained through visual speech information when
listening to degraded speech in noise, and there are several avenues through which the work can be extended upon. One such avenue is to consider the type of background noise which is used. We have used multi-talker babble here, but it is possible that maximum
visual speech benefit will occur with only a few competing talkers
(e.g. 2, 4), when informational masking causes difficulties for
speech perception (Freyman et al., 2004; Brungart et al., 2009).
These are situations when additional listening strategies such as
‘dip-listening’ are possible and TFS cues might be particularly
important (Lorenzi et al., 2006; Moore, 2014; see alsoBernstein and
Grant, 2009). Thus, it is difficult to predict whether estimates from the current experiment will generalize to situations with small numbers of background talkers. However, it should be noted that Rosen et al. (2013) found very small effects of the number of masking talkers when the speech and noise were both noise vocoded. It should also be acknowledged that only a single talker recorded the speech materials in Experiments 1 and 2, and a different talker was used in Experiment 3. Extending this work to different talkers is important as the utility of visual speech cues may differ according to the individual characteristics of different
talkers (seeYakel et al., 2000).
One question arising is to what extent degrading the speech stimuli generally led to a greater reliance on the visual signal, rather
than the removal of information in the stimulus TFSper se. Two
audio manipulations were used in these experiments: variation in SNR and removal of cues from the stimulus TFS. All the variants of models presented here are relatively successful in accounting for both of these manipulations. They assume that the interaction with the visual stimulus is exactly the same whether TFS or SNR are manipulated. Thus the modelling suggests that, at least for these two manipulations, it is intelligibility that matters and not the nature of the degradation. This could be logically tested further with, for example, manipulations of the spectral resolution, or stimuli that preserve TFS cues at the expense of ENV cues.
Limitations of vocoding as a simulation of the performance of cochlear-implant users also need to be acknowledged. The acoustic simulation used here simulates only the consequences of removing
TFS from the speech signal andfiltering the speech into a discrete
number of frequency bands. Many other factors, such as the spread
of electrical current along and across the cochlea (Cohen et al.,
2003), are not simulated, and the primary sources of stochasticity
(normal hearing: inner haircell/auditory nerve synapse, Sumner
et al., 2002; cochlear implant: spiral ganglion cell excitability, Horne et al., 2016) are very different. Thus, the encoding of speech on the auditory nerve is expected to be very different between electrical and tone-vocoded inputs. One potential difference in the
nature of encoding has been highlighted recently byShamma and
Lorenzi (2013), who applied a model of early auditory processing explain the auditory nerve responses to Amplitude Modulated (AM) and Frequency Modulated (FM) vocoded speech. The AM conditions were the same as the ENV condition described here; the FM component was replaced by a tone with frequency equal to the
central frequency of the analysis band. Shamma and Lorenzi's
(2013)modelling suggested that regardless of vocoder manipula-tions, both ENV and TFS cues are expressed in the auditory nerve for vocoded speech, and both of these cues contribute to speech
intelligibly. Thus, they argue that processing the speech tofilter out
TFS or ENV cues is not reflected in auditory nerve responses to
these speech stimuli. They argue further that this is contrary to the auditory nerve responses for users of cochlear implants. It is therefore important to make the distinction between ENV and TFS cues present in the stimulus, which are similar for tone vocoding and cochlear implants, and the nature of the encoding on the auditory nerve which for the numerous reasons outlined is likely to be very different.
Another concern is that vocoder simulations in normal-hearing listeners cannot account for any adaptation to electrical stimulation over extended periods of time. Therefore, one must exercise
caution in generalising the currentfindings related to the effects of
informative TFS in normally-hearing listeners to users of cochlear implants. Future work with users of cochlear implants will estab-lish whether the same pattern of results is observed. In addition, testing users of cochlear implants with the ENV conditions will allow us to test whether this manipulation introduces distortions that are additional to those attributable to their implants.
7.5. Conclusion
Visual information appears to be integrated in a similar way whether or not TFS cues are present in speech. However in practice this results in slightly better SNR advantages in the absence of TFS cues. Regardless, it suggests that visual information is at least as valuable when the auditory signal is degraded and this corresponds
to a very valuable gain (4e7 dB advantage in SNR). The results from
the current studies suggest that the role of visual speech infor-mation needs to be given greater emphasis when evaluating peo-ple's ability to understand speech in noise, especially when faced with degraded speech input.
Acknowledgements
Work supported by the Nottingham Trent University, the NIHR Nottingham Hearing Biomedical Research Unit, and the MRC Institute of Hearing Research (grant number U135097127).
References
Altieri, N.A., Pisoni, D.B., Townsend, J.T., 2011. Some normative data on lip-reading skills. J. Acoust. Soc. Am. 130 (1), 1e4.http://dx.doi.org/10.1121/1.3593376. Bernstein, J.G.W., Grant, K.W., 2009. Auditory and auditory-visual intelligibility of
speech influctuating maskers for normal-hearing and hearing-impaired lis-teners. J. Acoust. Soc. Am. 125 (5), 3358e3372. http://dx.doi.org/10.1121/ 1.3110132.
Blamey, P.J., Cowan, R.S.C., Alcantara, J.I., Whitford, L.A., Clark, G.M., 1989. Speech perception using combinations of auditory visual and tactile information. J. Rehab. Res. Dev. 26 (1), 15e24.
Boothroyd, A., Hnath-Chisolm, T., Hanin, L., Kishon-Rabin, L., 1988. Voice funda-mental frequency as an auditory supplement to the speechreading of sentences. Ear Hear. 9, 306e312.