Efficacy and safety of Cannabidiol and
Tetrahydrocannabivarin on glycaemic and lipid parameters in patients with Type 2 diabetes: a randomised, double
blind, placebo-controlled, parallel group pilot study
Journal: Diabetes Care Manuscript ID DC16-0650.R1 Manuscript Type: Original Article Date Submitted by the Author: 13-Jul-2016
Complete List of Authors: Jadoon, Khalid; University of Nottingham, School of Medicine Ratcliffe, Stuart; CogMaze Ltd
Barrett, David; University of Nottingham, Centre for Analytical Bioscience Thomas, E; University of Westminster
Stott, Colin; GW Pharmaceuticals Bell, Jimmy; University of Westminster
Efficacy and safety of Cannabidiol and Tetrahydrocannabivarin on glycaemic
and lipid parameters in patients with Type 2 diabetes: a randomised,
double-blind, placebo-controlled, parallel group pilot study
KA Jadoon1, SH Ratcliffe2, DA Barrett3, EL Thomas4, C Stott6, JD Bell4, SE O’Sullivan1* and GD Tan5*
1 Division of Medical Sciences & Graduate Entry Medicine, School of Medicine, University of Nottingham, Royal Derby Hospital Centre, Uttoxeter Road, Derby DE22 3DT, 01332724701.
2
CogMaze Ltd, London SW5 9SX
3 Centre for Analytical Bioscience, School of Pharmacy, University of Nottingham, Nottingham NG7 2RD
4
Research Centre for Optimal Health, Department of Life Sciences, University of Westminster, London, W1W 6UW.
5
The NIHR Oxford Biomedical Research Centre, Oxford Centre for Diabetes, Endocrinology & Metabolism, Churchill Hospital, Oxford University Hospitals NHS Trust, Oxford OX3 7LE
6 GW Pharmaceuticals, Sovereign House, Vision Park, Histon, Cambridge CB24 9BZ
*These authors contributed equally to this paper
Corresponding author: saoirse.osullivan@nottingham.ac.uk
Trial Registration (ClinicalTrials.gov): NCT01217112
Keywords: Cannabinoid, cannabidiol, delta-9-tetrahydrocannabivarin, type 2
diabetes, dyslipidaemia, phytocannabinoid, adipokine, oral glucose tolerance
Abstract
Objective Cannabidiol (CBD) and delta-9-tetrahydrocannabivarin (THCV) are
non-psychoactive phytocannabinoids affecting lipid and glucose metabolism in animal
models. This study set out to examine the effects of these compounds in patients with
type 2 diabetes.
Research Design and Methods In this randomised, double-blind, placebo-controlled
study, 62 subjects with non-insulin treated type 2 diabetes were randomised to five
treatment arms; CBD (100 mg twice daily), THCV (5 mg twice daily), 1:1 ratio of CBD
and THCV (5 mg:5 mg, twice daily), 20:1 ratio of CBD and THCV (100 mg:5 mg, twice
daily), or matched placebo, for 13 weeks. The primary endpoint was a change in
HDL-cholesterol concentrations from baseline. Secondary/tertiary endpoints included
changes in glycaemic control, lipid profile, insulin sensitivity, body weight, liver
triglyceride content, adipose tissue distribution, appetite, markers of inflammation,
markers of vascular function, gut hormones, circulating endocannabinoids and
adipokine concentrations. Safety and tolerability endpoints were also evaluated.
Results Compared with placebo, THCV significantly decreased fasting plasma
glucose (estimated treatment difference (ETD)=-1.2mmol/L, P<0.05) and improved
pancreatic β-cell function (homeostasis model assessment (HOMA2 B) (ETD=-44.51
points, P<0.01), adiponectin (ETD=-5.9 x 10⁶pg/mL, P<0.01) and apolipoprotein A (apoA) (ETD=-6.02µmol/L, P<0.05), although plasma HDL was unaffected. Compared
to baseline (but not placebo), CBD decreased resistin (-898 pg/ml, P<0.05) and
increased glucose-dependent insulinotropic peptide (21.9 pg/ml, P<0.05). None of the
combination treatments had a significant impact on endpoints. CBD and THCV were
Conclusions THCV could represent a new therapeutic agent in glycaemic
The endocannabinoid system (ECS) modulates food intake and energy homeostasis
(1, 2) and chronic over-activation of the ECS has been identified in obesity and type
2 diabetes (3). The ECS exerts some of its actions by various components activating
cannabinoid receptors 1 (CB1) and 2 (CB2). Modulation of CB1 receptors with rimonabant (a synthetic cannabinoid) led to a significant reduction in body weight,
waist circumference and triglyceride (TG) concentrations, and an increase in
HDL-cholesterol and adiponectin concentrations (4), as well as a reduction in HbA1c in
subjects with type 2 diabetes (- 0.8% to – 1.25%, P<0.001). However, marketing
authorisation for rimonabant was withdrawn in 2008 because of an increased
incidence of psychiatric adverse events (AEs) (5). Rimonabant is thought to be a
CB1 receptor antagonist/inverse agonist, but it is unclear whether modulation of other cannabinoid receptor activity could have beneficial metabolic effects without
significant psychiatric effects.
Cannabidiol (CBD) is one of the major phytocannabinoids obtained from the
Cannabis sativa L. plant. In rodent studies, CBD has multiple desirable effects in the
context of hyperglycaemia, mainly through its anti-inflammatory and anti-oxidant
properties (6-10). In animal models of obesity (ob/ob genetically obese mice), four
weeks treatment with CBD 3mg/kg, produced a 55% increase in HDL-C
concentration and reduced total cholesterol (total-C) by more than 25% (GW Pharma
data on file). In addition, the same dose reduced liver triglycerides and increased
both liver glycogen and adiponectin concentration. There is also evidence from
animal studies showing that CBD modulates cardiovascular response to stress (11).
cannabis misuse (13). Other receptor sites implicated in the actions of CBD include
the orphan G-protein coupled receptor-55 (GPR55), the putative endothelial
cannabinoid receptor (CBe), the transient receptor potential vanilloid 1 (TRPV1) receptor, α1-adrenoceptors, µ opioid receptors, the adenosine transporter and
serotonin-1A (5-HT1A) receptors (14). CBD also activates and has physiological responses mediated by peroxisome proliferator activated receptor γ (PPARγ) (15,16,
17). A CBD/THC combination (Sativex®/Nabiximols) is currently licensed in most EU
countries and in Canada, New Zealand, Australia, Malaysia, the United Arab
Emirates and Kuwait, for the symptomatic treatment of spasticity in moderate to
severe multiple sclerosis, and CBD alone (Epidiolex®) was granted orphan drug
designation by the FDA in February 2014 in Dravet and Lennox-Gastaut syndromes
in children, with Phase 3 clinical trials ongoing in those conditions.
∆9-tetrahydrocannabivarin (THCV) is a naturally occurring analogue of THC, but with different pharmacological effects. It is has been reported to behave as both a
CB1/CB2 agonist and/or a CB1/CB2 neutral antagonist (20, 21, 22, 23,24), probably dose-dependent, with agonism observed at high doses and antagonism at low doses
(21). However, there is little evidence of CB1 agonsim in vivo compared with the observed in vivo effects of THC at similar doses. Other target sites of action include
GPR55 (25) and transient receptor potential channels (26, 27).
Acute intraperitoneal administration of THCV in rodents at 3, 10 and 30 mg/kg body
weight, caused hypophagia and weight loss, with food intake and body weight
returning to normal on day 2 (18). The effect was similar to that of a CB1 antagonist AM251, also used in the same study. In another study, involving diet-induced obese
(DIO) mice, oral THCV (2.5 to 12.5 mg/kg) reduced body fat content, increased
glucose tolerance test (OGTT) (19). In the same study, in genetically obese (ob/ob)
mice, a similar increase in 24-hour energy expenditure was observed with 3mg/kg
THCV, while 12.5 mg/kg THCV caused a significant reduction in liver triglycerides
(19). In genetically obese mice (ob/ob), a 1:1 ratio of a combination of THCV and
CBD (3 mg/kg:3 mg/kg) reduced total cholesterol levels by 19% and increased
HDL-C by 50%. The same combination reduced liver TG, increased liver glycogen levels,
reduced fasting insulin and increased energy expenditure (GW Pharma data on file).
The findings from these preclinical studies demonstrate a potential beneficial effect
of both CBD and THCV, alone or in combination, in diabetes and lipid metabolism,
with very distinct pharmacological profiles, and therefore different side effects, to
rimonabant. This prompted the first ever investigation of the effects of CBD and
THCV on dyslipidaemia and glycaemic control in subjects with type 2 diabetes.
Research Design and Methods
Subjects and study design
This randomised, double-blind, placebo-controlled, parallel-group, phase 2a
proof-of-concept study was conducted at four United Kingdom centres. The protocol was
reviewed and approved by the East Midlands - Leicester Multi Centre Research
Ethics Committee (10/H0406/42) and local R&D departments as required, and was
conducted in accordance with the Declaration of Helsinki. All subjects provided
Subjects aged 18 years or above with type 2 diabetes and HbA1c ≤10%
(86 mmol/mol), HDL-C ≤1.3mmol/L in females and ≤1.2mmol/L in males, and plasma
triglycerides ≤10mmol/L, were eligible. Subjects needed to either receive no oral
hypoglycaemic agents or take stable doses of pre-specified non-insulin glucose
lowering therapies (metformin, sulfonylurea, dipeptidyl peptidase-4 (DPP-4) inhibitor
or glucagon-like peptide-1 (GLP-1) therapy) for three months prior to screening.
Subjects not on statin therapy or on a stable dose of a statin, for at least four weeks
prior to randomisation, were eligible for inclusion. Subjects were also required not to
make any changes to their diet or exercise for four weeks prior to randomisation and
during the course of the study.
Main exclusion criteria (see supplemental data for full details) included use of
prohibited medications (insulin, fibrates, thiazolidinediones, therapeutic omega-3
fatty acids, alpha-glucosidase inhibitors), recent or current use of cannabis, history of
significant depression, planned travel outside the UK during the course of study,
genetic dyslipidaemia or significant cardiac, renal or hepatic impairment.
There was a one to five week period between screening (visit 1) and treatment
randomisation (visit 2). Visit 1 could be split into two separate visits (1A and B) to
allow a 21-day washout period of the prohibited medications prior to blood sampling
for eligibility. Remaining visits occurred 4, 8 and 13 weeks after initiation of treatment
(visits 3, 4 and 5, respectively), or earlier if patients withdrew. A safety follow up visit
occurred 7 days after study completion or withdrawal (visit 6). Visits 4 and 6 were
Patients were required to take study medication in the fasted state, twice daily, 30
minutes before breakfast and 30 minutes before evening meal, typically 12 hours
apart for 13 weeks.
Study endpoints and assessments
The primary endpoint was change in mean serum HDL-C from baseline, in CBD and
THCV groups, compared with the change in placebo group, at week 13. Secondary
endpoints included changes in lipid profile, glycaemic control, insulin sensitivity, body
weight, visceral adiposity, appetite and cardiovascular function. Tertiary endpoints
were changes in markers of inflammation, vascular function, adipokines,
endocannabinoids and gut hormone concentrations.
Serum lipid concentrations were analysed with the Roche modular system using
enzymatic calorimetric assays. Non-esterified fatty acid (NEFA) concentrations were
quantified on the Roche COBAS 311 system, using an acyl-CoA
synthetase/acyl-CoA oxidase (ACS-ACOD) method. Apolipoprotein markers were analysed on the
Roche COBAS 311 system, using immunoturbidimetric assays, based on the
principle of immunological agglutination. Plasma VLDL-C concentrations were
determined by ultracentrifugation.
A standard 75 g OGTT was performed and plasma glucose and serum insulin were
analysed using the Roche modular system and Advia Centaur immunoassay
analyser respectively. HOMA-insulin resistance (IR), insulin sensitivity and β-cell
function were calculated using the HOMA2 Calculator v2.2© (Diabetes Trials Unit, University of Oxford).
Plasma endocannabinoids, N-arachidonoylethanolamine (AEA),
(PEA), were analysed using liquid chromatography-tandem mass spectrometry,
based on a previously published method (28). Ketones, orexin A and retinol binding
protein (RBP) 4 were analysed using immunoassay, while all other tertiary endpoints
including adiponectin, resistin, leptin, E-Selectin, vascular cell adhesion molecule
(VCAM), Von Willebrand factor (vWF), C-reactive protein (CRP), interleukin (IL) 6,
tumour necrosis factor (TNF) α, glucose-dependent insulinotropic peptide (GIP),
ghrelin and GLP-1 were analysed by multiplex analysis, using commercially available
kits (Milliplex™, HMHMAG-34K, HCVD1-67AK, HADK-1-61K-A, HCVD2-67BK,
BPHCVD05-6, Merck Millipore®).
Resting blood pressure was measured using digital blood pressure monitor while
cardiovascular parameters including systolic, diastolic and mean arterial pressure,
heart rate, stroke volume, cardiac output, inter beat interval, ejection time and total
peripheral resistance were measured using a Finometer® (Finapres Medical
Systems), which uses a finger-clamp method to detect beat-to-beat changes in
digital arterial diameter with an infrared photoplethysmograph.
Adipose tissue distribution was assessed using whole body magnetic resonance
imaging (MRI); images were analysed by a blinded investigator using SliceOmatic™.
Body weight and 7-point skin fold measures were also recorded. Hepatic TG
concentration was assessed using magnetic resonance spectroscopy (MRS) and
analysed using JMRUI software
Subject’s Global Impression of Change (SGIC) and Clinician’s Global Impression of
Change (CGIC) was assessed using an ordinal 7-point Likert scale (1=very much
improved to 7=very much worse). Changes in appetite were established using
0-10 numerical rating scale (NRS), where 0=no appetite (don’t feel hungry) and
10=maximum appetite (completely hungry all the time) (29). The change from mean
baseline score (mean of seven days before start of treatment) was compared to the
mean score from the last seven days on treatment (end of 13 weeks).
Safety assessments included reporting for adverse events (AEs) and serious
adverse events (SAEs), recording vital signs, pre- and post-treatment laboratory
sampling and electrocardiograms (ECG) and change from baseline in Beck
Depression Inventory-II (BDI-II) scores.
The BDI-II questionnaire, an assessment for anxiety and depression, is a multiple
choice, self-reported inventory, and is one of the most widely used and validated
instruments for measuring severity of depression (30).
Statistical methods
An independent statistician produced a schedule for random treatment allocation
which was held centrally and not divulged to any other person involved in the study
until the database had been locked. Patients were randomly allocated to treatment
groups in a 1:1:1 ratio, stratified by centre, according to the randomisation schedule.
Study site staff identified the pack number to be dispensed to the subject at each of
Visits 2 and 3 according to the randomisation schedule.
Analysis was performed using the intention-to-treat (ITT) population; all subjects who
were randomised, received at least one dose of study medication and had
on-treatment efficacy data. All statistical tests were two-sided at the 5% significance
level. Between group differences and 95% confidence intervals (CI) were also
calculated. The primary endpoint and the majority of secondary endpoints were
the end of treatment in the associated parameter, with the exception of the SGIC and
CGIC, which were analysed with ordinal logistic regression using the cumulative
proportional odds model. The parameter’s baseline values were included as a
covariate, and treatment was included as a factor. The tertiary variables were
analysed using ANCOVA with baseline value as covariate and treatment group and
gender as factors, or using pairwise Fisher’s Exact test, as appropriate. The null
hypothesis was one of no difference in the effects of any of the active treatments
compared individually with placebo. As this study was a phase 2a proof of concept
study, no formal sample size calculation was performed.
Changes from baseline in all the plasma markers were analysed post hoc using a
paired t-test, and the glucose response to OGTT was analysed using repeated
measures 2-way ANOVA.
Results
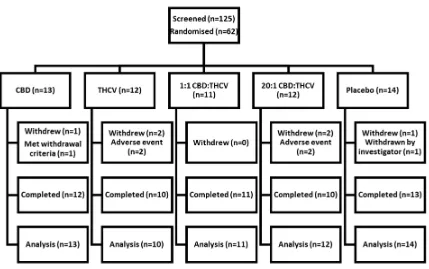
One hundred and twenty-five patients were screened and 62 randomised to the five
treatment arms. . The disposition of subjects enrolled is presented in Figure 1.
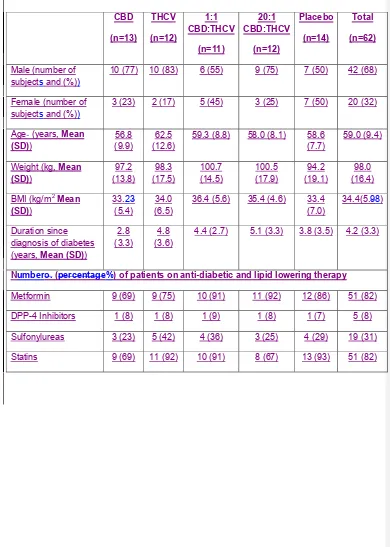
Subjects were similar between treatment groups (Table 1) in terms of baseline
characteristics.
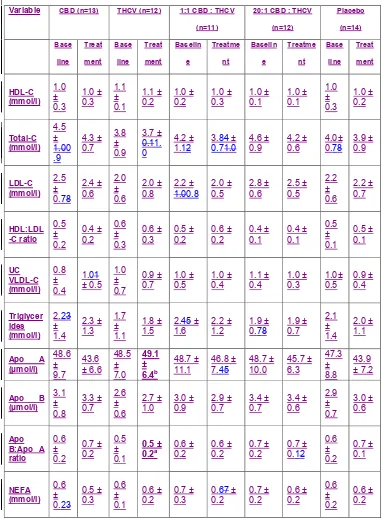
Lipids
THCV had no effect on HDL-C concentrations (Table 2), but it increased Apo A
concentrations compared with placebo from baseline to the end of treatment (from
P<0.05, Fig. 2A). THCV had no effect on LDL-C concentrations. CBD alone and in
combination with THCV, did not affect any of the lipid parameters (Table 2).
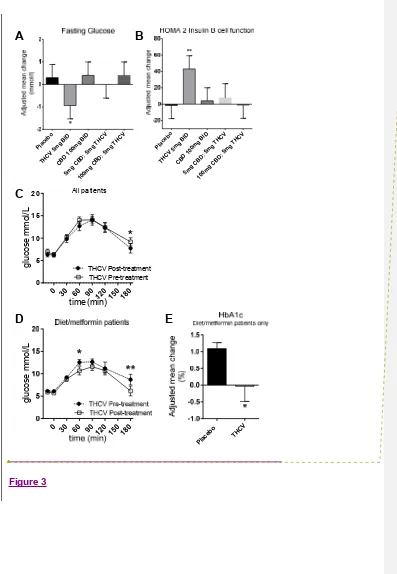
Glycaemic Control
THCV reduced fasting plasma glucose concentration compared with placebo from
baseline to the end of treatment (from 7.4 to 6.7 mmol/L in the THCV vs. 7.6 to
8.0 mmol/L in the placebo group, ETD = -1.24 ± 0.6 (SEM), P<0.05, Fig. 3A). In line
with this, there was a significant increase in HOMA2 B in the THCV treatment group
compared with placebo from baseline to the end of treatment (from 105.1 to 144.4 in
the THCV group vs. 96.4 to 94.7 in the placebo group, ETD = 44.6 ± 16.1 (SEM),
P<0.01, Table 2, Fig 3B). There was no significant difference in glucose response to
OGTT at 2 hours. However, when compared with baseline, THCV significantly
improved 3-hour blood glucose response (P<0.05, Fig 3C). CBD alone or in
combination with THCV had no effect on glycaemic parameters (Table 2).
Vascular Function
Compared to placebo, CBD and THCV, alone and in combination, had no effect on
cardiovascular parameters (Table 2), or plasma markers of vascular function
(Supplementary data Table 1).
Adipokines
There was an increase from baseline in adiponectin concentration in the THCV
group and a reduction in placebo group; the treatment difference was statistically
significant in favour of THCV treatment (ETD -5.9 x 10⁶pg/mL,P<0.01, Fig. 3B). Plasma concentrations of leptin and resistin remained unchanged with THCV
reduction in the concentration of resistin (-898 pg/mL, P<0.05, Fig. 3C), but had no
effect on leptin or adiponectin. Subjects taking a combination of CBD and THCV had
no change in adipokine levels (Supplementary data Table 1).
Markers of Inflammation
Both THCV and CBD, or their combination, had no significant effect on plasma
markers of inflammation (CRP, TNF α and IL-6; supplementary data Table 1).
Gut Hormones
THCV, on its own and in combination with CBD, had no effect on the concentrations
of gut signalling hormones including GLP-1, GIP and ghrelin (supplementary data
Table 1). However, in a post-hoc analysis, for which post-treatment concentrations
were compared with baseline (rather than placebo), CBD caused a significant
increase in the concentration of GIP (21.2 pg/mL, P<0.05, Fig. 3D), without any
effect on GLP-1 or ghrelin concentrations.
Body weight
Baseline mean body weight (kg ± SD) in the CBD, THCV, 1:1 CBD:THCV, 20:1
CBD:THCV and placebo groups were 97.1 ± 13.8, 98.3 ± 17.5, 100.7 ± 14.5, 100.5 ±
17.9 and 94.2 ± 19.1 respectively. There were no statistically significant changes in
anthropometric parameters including weight, waist circumference, waist to hip ratio
and skin fold thickness in any of the treatment groups (Table 2).
Visceral adiposity and liver triglycerides
There were no changes in visceral adiposity or liver TG (Table 2) as assessed by
Appetite
None of the treatments had any significant impact on appetite as assessed by 0-10
NRS scores (Table 2).
PGIC and CGIC
A full summary of the PGIC and CGIC assessment responses is presented in
Supplemental Figures 1 and 2. Analysis of these responses showed a treatment
difference in favour of all the active treatments, to varying degrees, but most notably
between the 1:1 CBD:THCV and placebo treatment groups on CGIC. There were
reported improvements in seven out of 11 (63.6%) patients in the CGIC on 1:1
CBD:THCV treatment, compared with only two of the 14 (14.3%) placebo patients,
with a recorded improvement on CGIG. This translated to a statistically significant
treatment effect of 1:1 CBD:THCV treatment compared with placebo, with an odds
ratio of 9.529 (P<0.05) in the CGIC. No other statistically significant effects were
calculated for any other active treatment in either assessment.
Endocannabinoids
There was no significant change in the levels of circulating AEA, 2-AG, OEA and
PEA after 13 weeks of any treatment (Table 2).
Post hoc analysis in THCV group analysing glucose response t
o OGTT and changes in HbA1c
An improvement in glucose response to OGTT was noted in the THCV group at 3 h
(see Fig 3C). When subjects on any form of diabetes treatment other than
(P<0.05 at 1 h and P<0.01 at 3 h; n=6, Fig 3D). In the same group of diet/metformin
only patients, compared with placebo, a significant improvement in HbA1c was also
observed (P<0.05, Fig 3E).
Safety
The study medication was well tolerated, with the majority of subjects experiencing
AEs that were mild or moderate in severity. Treatment-emergent (all causality) AEs
were reported by 11 of 13 (84.6%) subjects in the CBD group, 11 of 12 (91.7%) in
the THCV group, 7 of 11 (63.6%) in the 1:1 CBD:THCV group, 8 of 11 (66.7%) in the
20:1 CBD:THCV group, compared with 13 of 14 subjects (92.9%) receiving placebo.
The more common treatment-related AE reported by subjects in all the groups,
except for 20:1 CBD:THCV, was decreased appetite (two subjects (15.4%) receiving
CBD, four subjects (33.3%) receiving THCV, one subject (9.1%) receiving 1:1
CBD:THCV and two subjects (14.3%) receiving placebo). None of the subjects in
20:1 CBD:THCV group experienced an AE of decreased appetite. Two subjects
reported diarrhoea with THCV, compared to no subjects in the placebo group. Two
subjects (14.3%) on placebo also reported dizziness. All other treatment-related AEs
were reported in individual subjects.
No deaths occurred during the study. There were two SAEs in this study. One
patient (8.3%) taking 20:1 CBD:THCV treatment experienced an SAE of myocardial
infarction that was considered moderate in severity, had recovered by the end of
study, and was not considered to be treatment related. One placebo patient
experienced an SAE of myocardial ischaemia that was not considered to be
treatment-related, was mild in severity and occurred on Day 92 of the study; the SAE
Mean changes from screening to the end of treatment in BDI-II scores for the CBD,
THCV and 1:1 CBD:THCV treatment groups were 0.85, 0.58 and 0.27 points,
respectively, which were not statistically significant from placebo (change from
baseline of ˗0.08 points), and remained within the ‘minimal depression’ range for all
treatments. The largest change from baseline to the end of treatment in BDI-II score
was in the 20:1 CBD:THCV treatment group (4.91 points). While this remained in the
‘minimal depression’ bracket, it was statistically significant compared to placebo
(ETD =4.77,P<0.01).
Conclusions
The aim of this pilot study was to investigate the clinical effect and tolerability of two
phytocannabinoids, THCV and CBD, alone and in combination, in subjects with type
2 diabetes and dyslipidaemia. THCV significantly decreased fasting plasma glucose,
and increased β-cell function, adiponectin and Apo A concentrations, and was well
tolerated in patients. These findings suggest that THCV may represent a new
therapeutic agent for glycaemic control in subjects with type 2 diabetes.
The ECS plays an important role in modulating energy intake and expenditure (for
reviews, see 1, 2), and a chronically over active ECS may have a role in diabetes
and its various complications (2). A recent cross-sectional study showed that
marijuana use was associated with lower concentrations of fasting insulin, insulin
resistance and waist circumference (31). Some of the favourable metabolic effects
seen with smoking cannabis may be due to partial CB1 agonists like THC, which may act as a functional antagonist in conditions of increased endocannabinoid tone like
antagonist, was the first in its class to be used as anti-obesity drug, but led to
significant psychiatric adverse events (5). Pre-clinical studies with the plant-derived
compound THCV have shown that it produces hypophagia and weight reduction in
lean mice (18) and improves glucose tolerance and insulin sensitivity in DIO mice
(19). Similar results have been seen with CBD in ob/ob mice (GW Pharma data on
file) and CBD has been reported to lower the incidence of diabetes in non-obese
diabetic mice (33), and arrest the onset of autoimmune diabetes in non-obese
diabetic mice (34). Given the positive metabolic effects of both THCV and CBD in
preclinical studies and their potent anti-inflammatory and antioxidant properties
(22,35,36), we decided to investigate, for the first time, their efficacy and tolerability
in subjects with type 2 diabetes.
THCV Alone
THCV treatment alone had no effect on HDL-C concentration. It did, however,
produce a significant rise in serum Apo A, when compared with placebo. Apo A
makes 90% of HDL protein and constitutes an important structural component of the
HDL particle. Apo A I, which accounts for 70% of the Apo A (the remaining 20%
accounted for by Apo A II), plays an important role in reverse cholesterol transport
(37). The significance of this result remains unclear.
THCV significantly reduced fasting blood glucose concentrations, improved HOMA2
B and improved the 3-hour blood glucose response to OGTT, without any significant
difference in insulin response. These findings are in keeping with the recent animal
data, where THCV improved fasting glucose and 30 min glucose response to OGTT,
and also improved insulin sensitivity by reducing fasting and post glucose insulin
phosphorylation of Akt(also known as protein kinase B) in insulin-resistant human
hepatocytes and mice myotubes, suggesting improved insulin signalling as one of
the possible mechanisms of action.
Although there was an improvement in fasting and 3-hour post OGTT blood glucose,
there were no changes in body weight and gut hormone concentrations. In fact, a
rise in the concentration of retinol binding protein 4 (RBP-4) was observed with
THCV, an adipokine that has been associated with obesity and insulin resistance
(38). Therefore the mechanism by which THCV improves glycaemic control remains
unclear.
THCV significantly increased adiponectin concentrations. Adiponectin enhances
hepatic insulin sensitivity, increases fatty acid oxidation and has important
anti-atherogenic properties. Its concentrations are reduced in obesity and type 2 diabetes
(39).
Positive metabolic effects of THCV on glycaemic control and adiponectin
concentrations were also seen with rimonabant, the first CB1 antagonist to be licenced as anti-obesity medication that was later withdrawn from market due to
increased incidence of psychiatric adverse events (5). It is, however, important to
emphasize that while rimonabant consistently reduced body weight in all the
reported randomised clinical trials, no such change was seen with THCV, suggesting
clear differences in the mechanisms of action of these compounds. Recent animal
data with THCV similarly showed no effect on body weight (19). Moreover,
rimonabant improved the lipid profile (increased HDL-C and reduced TG levels),
while THCV had no effect on lipid parameters in our study (40). There is also a clear
difference in chemical structure between THCV and rimonabant. It is therefore
safety profiles. At micromolar concentrations, THCV inhibits the activity of both fatty
acid amide hydrolase (FAAH) and monoacyl glycerol lipase (MAGL), thereby
inhibiting the hydrolysis of AEA and 2-AG respectively (41). THCV, therefore, can act
as an indirect agonist at the cannabinoid receptors, by enhancing the activity of the
endocannabinoid system. Since such a change was not seen in our study, it is
reasonable to believe that, at the dose tested, THCV was unable to modulate the
endocannabinoid system. Recent animal data from Wargent and colleagues (19)
showed that most of the positive metabolic effects of THCV were seen with 5 and
12.5 mg/kg doses given orally in rodents. In comparison to this, the dose used on
our study (10 mg/day, approx. 0.1 mg/kg in humans) was much lower.
CBD Alone
Although CBD did not produce any effects on the primary and secondary efficacy
outcomes compared with placebo, it reduced circulating resistin concentrations from
baseline, while increasing the concentration of circulating GIP. Increased
concentrations of resistin are associated with obesity and insulin resistance (42). GIP
is one of the incretin hormones, produced by K cells in the proximal duodenum,
which is known to have insulinotropic and pancreatic β-cell preserving properties
(43). Despite having positive effects on resistin and GIP, CBD did not produce any
improvement in glycaemic control.
CBD is known for its indirect agonism at the CB1 receptors, by either increasing CB1 constitutional activity or the endocannabinoid tone. CBD has been reported to inhibit
hydrolysis of AEA by FAAH (but only at high micromolar levels) and also increases
2-AG levels (39). In a recent clinical study, in subjects with schizophrenia, 800 mg
associated with an improvement in clinical profile of these subjects (12). In our study,
CBD (albeit at a much lower dose), alone or in combination with THCV, had no effect
on the plasma levels of endocannabinoids, suggesting that it had minimal interaction
with the endocannabinoid system at the doses investigated.
Studies in rodents have used intraperitoneal CBD in a dose ranging from
1 mg/kg/day to 20 mg/kg/day, with positive effects on the metabolism seen only with
higher dose ranges (7, 8, 9). In a 70 kg individual, a 20 mg/kg/day dose equates to
1400 mg/day. Similarly, human studies have used CBD in higher doses (12, 44). The
dose used in our study was 200 mg/day, which could possibly explain lack of
therapeutic effects seen with CBD.
Combination of CBD and THCV
Except for an improvement in CGIC assessments with 1:1 CBD:THCV treatment,
none of the efficacy parameters were affected by 1:1 or 20:1 combination of CBD
and THCV. There was a trend towards an improvement in most lipid parameters and
the overall incidence of all-causality treatment related AEs was lowest in the 1:1
CBD:THCV treatment group; these factors could have led to an impression of
improvement in subjects’ overall condition with this treatment. While the combination
of CBD and THCV did not produce any favourable effects on any of the parameters,
the favourable effects of THCV were also lost in the combination treatment. Similarly,
the positive effects of CBD on GIP and resistin were not seen in any of the
combination treatments. This suggests that CBD and THCV in combination may
counteract their individual therapeutic effects at least in the ratios and doses tested
in this study. This may be at the level of receptors or due to interference with each
Safety
Both CBD and THCV were well tolerated, with the majority of patients experiencing
AEs that were mild in severity. The most common AE was reduced appetite with
similar incidence across all the treatment groups. There were no reports of
depression and no clinically significant abnormalities on ECG and laboratory results
including blood count, liver and renal biochemistry in any treatment groups. There
was one SAE of myocardial ischaemia in the placebo group, and one SAE of
myocardial infarction in the 20:1 CBD:THCV group; both were considered unrelated
to study medication. With regards to the BDI-II scale, though the change in 20:1
CBD:THCV treatment group was statistically significant, all mean active treatments
and placebo scores remained in the ‘minimal depression’ range.
Conclusion
In this clinical study, the first to study the effects of CBD and THCV in subjects with
type 2 diabetes and dyslipidaemia, THCV improved glycaemic control, and therefore
warrants further investigation in this therapeutic area. CBD failed to show any
detectable metabolic effects despite producing desirable changes in some
adipokines and gut hormone concentrations. The incidence of AEs was similar
between treatment groups, and both CBD and THCV were well tolerated. No new
safety concerns were identified in the study.
Conflicts of interest and source of funding
SHR has been a member of GW’s Speaker’s Board and has received funding for
clinical studies. GT is supported by the National Institute for Health Research (NIHR)
GT and not necessarily those of the NHS, the NIHR or the Department of Health.
The study was investigator led and initiated, and was supported by GW Research
Ltd.
Acknowledgements
Dr Stephen Wright of GW Pharmaceuticals is the guarantor of this work and, as
such, had full access to all the data in the study and takes responsibility for the
integrity of the data and the accuracy of the data analysis.
Author Contributions:
K.J. involved in study design, researched data, wrote manuscript, reviewed/edited
manuscript. S.R. recruited patients, reviewed/edited manuscript. D.B. researched
data, reviewed/edited manuscript. E.T. researched data. C.S. involved in study
design, reviewed/edited manuscript. J.B. researched data, reviewed/edited
manuscript. S.O’S involved in study design, wrote manuscript, reviewed/edited
manuscript. G.T. involved in study design, chief investigator, wrote manuscript,
reviewed/edited manuscript.
We would like to thank Lesley Taylor and Heather Lauder of GW Pharmaceuticals
Figure legends
Figure 1. Summary of breakdown of patients enrolled in the study. 125 subjects
were screened and 62 randomised to this study.
Figure 2. Compared with placebo, THCV alone caused a significant improvement in
the concentration of Apo A (P<0.05; A) and adiponectin (P<0.01; B). Data was
analysed by analysis of covariance and presented as mean ± SEM. CBD caused a
significant reduction in resistin (P<0.05; C) and an increase in GIP concentration
(P<0.05; D), when compared with pre-treatment values. Data were analysed post
hoc using paired t-test and presented as mean ± SEM.
Figure 3. Compared with placebo, THCV alone caused significant improvement in
fasting glucose (P<0.05; A) and in keeping with this, there was a highly significant
improvement in β cell function measured by HOMA2 (P<0.01; B). THCV caused
significant improvement in 3 hour glucose response during OGTT (P<0.05; C), when
compared with pre-treatment values.
Data were analysed using 2-way ANOVA and presented as mean ± SEM. (D)
Compared with pre-treatment values, there was a highly significant improvement in 3
hour glucose response to OGTT with THCV, when subjects on any oral
hypoglycaemic therapy other than diet and/or metformin were excluded from
analysis (P<0.01, n=6). In the same subgroup (analysed post hoc), compared with
placebo, there was a statistically significant improvement in HbA1c (P<0.05, E). Data
were analysed post hoc using repeated measures 2 way ANOVA and paired t-test
References
1. Silvestri C, Ligresti A, Di Marzo V. Peripheral effects of the endocannabinoid
system in energy homeostasis: adipose tissue, liver and skeletal muscle. Rev
Endocr Metab Disord 2011;12:153-162.
2. Horvath B, Mukhopadhyay P, Hasko G, Pacher P. The endocannabinoid
system and plant-derived cannabinoids in diabetes and diabetic
complications. Am J Pathol 2012;180:432-442.
3. Di Marzo V. The endocannabinoid system in obesity and type 2 diabetes.
Diabetologia 2008;51:1356-1367.
4. Christopoulou FD, Kiortsis DN. An overview of the metabolic effects of
rimonabant in randomized controlled trials: potential for other cannabinoid 1
receptor blockers in obesity. J Clin Pharm Ther 2011;36:10-18.
5. Le Foll B, Gorelick DA, Goldberg SR. The future of endocannabinoid-oriented
clinical research after CB1 antagonists. Psychopharmacology (Berl)
2009;205:171-174.
6. Rajesh M, Mukhopadhyay P, Batkai S, Hasko G, Liaudet L, Drel VR,
Obrosova IG, Pacher P. Cannabidiol attenuates high glucose-induced
endothelial cell inflammatory response and barrier disruption. Am J Physiol
Heart Circ Physiol 2007;293:H610-H619.
7. El-Remessy AB, Al-Shabrawey M, Khalifa Y, Tsai NT, Caldwell RB, Liou GI.
Neuroprotective and blood-retinal barrier-preserving effects of cannabidiol in
experimental diabetes. Am J Pathol 2006;168:235-244.
8. Toth CC, Jedrzejewski NM, Ellis CL, Frey WH. Cannabinoid-mediated
modulation of neuropathic pain and microglial accumulation in a model of
9. Rajesh M, Mukhopadhyay P, Batkai S, Patel V, Saito K, Matsumoto S,
Kashiwaya Y, Horvath B, Mukhopadhyay B, Becker L, Hasko G, Liaudet L,
Wink DA, Veves A, Mechoulam R, Pacher P. Cannabidiol attenuates cardiac
dysfunction, oxidative stress, fibrosis, and inflammatory and cell death
signaling pathways in diabetic cardiomyopathy. J Am Coll Cardiol
2010;56:2115-2125.
10. Stanley CP, Wheal AJ, Randall MD, O'Sullivan SE. Cannabinoids alter
endothelial function in the Zucker rat model of type 2 diabetes. Eur J
Pharmacol 2013;720:376-382.
11. Resstel LB, Tavares RF, Lisboa SF, Joca SR, Correa FM, Guimaraes FS.
5-HT1A receptors are involved in the cannabidiol-induced attenuation of
behavioural and cardiovascular responses to acute restraint stress in rats. Br
J Pharmacol. 2009;156:181-8.
12. Leweke FM, Piomelli D, Pahlisch F, Muhl D, Gerth CW, Hoyer C,
Klosterkotter J, Hellmich M, Koethe D. Cannabidiol enhances anandamide
signaling and alleviates psychotic symptoms of schizophrenia. Transl
Psychiatry. 2012;2:e94
13. Schubart CD, Sommer IE, van Gastel WA, Goetgebuer RL, Kahn RS, Boks
MP. Cannabis with high cannabidiol content is associated with fewer
psychotic experiences. Schizophr Res 2011;130:216-221.
14. Pertwee RG. The diverse CB1 and CB2 receptor pharmacology of three plant
cannabinoids: tetrahydrocannabinol, cannabidiol and
15. O'Sullivan SE, Sun Y, Bennett AJ, Randall MD, Kendall DA. Time-dependent
vascular actions of cannabidiol in the rat aorta. Eur J Pharmacol
2009;612:61-8.
16. Esposito G, Scuderi C, Valenza M, Togna GI, Latina V, De Filippis D,
Cipriano M, Carratu MR, Iuvone T, Steardo L. Cannabidiol reduces
Aβ-induced neuroinflammation and promotes hippocampal neurogenesis through
PPARγ involvement. PLoS One 2011;6:e28668.
17. De Filippis D, Esposito G, Cirillo C, Cipriano M, De Winter BY, Scuderi C,
Sarnelli G, Cuomo R, Steardo L, De Man JG, Iuvone T. Cannabidiol reduces
intestinal inflammation through the control of neuroimmune axis. PLoS One
2011;6:e28159.
18. Riedel G, Fadda P, McKillop-Smith S, Pertwee RG, Platt B, Robinson L.
Synthetic and plant-derived cannabinoid receptor antagonists show
hypophagic properties in fasted and non-fasted mice. Br J Pharmacol
2009;156:1154-1166.
19. Wargent ET, Zaibi MS, Silvestri C, Hislop DC, Stocker CG, Stott CG, Guy
GW, Duncan M, Di Marzo V, Cawthorne MA. The cannabinoid
Delta(9)-tetrahydrocannabivarin (THCV) ameliorates insulin sensitivity in two mouse
models of obesity. Nutr Diabetes 2013;3:e68
20. Thomas A, Stevenson LA, Wease KN, Price MR, Baillie G, Ross RA,
Pertwee RG. Evidence that the plant cannabinoid delta
9-tetrahydrocannabivarin is a cannabinoid CB1 and CB2 receptor antagonist.
Br J Pharmacol 2005;146:917-926.
21. Pertwee RG, Thomas A, Stevenson LA, Ross RA, Varvel SA, Litchman AH,
tetrahydrocannabinol, is antagonized by delta 8- and delta
9-tetrahydrocannabivarin in mice in vivo. Br J Pharmacol 2007;150:586-594.
22. Bolognini D, Costa B, Maione S, Comelli F, Marini P, Di Marzo V, Parolaro D,
Ross RA, Gauson LA, Cascio MG, Pertwee RG. The plant cannabinoid Delta
9-tetrahydrocannabivarin can decrease signs of inflammation and
inflammatory pain in mice. Br J Pharmacol 2010;160:677-687.
23. Hill AJ, Weston SE, Jones NA, Smith I, Bevan SA, Williamson EM, Stephens
GJ, Williams CM, Whalley BJ. Delta 9-tetrahydrocannabivarin suppresses in
vitro epileptiform and in vivo seizure activity in adult rats. Epilepsia
2010;51:1522-1532.
24. Batkai S, Mukhopadhyay P, Horvath B, Rajesh M, Gao RY, Mahadevan A,
Amere M, Battista N, Litchman AH, Gauson LA, Maccarrone M, Pertwee RG,
Pacher P. Delta 8-tetrahydrocannabivarin prevents hepatic
ischaemia/reperfusion injury by decreasing oxidative stress and inflammatory
responses through cannabinoid CB2 receptors. Br J Pharmacol
2012;165:2450-2461.
25. Anavi-Goffer S, Baillie G, Irving AJ, Gertsch J, Greig IR, Pertwee RG, Ross
RA. Modulation of L-alpha-lysophosphatidylinositol/GPR55 mitogen-activated
protein kinase (MAPK) signaling by cannabinoids. J biol chem
2012;287:91-104.
26. De Petrocellis L, Ligresti A, Moriello AS, Allara M, Bisogno T, Petrosino S,
Stott CG, Di Marzo V. Effects of cannabinoids and cannabinoid-enriched
Cannabis extracts on TRP channels and endocannabinoid metabolic
27. De Petrocellis L, Orlando P, Moriello AS, Aviello G, Stott C, Izzo AA, Di
Marzo V. Cannabinoid actions at TRPV channels: effects on TRPV3 and
TRPV4 and their potential relevance to gastrointestinal inflammation. Acta
Physiol (Oxf) 2012;204:255-266.
28. Richardson D, Ortori CA, Chapman C, Kendall DA, Barrett DA. Quantitative
profiling of endocannabinoids and related compounds in rat brain using liquid
chromatography-tandem electroscopy ionisation mass spectrometry. Anal
Biochem 2007;360:216-226
29. Flint A, Raben A, Blundell JE, Astrup A. Reproducibility, power and validity of
visual analogue scales in assessment of appetite sensations in single test
meat studies. Int J Obes Relat Metab Disord. 2000;24:38-48
30. Endler NS, Rutherford A, Denisoff E. Beck depression inventory: exploring its
dimensionality in a nonclinical population. J Clin Psychol.
1999;55:1307-1312.
31. Penner EA, Buettner H, Mittleman MA. The impact of marijuana use on
glucose, insulin, and insulin resistance among us adults. Am J Med
2013;126:583-589
32. Le Foll B, Trigo JM, Sharkey KA, Le Strat Y. Cannabis and
delta9-tetrahydrocannabinol (THC) for weight loss? Med Hypotheses
2013;80:564-567.
33. Weiss L, Zeira M, Reich S, Har-Noy M, Mechoulam R, Slavin S, Gallily R.
Cannabidiol lowers incidence of diabetes in non-obese diabetic mice.
34. Weiss L, Zeira M, Reich S, Slavin S, Raz I, Mechoulam R, Gallily R.
Cannabidiol arrests onset of autoimmune diabetes in NOD mice.
Neuropharmacology 2008;54:244-249
35. Costa B, Colleoni M, Conti S, Parolaro D, Franke C, Trovato AE, Giagnoni G.
Oral anti-inflammatory activity of cannabidiol, a non-psychoactive constituent
of cannabis, in acute carrageenan-induced inflammation in the rat paw.
Naunyn Schmiedebergs Arch Pharmacol 2004;369:294-299.
36. Lastres-Becker I, Molina-Holgado F, Ramos JA, Mechoulam R,
Fernandez-Ruiz J.Cannabinoids provide neuroprotection against 6-hydroxydopamine
toxicity in vivo and in vitro: relevance to Parkinson's disease. Neurobiol
Dis 2005;19:96-107
37. Barter PJ. Hugh sinclair lecture: the regulation and remodelling of HDL by
plasma factors. Atheroscler Suppl. 2002;3:39-47.
38. Christou GA, Tselepis AD, Kiortsis DN. The metabolic role of retinol binding
protein 4: an update. Horm Metab Res 2012;44:6-14.
39. Whitehead JP, Richards AA, Hickman IJ, Macdonald GA, Prins JB.
Adiponectin--a key adipokine in the metabolic syndrome. Diabetes Obes
Metab. 2006;8:264-280.
40. Christopoulou FD, Kiortsis DN. An overview of the metabolic effects of
rimonabant in randomized controlled trials: potential for other cannabinoid 1
receptor blockers in obesity. J Clin Pharm Ther 2011;36:10-18.
41. McPartland JM, Duncan M, Di Marzo V, Pertwee RG. Are cannabidiol and
∆(9)- tetrahydrocannabivarin negative modulators of the endocannabinoid
42. Steppan CM, Bailey ST, Bhat S, Brown EJ, Banerjee RR, Wright CM, Patel
HR, Ahima RS, Lazar MA. The hormone resistin links obesity to diabetes.
Nature 2001;409:307-312.
43. Irwin N, Flatt PR. Evidence for beneficial effects of compromised gastric
inhibitory polypeptide action in obesity-related diabetes and possible
therapeutic implications. Diabetologia. 2009;52:1724-1731
44. Bergamaschi MM, Queiroz RH, Chagas MH, de Oliveira DC, De Martinis BS,
Kapczinski F, Quevedo J, Roesler R, Schroder N, Nardi AE, Martin-Santos R,
Hallak JE, Zuardi AW, Crippa JA. Cannabidiol reduces the anxiety induced
by simulated public speaking in treatment-naïve social phobia patients.
Participating Centres
1. Division of Medical Sciences & Graduate Entry Medicine, School of Medicine,
University of Nottingham, Royal Derby Hospital Centre, Uttoxeter Road,
Derby DE22 3DT
2. MAC Clinical Research. Manchester M32 0UT
3. Woolpit Health Centre, Heath Road, Woolpit, Bury St Edmunds, Suffolk, IP30
9QU
Table 1. Summary of patient demographics and concomitant therapy.
CBD (n=13)
THCV (n=12)
1:1 CBD:THCV
(n=11)
20:1 CBD:THCV
(n=12)
Placebo (n=14)
Total (n=62)
Male (number of subjects and (%))
10 (77) 10 (83) 6 (55) 9 (75) 7 (50) 42 (68)
Female (number of subjects and (%))
3 (23) 2 (17) 5 (45) 3 (25) 7 (50) 20 (32)
Age (years, Mean (SD))
56.8 (9.9)
62.5 (12.6)
59.3 (8.8) 58.0 (8.1) 58.6 (7.7)
59.0 (9.4)
Weight (kg, Mean (SD))
97.2 (13.8)
98.3 (17.5)
100.7 (14.5)
100.5 (17.9)
94.2 (19.1)
98.0 (16.4)
BMI (kg/m2 Mean (SD))
33.2 (5.4)
34.0 (6.5)
36.4 (5.6) 35.4 (4.6) 33.4 (7.0)
34.4(5.8)
Duration since diagnosis of diabetes (years, Mean (SD))
2.8 (3.3)
4.8 (3.6)
4.4 (2.7) 5.1 (3.3) 3.8 (3.5) 4.2 (3.3)
Number (%) of patients on anti-diabetic and lipid lowering therapy
Metformin 9 (69) 9 (75) 10 (91) 11 (92) 12 (86) 51 (82)
DPP-4 Inhibitors 1 (8) 1 (8) 1 (9) 1 (8) 1 (7) 5 (8)
Sulfonylureas 3 (23) 5 (42) 4 (36) 3 (25) 4 (29) 19 (31)
Table 2. Clinical data before (baseline) and after (treatment) 13 weeks of
randomised treatment
Variable CBD (n=13) THCV (n=12) 1:1 CBD : THCV (n=11)
20:1 CBD : THCV (n=12) Placebo (n=14) Baseli ne Treatm ent Baseli ne Treatm ent Baseli ne Treatm ent Baseli ne Treatm ent Baseli ne Treatm ent HDL-C (mmol/l) 1.0 ± 0.3 1.0 ± 0.3 1.1 ± 0.1 1.1 ± 0.2 1.0 ± 0.2 1.0 ± 0.3 1.0 ± 0.1 1.0 ± 0.1 1.0 ± 0.3 1.0 ± 0.2 Total-C (mmol/l) 4.5 ± 0.9 4.3 ± 0.7 3.8 ± 0.9 3.7 ± 1.0 4.2 ± 1.1 3.8 ± 0.7 4.6 ± 0.9 4.2 ± 0.6 4.0± 0.7 3.9 ± 0.9 LDL-C (mmol/l) 2.5 ± 0.7 2.4 ± 0.6 2.0 ± 0.6 2.0 ± 0.8 2.2 ± 0.8 2.0 ± 0.5 2.8 ± 0.6 2.5 ± 0.5 2.2 ± 0.6 2.2 ± 0.7 HDL:LDL-C ratio 0.5 ± 0.2 0.4 ± 0.2 0.6 ± 0.3 0.6 ± 0.3 0.5 ± 0.2 0.6 ± 0.2 0.4 ± 0.1 0.4 ± 0.1 0.5 ± 0.1 0.5 ± 0.1
UC VLDL-C (mmol/l) 0.8 ± 0.4 1.0 ± 0.5 1.0 ± 0.7 0.9 ± 0.7 1.0 ± 0.5 1.0 ± 0.4 1.1 ± 0.4 1.0 ± 0.3 1.0± 0.5 0.9 ± 0.4 Triglyceri des (mmol/l) 2.2 ± 1.4 2.3 ± 1.3 1.7 ± 1.1 1.8 ± 1.5 2.4 ± 1.6 2.2 ± 1.2 1.9 ± 0.7 1.9 ± 0.7 2.1 ± 1.4 2.0 ± 1.1
Apo A (µmol/l) 48.6 ± 9.7 43.6 ± 6.6 48.5 ± 7.0 49.1 ± 6.4b 48.7 ± 11.1 46.8 ± 7.4 48.7 ± 10.0 45.7 ± 6.3 47.3 ± 8.8 43.9 ± 7.2
Liver TG (%) 26.9 ± 16.9 22.2 ± 17.1 11.9 ± 8.0 11.5 ± 13.5 33.3 ± 18.3 32.2 ± 26.2 23.2 ± 14.3 25.4 ± 17.4 20.5 ± 15.1 18.5 ± 15.4 Fasting glucose (mmol/l) 8.0 ± 2.3 8.4 ± 2.8 7.4 ± 2.3 6.7 ± 1.9b 8.5 ± 2.5 8.7 ± 2.0 8.4 ± 2.8 8.8 ± 3.1 7.6 ± 1.4 8.0 ± 1.6 Fructosa mine (µmol/l) 259. 5 ± 34.4 256.8 ± 44.6 238. 2 ± 25.0 239.3 ± 28.7 254. 4 ± 35.7 256.0 ± 55.2 253. 3 ± 34.8 268.8 ± 58.2 241. 4 ± 19.3 253.7 ± 32.0 HbA1c (%) 6.9 ± 0.9 7.0 ± 1.1 6.6 ± 0.6 6.5 ± 0.7 7.2 ± 1.1 7.4 ± 1.5 7.2 ± 0.9 7.3 ± 1.3 7.0 ± 0.7 7.3 ± 1.0
Glucose - 2 h OGTT (mmol/l) 7.4 ± 2.4 6.6 ± 2.7 5.7 ± 3.1 6.2 ± 2.7 8.7 ± 3.8 8.8 ± 2.5 5.6 ± 3.4 6.6 ± 2.3 7.9 ± 2.6 8.4 ± 2.2
Insulin - 2 h OGTT (pmol/l) 604. 1 ± 605. 2 454.8 ± 387.5 661. 0 ± 381. 2 724.9 ± 589.6 789. 5 ± 677. 2 900.2 ± 875.8 659. 3 ± 570. 4 651.6 ± 730.0 653. 6 ± 381. 5 619.7 ± 455.3 Fasting insulin (pmol/l) 110. 3 ± 42.8 123.8 ± 60.8 152. 9 ± 94.2 203.5 ± 197.7 175. 3 ± 86.1 185.7 ± 67.6 197. 6 ± 107. 9 192.2 ± 69.1 171. 7 ± 105. 0 179.7 ± 75.7 C-peptide (nmol/l) 0.9 ± 0.2 0.9 ± 0.2 1.0 ± 0.3 1.1 ± 0.5 1.2 ± 0.2 1.2 ± 0.3 1.1 ± 0.3 1.2 ± 0.3 1.0 ± 0.4 1.1 ± 0.4
HOMA2-IR 2.3 ± 0.9 2.6 ± 1.5 3.0 ± 1.9 3.8 ± 3.3 3.5 ± 1.6 3.7 ± 1.3 4.2 ± 2.9 4.0 ± 1.5 3.4 ± 2.1 3.6 ± 1.5 HOMA2 insulin sensitivity 51.3 ± 20.1 53.0 ± 36.2 47.3 ± 32.4 53.5 ± 44.3 34.9 ± 17.1 30.4 ± 12.9 30.2 ± 11.4 28.9 ± 11.5 42.4 ± 29.2 37.8 ± 32.2
HOMA2 B cell function 70.9 ± 27.2 69.6 ± 31.5 105. 1 ± 64.7 144.4 ± 110.3c 95.7 ± 50.7 93.8 ± 47.5 103. 7 ± 60.6 97.9 ± 50.5 96.4 ± 41.4 94.7 ± 39.2 BMI (kg/m2)
Neck circumfer ence (cm) 42.4 ± 3.3 42.1 ± 3.7 42.8 ± 3.8 42.8 ± 3.6 42.7 ± 3.3 42.2 ± 3.8 42.8 ± 3.6 42.5 ± 4.0 41.7 ± 4.8 41.1 ± 4.8 Visceral abdomina l fat (l)
8.1 ± 1.9 8.5 ± 2.2 9.1 ± 3.5 9.0 ± 3.5 8.5 ± 3.0 8.6 ± 2.7 9.1 ± 2.5 10.2 ± 2.2 7.2 ± 2.4 7.5 ± 3.4 Appetite 0-10 NRS score 5.6 ± 1.0 4.9 ± 1.0 5.4 ± 1.7 5.0 ± 1.5 4.7 ± 1.2 3.6 ± 1.6 5.0 ±
2.2 4.1 ± 1.9 5.1 ± 1.3 4.5 ± 1.3
Systolic BP (mmHg) 133. 4 ± 16.4 132.2 ± 13.0 135. 9 ± 13.4 132.8 ± 17.1 126. 4 ± 11.6 134.3 ± 12.8 132. 7 ± 11.0 134.2 ± 14.8 137. 2 ± 11.9 140.4 ± 11.2 Diastolic BP (mmHg) 70.1 ± 8.8 70.6 ± 8.8 70.6 ± 12.2 71.0 ± 9.4 73.2 ± 6.8 77.5 ± 7.7 73.5 ± 10.4 72.2 ± 10.5 73.0 ± 9.5 72.3 ± 10.6
Pulse rate (bpm) 71.5 ± 17.7 70.5 ± 15.7 74.5 ± 12.3 74.1 ± 12.4 80.1 ± 12.2 76.6 ± 8.0 77.1 ± 12.1 82.0 ± 15.8 72.1 ± 10.8 75.5 ± 7.3 BDI-II score 3.8 ± 3.5 4.6 ± 3.7 2.8 ± 3.8 3.3 ± 3.3 4.5 ± 5.2 4.7 ± 5.0 2.8 ± 2.7 7.9 ± 7.6 3.5 ± 3.9 3.5 ± 3.2
AEA 0.2 ±
0.1 0.2 ± 0.05 0.2 ± 0.1 0.2 ± 0.1 0.2 ± 0.1 0.2 ± 0.1 0.2 ± 0.04 0.2 ± 0.1 0.2 ± 0.1 0.2 ± 0.1
2-AG 5.0 ±
2.9 4.7 ± 2.9 4.3 ± 1.7 13.6 ± 28.6 6.2 ± 3.1 5.0 ± 1.5 3.8 ± 1.5 3.7 ± 1.7 5.0 ± 3.3 5.3 ± 3.4
OEA 2.4 ±
1.1 1.8 ± 0.7 2.4 ± 1.0 2.3 ± 0.6 2.5 ± 0.8 2.2 ± 0.7 2.2 ± 0.5 2.2 ± 0.8 2.4 ± 0.5 2.1 ± 0.5
PEA 2.7 ±
1.9 1.8 ± 0.7 2.7 ± 1.1 2.5 ± 0.7 2.5 ± 0.7 2.4 ± 0.6 2.5 ± 1.2 2.6 ± 1.7 2.9 ± 1.3 2.0 ± 0.4
Data are mean ± SD; aP<0.05, bP<0.01 compared with placebo; Abbreviations: AEA, N-arachidonoylethanolamine; Apo, Apolipoprotein; BDI-II, Beck Depression
Inventory-II; BMI, Body mass index; BP, blood pressure; HbA1c, glycosylated
haemoglobin A1c; HDL, high density lipoprotein; HOMA2-IR, homeostatic
assessment model 2 - insulin resistance; LDL-C, low density lipoprotein cholesterol;
NEFA, non-esterified fatty acid; OEA, oleoylethanolamine; OGTT, oral glucose
tolerance test; PEA, palmitoylethanolamine; TG; triglyceride, UC, ultracentrifugation;
Figure 2 Pla
cebo
THC V 5
mg BID
CB D 1
00m g B
ID
5m g C
BD : 5m
g TH CV
100m g C
BD : 5m
g TH CV
Pla cebo
THC V 5m
g B ID
CBD 100
mg BID
5mg CB
D: 5 mg
THC V
100m g C
BD : 5m
g TH CV
-5.0 106
0 5.0 106
1.0 107
Adiponectin A d ju s te d m e a n c h a n g e (p g /m l) ** CB D p
re CBD
pos t 0 50 100 150 200 GIP * CB D p
re CBD
Figure 3 Pla
cebo
THC V 5
mg BID
CB D 1
00m g B
ID
5m g C
BD : 5m
g TH CV
100m g C
BD : 5m
g TH CV
Pla cebo
THC V 5
mg BID
CB D 1
00m g B
ID
5m g C
BD : 5m
g TH CV
100m g C
BD : 5m
g TH CV
A
B
0 30 60 90 120 150 180 0 5 10 15 20 time (min) g lu c o s e m m o l/ L
*
THCV Pre-treatment THCV Post-treatment All patientsC
D
0 30 60 90 120 150 180
Variable CBD THCV 1:1 CBD:THCV 20:1 CBD:THCV Placebo
Baseline Treatment Baseline Treatment Baseline Treatment Baseline Treatment Baseline Treatment
CRP (ng/mL) 7073 ± 8345 7301 ± 7578 13915 ± 22142
6026 ± 5488 12369 ± 10425
18958 ± 19162
21166 ± 43390
8224 ± 6330 6369 ± 6217 10512 ± 10718
TNFα (pg/mL) 7.0 ± 1.6 7.0 ± 1.9 7.3 ± 1.4 7.1 ± 2.2 6.8 ± 2.5 7.2 ± 2.3 6.6 ± 2.4 6.9 ± 2.5 7.2 ± 2.6 7.0 ± 2.5
IL-6 (pg/mL) 3.9 ± 6.8 6.2 ± 8.0 12.5 ± 13.2 9.2 ± 9.5 4.3 ± 4.1 4.4 ± 4.8 6.9 ± 13.5 12.0 ± 20.5 4.0 ± 4.4 7.2 ± 11.8
GLP-1 (pg/mL) 16.7 ± 34.5 20.2 ± 25.3 22.1 ± 30.6 35.7 ± 51.9 18.5 ± 26.1 20.4 ± 25.9 20.2 ± 30.4 32.5 ± 33.7 24.0 ± 29.0 27.6 ± 33.0
GIP (pg/mL) 32.4 ± 15.0 54.0 ± 35.0 40.5 ± 18.6 36.1 ± 21.8 53.6 ± 27.6 49.5 ± 21.2 45.8 ± 27.2 53.3 ± 29.9 48.8 ± 21.4 45.7 ± 27.2
Ghrelin (pg/mL)
15.0 ± 22.5 15.4 ± 17.1 18.1 ± 17.0 14.7 ± 18.3 9.8 ± 15.8 8.0 ± 11.3 4.7 ± 10.6 7.0 ± 14.0 15.7 ± 21.3 12.9 ± 7.9
Leptin (pg/mL) 12010.6 ± 9319.0 13002.3 ± 10492.0 16075.9 ± 8760.4 16563.9 ± 14015.3 22477.5 ± 10035.1 22844.6 ± 12955.1 16608.9 ± 6863.7 17119.7 ± 7919.1 17095.4 ± 9477.2 21216.2 ± 16743.1 Adiponectin (pg/mL) 18682707.9 ± 14433872.3 17256334.9 ± 9657725.5 20057340.7 ± 8556371.9 23065791.7 ± 11645915.9 17726284.0 ± 11350339.9 15171832.9 ± 8668602.0 14291816.0 ± 4955302.0 16090325.8 ± 5955671.9 18579597 ± 10527661.9 15959291.4 ± 9591038.9 Resistin (pg/mL) 12466.8 ± 4380.0 11568.9 ± 4444.7 13635.9 ± 5074.5 13444.2 ± 4279.7 17249.7 ± 7303.0 16857.6 ± 4139.0 13202.9 ± 6962.1 11715.0 ± 3480.2 14801.8 ± 6873.7 14761.6 ± 6082.8 RBP-4 (ng/mL)
8874 ± 1186 9158 ± 1317 8692 ± 2186 9355 ± 1949 8653 ± 1311 8939 ± 1676 9177 ± 1732 8742 ± 1282 9436 ± 2108 8738 ± 1328
Orexin (ng/mL)
0.6 ± 0.3 0.7 ± 0.6 1.0 ± 0.6 1.0 ± 0.6 1.0 ± 0.5 0.8 ± 0.4 0.6 ± 0.5 0.8 ± 1.2 0.8 ± 0.4 0.8 ± 0.5
Ketones (mM) 0.1 ± 0.1 0.1 ± 0.1 0.1 ± 0.1 0.1 ± 0.1 0.2 ± 0.1 0.1 ± 0.0 0.1 ± 0.1 0.1 ± 0.0 0.1 ± 0.1 0.1 ± 0.1
0 2 4 6 8 10 12 14
Very Much Improved
Much Improved
Minimally Improved
No change Minimally Worse
Much Worse Very Much Worse
N
o
o
f
S
u
b
je
ct
s
SGIC
CBD 100mg BID THCV 5 mg BID 1:1 CBD:THCV 20:1 CBD:THCV Placebo
0 2 4 6 8 10 12 14
Very Much Improved
Much Improved
Minimally Improved
No change Minimally Worse
Much Worse Very Much Worse
N
o
o
f
S
u
b
je
ct
s
CGIC
CBD 100mg BID THCV 5 mg BID 1:1 CBD:THCV 20:1 CBD:THCV Placebo
1
Efficacy and safety of Cannabidiol and Tetrahydrocannabivarin on glycaemic and lipid parameters in patients with Type 2 diabetes: a randomised,
double-blind, placebo-controlled, parallel group pilot study
KA Jadoon1, SH Ratcliffe2, DA Barrett3, EL Thomas4, C Stott6, JD Bell4,
SE O’Sullivan1* and GD Tan5*
1
Division of Medical Sciences & Graduate Entry Medicine, School of Medicine, University of Nottingham, Royal Derby Hospital Centre, Uttoxeter Road, Derby DE22 3DT, 01332724701.
2
CogMaze Ltd, London SW5 9SX
3
Centre for Analytical Bioscience, School of Pharmacy, University of Nottingham, Nottingham NG7 2RD
4
Research Centre for Optimal Health, Department of Life Sciences, University of Westminster, London, W1W 6UW.
5
The NIHR Oxford Biomedical Research Centre, Oxford Centre for Diabetes, Endocrinology & Metabolism, Churchill Hospital, Oxford University Hospitals NHS Trust, Oxford OX3 7LE
6
GW Pharmaceuticals, Sovereign House, Vision Park, Histon, Cambridge CB24 9BZ
*These authors contributed equally to this paper
Corresponding author:saoirse.osullivan@nottingham.ac.uk
Trial Registration (ClinicalTrials.gov): NCT01217112
Keywords: Cannabinoid, cannabidiol, delta-9-tetrahydrocannabivarin, type 2 diabetes, dyslipidaemia, phytocannabinoid, adipokine, oral glucose tolerance
2
Abstract
Objective Cannabidiol (CBD) and delta-9-tetrahydrocannabivarin (THCV) are non-psychoactive phytocannabinoids that affect lipid and glucose metabolism in animal
models of metabolic function. This study set out to examine the effects of these
compounds in patients with type 2 diabetes.
Research Design and Methods In thisrandomised, double-blind, placebo-controlled study, 62 subjects with non-insulin treated type 2 diabetes were enrolled and 39 were
randomised to five treatment arms. These were CBD (100 mg twice daily), THCV (5
mg twice daily), 1:1 ratio of CBD and THCV (5 mg:5 mg, twice daily), 20:1 ratio of
CBD and THCV (100 mg:5 mg, twice daily), or matched placebo, for 13 weeks. The
remaining subjects were randomised to two other treatment arms not presented here.
The primary endpoint was a change in HDL-cholesterol concentrations from baseline.
Secondary/tertiary endpoints included changes in glycaemic control, lipid profile,
insulin sensitivity, body weight, liver triglyceride content, adipose tissue distribution,
appetite, markers of inflammation, markers of vascular function, gut hormones,
circulating endocannabinoids and adipokine concentrations. Safety and tolerability
endpoints were also evaluated.
Results Compared with placebo, THCV significantly decreased fasting plasma glucose (estimated treatment difference (ETD)=-1.2mmol/L, P<0.05) and improved pancreatic β-cell function (homeostasis model assessment (HOMA2 B) (ETD=-44.51
points, P<0.01), adiponectin (ETD = -5.9 x 10⁶pg/mL, P<0.01) and apolipoprotein A (apoA) (ETD = -6.02µmol/L, P<0.05), although plasma HDL was unaffected.
3
the combination treatments had a significant impact on endpoints. CBD and THCV
were well tolerated.
The endocannabinoid system (ECS) modulates food intake and energy homeostasis
(1, 2) and chronic over-activation of the ECS has been identified in obesity and type
2 diabetes (3). The ECS exerts some of its actions by various components activating
cannabinoid receptors 1 (CB1) and 2 (CB2). Modulation of CB1 receptors with
rimonabant (a synthetic cannabinoid) led to a significant reduction in body weight,
waist circumference and triglyceride (TG) concentrations, and an increase in
HDL-cholesterol and adiponectin concentrations (4), as well as a reduction in HbA1c in
subjects with type 2 diabetes (- 0.8% to – 1.25%, P<0.001). However, marketing authorisation for rimonabant was withdrawn in 2008 because of an increased
incidence of psychiatric adverse events (AEs) (5). Rimonabant is thought to be a
CB1 receptor antagonist/inverse agonist, but it is unclear whether modulation of other
cannabinoid receptor activity could have beneficial metabolic effects without
significant psychiatric effects.
Cannabidiol (CBD) is one of the major phytocannabinoids obtained from the
Cannabis sativa L. plant. In rodent studies, CBD has multiple desirable effects in the context of hyperglycaemia, mainly through its anti-inflammatory and anti-oxidant
properties (6-10). In animal models of obesity (ob/ob genetically obese mice), four weeks treatment with CBD 3mg/kg, produced a 55% increase in HDL-C
concentration and reduced total cholesterol (total-C) by more than 25% (GW Pharma
data on file). In addition, the same dose reduced liver triglycerides and increased
both liver glycogen and adiponectin concentration. There is also evidence from
animal studies showing that CBD modulates cardiovascular response to stress (11).
Unlike the related molecule ∆9-tetrahydrocannabinol (THC), CBD does not activate
CB1 receptors in the brain and therefore lacks the psychotropic actions of THC.
cannabis misuse (13). Other receptor sites implicated in the actions of CBD include
the orphan G-protein coupled receptor-55 (GPR55), the putative endothelial
cannabinoid receptor (CBe), the transient receptor potential vanilloid 1 (TRPV1)
receptor, α1-adrenoceptors, µ opioid receptors, the adenosine transporter and
serotonin-1A (5-HT1A) receptors (14). CBD also activates and has physiological
responses mediated by peroxisome proliferator activated receptor γ (PPARγ) (15,16,
17). A CBD/THC combination (Sativex®/Nabiximols) is currently licensed in most EU
countries and in Canada, New Zealand, Australia, Malaysia, the United Arab
Emirates and Kuwait, for the symptomatic treatment of spasticity in moderate to
severe multiple sclerosis, and CBD alone (Epidiolex®) was granted orphan drug
designation by the FDA in February 2014 in Dravet and Lennox-Gastaut syndromes
in children, with Phase 3 clinical trials ongoing in those conditions.
∆9-tetrahydrocannabivarin (THCV) is a naturally occurring analogue of THC, but with
different pharmacological effects. It is has been reported to behave as both a
CB1/CB2 agonist and/or a CB1/CB2 neutral antagonist (20, 21, 22, 23,24), probably
dose-dependent, with agonism observed at high doses and antagonism at low doses
(21). However, there is little evidence of CB1 agonsim in vivo compared with the
observed in vivo effects of THC at similar doses. Other target sites of action include GPR55 (25) and transient receptor potential channels (26, 27).
Acute intraperitoneal administration of THCV in rodents at 3, 10 and 30 mg/kg body
weight, caused hypophagia and weight loss, with food intake and body weight
returning to normal on day 2 (18). The effect was similar to that of a CB1 antagonist
AM251, also used in the same study. In another study, involving diet-induced obese
(DIO) mice, oral THCV (2.5 to 12.5 mg/kg) reduced body fat content, increased
glucose tolerance test (OGTT) (19). In the same study, in genetically obese (ob/ob)
mice, a similar increase in 24-hour energy expenditure was observed with 3mg/kg
THCV, while 12.5 mg/kg THCV caused a significant reduction in liver triglycerides
(19). In genetically obese mice (ob/ob), a 1:1 ratio of a combination of THCV and
CBD (3 mg/kg:3 mg/kg),while reducinged total cholesterol levels by 19% and,
increased HDL-C by 50%. The same combination reduced liver TG, increased liver
glycogen levels, reduced fasting insulin and increased energy expenditure (GW
Pharma data on file).
The findings from these preclinical studies demonstrate a potential beneficial effect
of both CBD and THCV, alone or in combination, in diabetes and lipid metabolism,
with very distinct pharmacological profiles, and therefore different side effects, to
rimonabant. This prompted the first ever investigation of the effects of CBD and
THCV on dyslipidaemia and glycaemic control in subjects with type 2 diabetes.
Research Design and Methods
Subjects and study design
This randomised, double-blind, placebo-controlled, parallel-group, phase 2a
proof-of-concept study was conducted at four United Kingdom centres. The protocol was
reviewed and approved by the East Midlands - Leicester Multi Centre Research
Ethics Committee (10/H0406/42) and local R&D departments as required, and was
conducted in accordance with the Declaration of Helsinki. All subjects provided