Effect of mechanical preconditioning on
the electrical properties of knitted
conductive textiles during cyclic loading
Cristina Isaia
1, Donal S McNally
1, Simon A McMaster
2and
David T Branson
1Abstract
This paper presents, for the first time, the electrical response of knitted conductive fabrics to a considerable number of cycles of deformation in view of their use as wearable sensors. The changes in the electrical properties of four knitted conductive textiles, made of 20% stainless steel and 80% polyester fibers, were studied during unidirectional elongation in an Instron machine. Two tests sessions of 250 stretch–recovery cycles were conducted for each sample at two elong-ation rates (9.6 and 12 mm/s) and at three constant currents (1, 3 and 6 mA). The first session assessed the effects of an extended cyclic mechanical loading (preconditioning) on the electrical properties, especially on the electrical stabilization. The second session, which followed after a 5 minute interval under identical conditions, investigated whether the stabilization and repeatability of the electrical features were maintained after rest. The influence of current and elong-ation rate on the resistance measurements was also analyzed. In particular, the presence of a semiconducting behavior of the stainless steel fibers was proved by means of different test currents. Lastly, the article shows the time-dependence of the fabrics by means of hysteresis graphs and their non-linear behavior thanks to a time–frequency analysis.
All knit patterns exhibited interesting changes in electrical properties as a result of mechanical preconditioning and extended use. For instance, the gauge factor, which indicates the sensitivity of the fabric sensor, varied considerably with the number of cycles, being up to 20 times smaller than that measured using low cycle number protocols.
Keywords
E-textile, stainless steel fibers, stretch–recovery preconditioning, fabrication, knitting, materials, performance, properties
Wearable technology has developed rapidly over the last decades, becoming integrated into daily life. The high flexibility and comfort of wearable technology enables it to be used for posture and gesture capture,1 in physiological and biomechanical monitoring sys-tems2 and in healthcare.3 Wearable electronic textiles, also known as e-textiles, range from electronic compo-nents attached superficially to the garment to yarns that have been modified to behave as smart fabric sensors. Fibers can develop sensing properties by coating them with a thin layer of piezoresistive material on conven-tional fabrics,4by knitting conductive fibers into non-conductive knits5or by applying conductive thread in the stitches6 or attached to the top of the fabric.7 Conductivity can also be imparted to the fibers by incorporating at least 10% concentration of carbon nanotubes or a smaller concentration of graphene.
However, this method causes the fibers to stiffen, making fabric construction more difficult compared to metal blended yarns.8
The utility of wearable sensors can be improved by characterizing their behavior under deformation (e.g. stretching) electrically and mechanically. The overall equivalent resistance of a knitted conductive fabric is determined by taking into account the length-related
1Faculty of Engineering, University of Nottingham, UK 2Footfalls & Heartbeats (UK) Limited, UK
Corresponding author:
Cristina Isaia, Faculty of Engineering, University of Nottingham, Nottingham NG72RD, UK.
Email: [email protected]
Textile Research Journal 0(00) 1–16
!The Author(s) 2018 Reprints and permissions:
resistance Rl and the contact resistance Rc9described
according to Ohm’s law10and Holm’s contact theory,11 respectively.
Many works have investigated the relationship between the resistance and the elongation of conductive fabrics. For instance, the deformation behavior of fabric under biaxial extension has been theoretically described using the hexagon resistance model12 and experimen-tally verified.13 Analytical equations have modeled a resistive network of conductive knitted stitches for dif-ferent numbers of courses and wales,14 whereas empir-ical equations for the length-related resistance Rl and
the contact resistanceRchave been developed for fabrics
unidirectionally extended.15 The effect of temperature on the conductivity of the knitted fabrics has been con-sidered16as well as the elongation-dependent behavior of fabrics knitted with different stitch dimensions, yarns and elongation directions.17 Moreover, the time-dependent behavior has been analyzed by considering static elongations after the fabric has been kept in a pre-elongated position for 30 minutes (in order to simu-late the wearing of a breathing sensor).17
Nonetheless, no studies have reported whether and in what manner the mechanical and electrical properties change after extended use or a considerable number of stretch–recovery cycles. As the overall electrical resist-ance is related to the length of yarn and contact force between yarns, it is not possible to study the electrical properties comprehensively without investigating the mechanical effect of cyclic loading. In addition, there is no systematic analysis of the electrical behavior of the conductive textiles after mechanical preconditioning with stretch–recovery cycles and of the effects of the current and the deformation rate on the fabric resist-ance variation.
The objective of this study is to assess the effect of mechanical preconditioning on the electrical behavior of knitted conductive fabrics by studying whether the resistance stabilizes after a number of cycles, after a rest period and whether the electrical properties are affected by the way the fabrics are mechanically loaded and electrically driven.
The novelty is the evaluation of such effects on con-ductive textiles knitted with specific stitch patterns in view of their application as elongation sensors.
Influencing factors of the fabric resistance
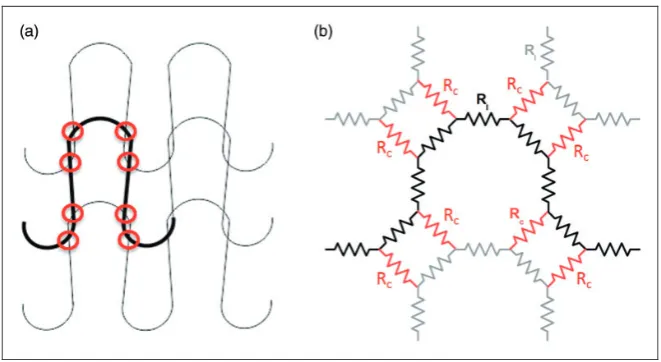
[image:2.595.126.457.524.705.2]To understand the electrical behavior of knitted con-ductive fabrics during stretch–recovery cycles and relate it to their mechanical properties, an overview of the equivalent electrical model describing the structure of the fabrics is given. Knitted textiles are described as interconnections of loops of courses and wales, with each loop (i.e. the basic unit of knitting18) consisting of a head, two legs and two sinker loops joining the adjacent loops,19as shown in Figure 1(a). The conduct-ing fiber makes contacts at the intersection of the head of a stitch with the sinker loops of the stitch above in the same wale and side by side between two stitches on the same course. In practice, this leads to four contact areas between the loop under consideration and the adjacent loops. Depending on the loop geometry and applied strain, each contact area comprises one or more contact points, influencing the contact resistance and the equivalent resistance model. For simplicity, in Figure 1(a), two contact points for each contact area are represented. Figure 1(b) describes the associated electrical network consisting of interconnected contact resistances Rc (highlighted in red) and length-related
resistancesRl(drawn in black for the loop under
con-sideration and gray for the adjacent loops).
According to Ohm’s law,10 the resistance of a conductive yarn changes when it is stretched as it is directly proportional to the wire length,L, and inver-sely proportional to its conductivity, and cross-sectional area,A
Rl¼
L
A ð1Þ
When the knitted textile is subjected to a uniaxial strain the configuration of the loop changes and, con-sequently, so does the length of a stitch. This is due to the slippage of the yarns in the loop during the exten-sion and the overall loosening of the fabric after extended use.
Thus, when considering only the effect of the length-related resistance, the fabric resistance increases with elongation according to Equation (1). Nonetheless, when the elongation further increases, it is also neces-sary to take into account the contact resistanceRc, as
the gap between the strands of yarn shrinks. This results in better contact, adds parallel conductivity paths and leads to a decreased resistance. To describe the contact resistance between two fibers it is possible to use a modified formula very similar to the one ori-ginally proposed by Holm in his contact theory11
Rc¼
c 2 ffiffiffiffiffiffiffi H nP r
ð2Þ
whereRcis the contact resistance,cis the contact
elec-trical resistivity, H is the material hardness, p is the mathematical constant (3.14151), n is the number of contact points (related also to the number of stainless steel fibers in the knitted textile) andP is the contact pressure, both depending on the sensor design. The reader should be aware that in this paper c is not
only the electrical resistivity of the conductive materials (as originally intended by Holm) but it is the resistivity of the whole contact (conductors and contact surfaces) and, consequently, it takes into consideration all the factors that could influence the contact resistivity. For our purpose, it is enough to highlight thatcis
depend-ent on the currdepend-ent flowing through the fabric. The con-tact surfaces are not affected by the stretching of the fabrics and the applied tension but by the presence of oxidation layers or environmental humidity.20 The material hardness is assumed constant for a given con-ductive yarn and not influenced by the fabric’s elong-ation, whereas the number of contact points and the contact pressure depend on the applied strain. Thus, while the knitted fabric is under strain, changes inRc
are caused by the change of the contact force acting on
the two overlapped yarns during the deformation pro-cess of the fabric. In particular, the contact resistance decreases with higher contact pressure or increased number of contact points. For instance, by stretching the textile in the wale direction the contact pressure between the interlocked fibers increases and, hence, the contact resistance of the fibers at the interlocks decreases. Depending on whether the conductive yarn is knitted together with conductive yarns or non-conductive yarns, a single loop could have either only length-related resistance or both length-related resist-ance and contact resistresist-ance. Moreover, the way the loops are interconnected to each other determines the interaction between contact and length-related resist-ances during elongation and, thus, the electrical behav-ior of the fabric. By including properties related to the mechanics of the fabric (such as loop length, cross-sectional area, contact pressure, number of contact points), the electrical model becomes strongly influ-enced by the mechanical status of the specimen. Consequently, any change of the mechanical properties during cyclic loading leads to a change of the fabric electrical behavior, as demonstrated in the paper.
It is worth clarifying that a detailed description of the electro-mechanical model or simulation are outside the scope of this paper as the focus is on experimental evaluation of the conductive fabrics and not predictive models. Also, for the purpose of the manuscript, it was relevant to evaluate how the variation of contact resist-ance with contact pressure and current level affected the overall electrical properties shown by the conductive samples and not to measure experimentally either the resistivity or the contact resistance in certain areas of the specimens.
Experimental design
To investigate the role of preconditioning tests on the electrical behavior of conductive fabrics and the fabric resistance variation at different currents and elongation rates, a detailed experimental set up has been arranged as described below.
Materials
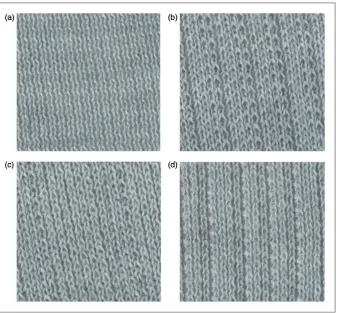
in the present paper. The difference between the four stitch patterns is illustrated in Figure 2 and reported in Table 1 in terms of fabric density (wales per cm and course per cm), stitch density and loop lengths. The loop length was calculated according to the equation provided for conventional knitted fabrics,22 with loop width, loop height and yarn diameter being determined by means of an optical microscope (Nikon Eclipse LV100 ND) and an image analyzing software (NIS-Elements).
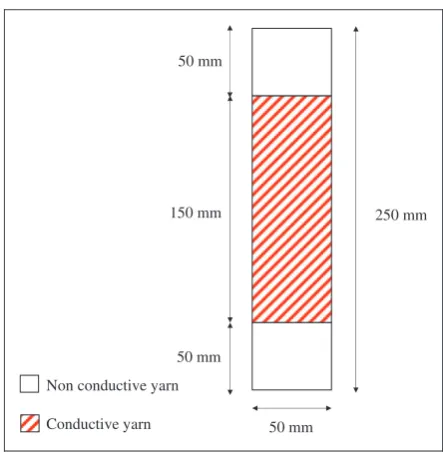
The samples were all formed by a course of knit, which means that a horizontal row of needle loops was produced by adjacent needles during the same knit-ting cycle. Each of the four samples was 250 mm50 mm (heightwidth) and made of both conductive (150 mm50 mm) and non-conductive yarns, as illustrated in Figure 3.
Conductive yarn. The conductive yarn used in the sam-ples was a spun staple fiber yarn (Schoeller, Bregenz, metric number Nm-50/2) constructed of 20% Inox steel fiber AISI 316L (conductivity 1.351106S/m, 8mm in diameter) and 80% polyester (PES) low pill fiber (16mm in diameter). These staple fibers were>80 mm long and
co-mingled when spun together into the yarn, integrat-ing the sensintegrat-ing part durintegrat-ing the manufacturintegrat-ing stage of the fabric (in contrast with coated sensors). According to the Schoeller yarn specification, the number of twists per meter was 600 Z t/m for the single yarn and 425 S t/m for the folded yarn. The tenacity (measured in Newtons per weight unit of yarn) was 916.4 cN/tex and the extension (elongation) at break was 19%.
[image:4.595.298.533.267.352.2]Non-conductive yarn. The non-conductive yarn was a 150 dtex filament yarn consisting of 48 filaments of PES
Figure 2. Knitted conductive samples used in the study: (a) Single Jersey; (b) SP27; (c) SP29; (d) SP31 (ßFootfalls & Heartbeats (UK) Limited).
Table 1. Definition of the fabric parameters for the conductive samples used in the study
Sample
Wale/cm (WPC)
Course/cm (CPC)
Stitch density
(cm2)
Loop length (mm)
[image:4.595.125.464.383.696.2]constructed by texturing processes (introducing bulki-ness into continuous filaments).
Sample preparation. The samples were knitted on a flat-bed Shima Seiki 122S 10 gauge weft knitting machine at The School of Materials Textile Laboratory at the University of Manchester, according to the knitting notations whose intellectual protections belong to Footfalls & Heartbeats (UK) Limited.
Tensile machine and clamps. The tensile machine used to study the conductive fabrics’ behavior was an Instron
8801 (Figures 4(a) and (b)). To gather the electrical signal coming from the conductive fabrics during cyclic loading, customized clamps were employed (Figure 4(c)). The specimens were gripped between polytetrafluoroethylene (PTFE) insulating pads to avoid any contact between the metallic grips of the ten-sile machine and the conductive area of the samples. The applied clamping force was equal to 2 N for all samples to ensure the same test conditions, while not affecting electrical-wise the specimens by providing dif-ferent contact pressure in correspondence of the clamps.
[image:5.595.68.290.230.458.2]Electronic circuitry. To measure the electrical resistance of the conductive textiles and the effect of the current on the fabric resistance during cyclic loading, a constant-current method was employed and a four-wire resist-ance measurement was chosen. Three different current values were provided to the specimens by a purposely manufactured circuit, which worked as a controlled current generator. In other words, the circuit adjusted the voltage applied to the fabric under test to maintain the current sourced to the specimen constant and equal to a set value. The voltage across a sense resistor (which was directly proportional to the current sourced to the samples) was totally unaffected by the stretching, as the bandwidth of the operational amplifier used for current control was several orders of magnitude higher (mega-hertz) than the highest harmonic effectively present in the fabric resistance variation as a consequence of the stretching (described later on in the Time–frequency analysis section). Data were then collected with a NI USB-6003 acquisition system and post processed in MATLAB for the electrical characterization of the con-ductive fabrics.
Figure 4. (a)–(b) The Instron 8801 Fatigue machine. (c) The customized clamps.
50 mm 50 mm
150 mm 250 mm
Non conductive yarn
Conductive yarn
[image:5.595.118.490.511.699.2]50 mm
The documentation of the circuitry as well as a detailed fabric analysis for all samples presented in the paper will be published in Isaia.23
Testing procedure
Before starting the tests the SJ, SP27, SP29 and SP31 samples were kept for a minimum of 20 h in a tension-free state. The test specimens were handled carefully to avoid folds or wrinkles and minimize the effect of hand-ling during positioning in the clamps. Each sample was gripped in the clamps under tension (without undergo-ing any pre-deformation/elongation); thus, the elong-ation started at exactly the beginning of loading. Cyclic unidirectional elongations were then performed with the Instron 8801 Fatigue machine, with the test specimens being tested in the standard atmosphere for testing textiles described in the ASTM D1776 standard (temperature: 211C, relative humidity: 655%).
The original – unstretched – length of the fabric between the clamps was 100 mm. For all samples the elongation was along the course direction and equal to 16 mm. The elongation value was chosen by mirroring typical human body extensions and considering a com-parable fabric deformation on a garment during walk-ing. In fact, future research aims to use the fabrics as sensors for monitoring human body movements. The amount of stretching corresponded also to the max-imum value before a non-recoverable deformation occurred. This means that the mechanical loading was at limit of the deformation of the loops.
The choice of evaluating the electrical properties of these specific knitted textiles along the course direc-tion was due to their limited resistance variadirec-tion (kilo-ohms instead of mega(kilo-ohms measured along the wale direction). This leads to the possibility in applying them in a circuitry with a Wheatstone Bridge in case only limited resistance variations need to be measured in future.
For each sample, the testing was arranged in two sessions: the preconditioning test and the repeatability test. The two sessions were repeated for the four sam-ples at three currents (1, 3 and 6 mA) and two elong-ation rates (9.6 and 12 mm/s), for a total of 48 trials. For instance, after an initial rest period of at least 20 h, the SJ was firstly mechanically preconditioned at 1 mA and 9.6 mm/s and, after 5 minutes rest period, tested again at the same conditions. Later on, the same sample was mechanically preconditioned at 3 mA and 9.6 mm/s and, after 5 minutes interval, stretched again with the same procedure. The same occurred at 6 mA and 9.6 mm/s. All samples followed this procedure for both elongation rates. Each session consisted of 250 stretch–recovery cycles, which were performed with a triangle wave of 16 mm amplitude and 0.3 and 0.375 Hz
frequencies corresponding to the two elongation rates selected for the tests.
The difference between the two sessions was not in the methodology (the tests were repeated for the same number of cycles under the same conditions) but only in the rest periods (2 h at least and 5 minutes, respect-ively) and in the results produced. The choice of the current values was mainly related to considerations about the design constraints in battery operated wear-able applications. In fact, most of the low-voltage oper-ational amplifiers used in small-signal applications have limited current sourcing capability, typically below 8 mA. Consequently, 1, 3 and 6 mA can be respectively considered as low, medium and high current values when considering the above current limit. The chosen elongation rate values cover a range of possible deform-ation rate during walking.
First test session: preconditioning of test specimens. The pre-conditioning test was the first test performed whose aim was the evaluation of any change or stabilization of the electrical properties of the fabric as a result of a certain number of stretch–recovery cycles. By preconditioning effect we mean the stabilization of the electrical proper-ties of the fabric resulting from the cyclic mechanical loading.
Second test session: repeatability after preconditioning. The goal of the second session of tests was to study whether a short rest period reset the preconditioning effects. Without modifying the setting of the specimen in the clamps, the second test session was repeated at the same testing conditions of the preconditioning test after a rest time of 5 minutes. This time was chosen to electric-ally characterize the specimens in a way compatible as possible with a real application (e.g. fabric embedded in a garment at the knee and tested after a limited sitting/ rest period).
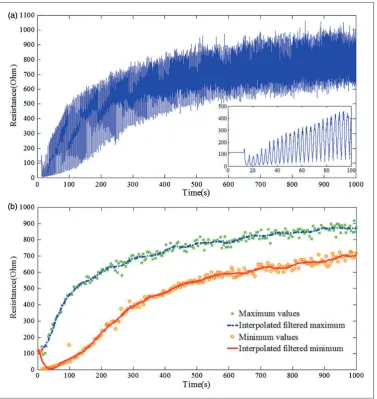
window length M¼151 was applied to the signal (Figure 5(a)). This window was chosen sufficiently large to make it impossible for the low-order polyno-mial to follow fast changes in the signal due to the noise. At the same time the window was yet sufficiently small (compared to the period of the signal) to accur-ately follow the fabric resistance variation without introducing distortions or delays. Next, by analyzing the peaks of the filtered signal, the maximum and min-imum resistance values were detected for each cycle and two curves determined. Again, by filtering the found maximum and minimum points with a Savitzky– Golay filter of polynomial order N¼3 and window length M¼21, the variability in the extracted data points was reduced. Subsequently, interpolation curves passing through the maximum and minimum
filtered values were established (Figure 5(b)). In this way, maximum and minimum points separated from each other by half a period were compared in the time domain.
One of the main features for describing the electrical behavior of the samples, independent of the fabric design and composition, was thepeak-to-peak span. It was determined by subtracting the interpolated filtered minimum curve from the interpolated filtered max-imum one. The peak-to-peak span was chosen as it provides information in terms of sensitivity of the fabric-transducer.
[image:7.595.117.495.296.696.2]Another feature describing the fabrics’ electrical properties was the mean filtered resistance calculated from the settling time onwards. It will be referred to asstabilized average resistancein the rest of the paper.
Results and discussion
Analysis of the electrical behavior
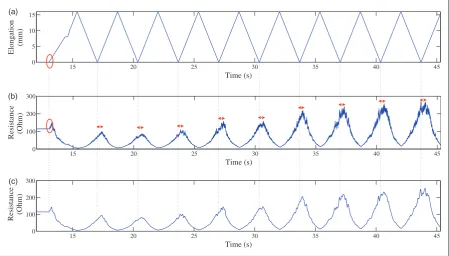
The electrical behavior of the samples undergoing cyclic loading was analyzed. To be consistent with the way of presenting the outcome of the post pro-cessing, SP29 is the sample used to show the testing results. Furthermore, this choice is due to space con-straints (it is not possible to show the same plots for every sample and test condition) and as identical trends in the other samples lead to similar consider-ations. In particular, Figure 6 reports the analysis of the electrical behavior of the SP29 sample sourced with 3 mA and tested at 9.6 mm/s during precondition-ing test. When the specimen is initially elongated, its electrical resistance increases proportionally to L of Equation (1) due to increased length of the stitch (red ellipses, Figures 6(a) and (b)). This was possible because the elongation of the specimen (and thus of the yarn) started at exactly the beginning of loading (thanks to the initial position of the fabric in the clamps). With the increasing elongation a better con-tact between yarns caused a decreased concon-tact resist-ance – for the appearresist-ance of multiple parallel conduction paths according to Equation (2) – and, therefore, a decreased resistance. This phenomenon justified the minimum resistance value occurring at
the maximum elongation, that is, 16 mm. Similarly, one would expect that the maximum resistance value occurs exactly in correspondence to the minimum elongation. Nonetheless, again, the mechanical char-acteristics of the fabric have a considerable impact on its electrical behavior.
The red arrows in Figure 6(b) highlight the delay between the maximum resistance and minimum elong-ation values. This delay is caused by the higher mech-anical time constant of the fabric when compared to the frequency of the stretch–recovery cycles. In fact, when the elongation reaches its minimum value (i.e. initial position of the clamps), the stitch length has not reached its minimum value as the loops shrink slowly in accordance with the fabric mechanical time constant. Consequently, the maximum resistance is measured with a delay, after the minimum elongation. This delay is not present when considering the maximum elongation/minimum resistance values as the fabric is elongated by the tensile machine and, thus, the length of the stitch forcibly changes with the timings imposed by the Instron machine.
The choice of illustrating only the first cycles is to show the increasing tendency of the fabric resistance since the beginning of the test and the resistance vari-ation with the elongvari-ation performed. More cycles would provide the same information with only a
15 20 25 30 35 40 45
0 5 10 15
Time (s)
Elongation
(mm)
15 20 25 30 35 40 45
0 100 200 300
Time (s) Resistance (Ohm)
15 20 25 30 35 40 45
0 100 200 300
Time (s) Resistance (Ohm)
(a)
(b)
[image:8.595.67.517.426.682.2](c)
Figure 6. Analysis of the electrical behavior of the SP29 sample sourced with 3 mA and tested at 9.6 mm/s during preconditioning test: (a) elongation versus time; (b) original resistance versus time; (c) Savitzky–Golay filtered resistance versus time (N¼3 and
difference in higher resistance values, as explained later on in the paper.
Analysis of the knitted fabric parameters
After fatigue tests conducted on the four conductive samples, the shape of the stitch changed for all speci-mens. An analysis of the knitted fabric parameters was performed with the same optical procedure used for samples never stretched before (Table 1). The results of the optical analysis are reported in Table 2 in terms of loop length before and after preconditioning, standard deviations and percentage of variation, with loop length being again calculated according to the equation provided by Cuden et al.22 The figures in Table 2 are the mean values of the stitch parameters contained in an inch of fabric.
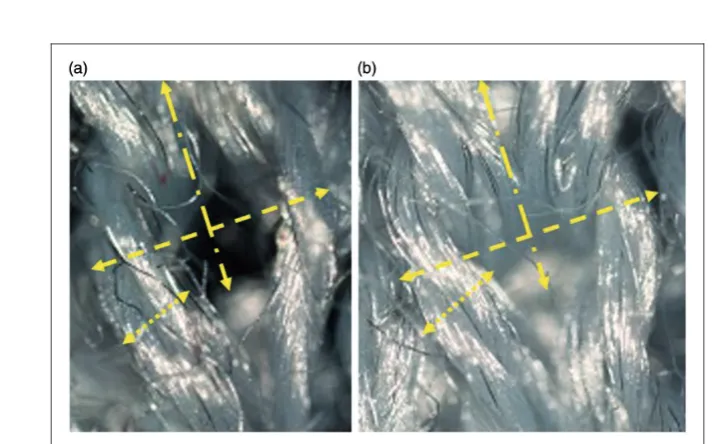
Figure 7 compares the dimensions of SP29 before and after fatigue. It is worth noting that the loop width and the diameter of the yarn increased, whereas the loop height did not change considerably while the sample was elongated in the course direction. Between the two tests the values of loop height, loop width and diameter changed from 1375, 1490 and 497mm to 1384, 1607 and 514mm, respectively.
Effect of mechanical preconditioning on the electrical
behavior of knitted conductive fabrics
Tests conducted on knitted conductive specimens showed the stabilization of the electrical resistance within the samples. A change point analysis24 was used for determining the settling time for each sample during each test (48 in total), by identifying the instant and extent to which change in the characteristics of interest (in this case peak-to-peak span) occurred to a statistically significant degree. This analysis allowed us to detect changes in the standard deviation using the Gaussian log-likelihood.
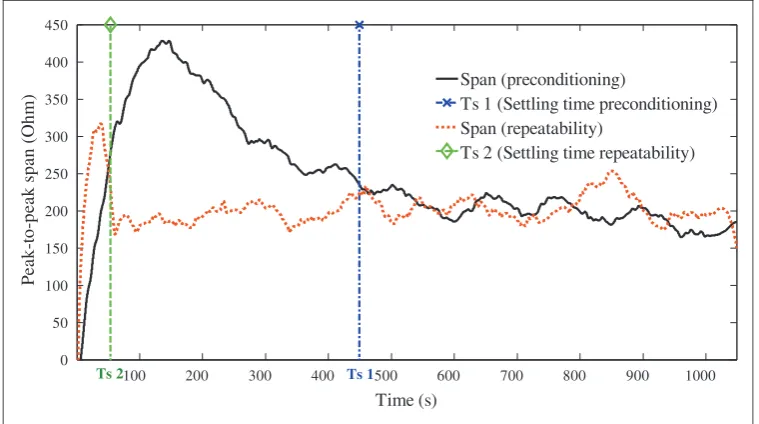
SP29 is the sample used as an example to show the effect of mechanical preconditioning on the peak-to-peak span during both tests, with the settling time (Ts) being determined by the change point analysis
[image:9.595.115.472.466.688.2]and the results for all the patterns summarized in Figure 8. From this it was evident how, after the initial cycles in which the electrical equilibrium was not reached, the peak-to-peak span settled to a constant value (around 200 X), which was conserved after a period of rest. Some fluctuations around the stabilized value occurred, especially during the repeatability test.
Figure 7. Analysis of the dimensions of the stitch for the SP29 (a) before and (b) after preconditioning. Loop height, loop width and diameter are represented with long dash dot, dash and round dot, respectively. (Color online only.)
Table 2. Comparison of loop lengths before and after preconditioning
Sample
Loop length (mm)
Standard deviation
Loop length after (mm)
Standard deviation after
Percentage of variation (%)
However, such fluctuations have a very low frequency when compared to the signal of interest (stretch– recovery cycles) and thus they can be removed by using a simple detrend algorithm.
The reader should keep in mind that the scope of this paper is to evaluate the performance of different knitted fabrics in view of their future application as knee-angle sensors. In particular, once the effect of mechanical properties over electrical behavior has been investi-gated, it will then be possible to consider special fabric treatments (e.g. embedding in a particular sup-porting garment) to improve the mechanical behavior and thus electrical repeatability.
Moreover, Figure 8 shows that the rest period between the first and second session did not cancel the effect of the preconditioning process. As a result, during the repeatability tests the samples showed again a stabilization of the peak-to-peak span and, compared to the preconditioning session, it occurred in a shorter settling time (TS25TS1). In other words, the
stabiliza-tion of the electrical behavior was faster when the sam-ples underwent preconditioning.
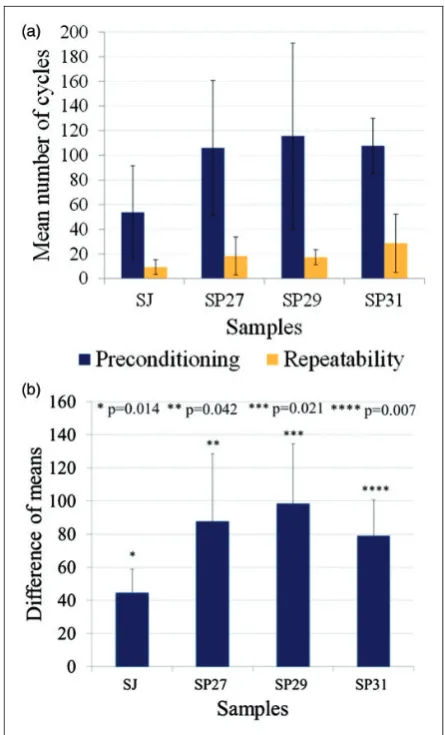
The performance of all samples after mechanical preconditioning is summarized in the following figures. Figure 9(a) describes the number of cycles to settle for each sample during the preconditioning and repeatabil-ity tests. Each bar shows the mean and standard devi-ation observed for a given sample at three different currents and two elongation rates. The choice of repre-senting results from different test conditions in the same bar is justified by the common tendency for all speci-mens (the reduction of the number of cycles to settle occurs independently of the current provided and
elongation rate performed) and by compactness reason. The consequence of the joint representation of values obtained from different test conditions in Figure 9(a) is a higher standard deviation.
The number of cycles was calculated as
N¼k Tð sT0Þ lr ð3Þ
where k¼1/2 L is a constant with L being the fixed elongation (16 mm), Ts is the settling time calculated
with the change point analysis, T0 is the time when
the sample starts its elongation for the first time and
lris the elongation rate.
Results showed the decreasing number of cycles between the two tests. For instance, SP27 and SP29 were the samples that needed the longest period of time to settle during the preconditioning, with 106 and 116 cycles respectively. Nonetheless, they were also the samples for which the mechanical precondi-tioning had the most consistent effect, with the number of cycles being decreased to 18 and 17 cycles, respectively, during the repeatability test.
To validate the effectiveness of mechanical preditioning on the electrical properties of knitted con-ductive samples a statistical analysis was conducted. The paired-samples t-test was chosen to determine whether there was a statistically significant difference between the means of number of cycles for the electrical stabilization during and after preconditioning. Figure 9(b) reports the difference of means between each pair of samples, the error bars corresponding to the standard error and the p-values. Significant
100 200 300 400 500 600 700 800 900 1000 0
50 100 150 200 250 300 350 400 450
Time (s)
P
eak
-t
o-p
eak
s
pan
(
O
hm)
Ts 1
Ts 2
Span (preconditioning)
Ts 1 (Settling time preconditioning) Span (repeatability)
[image:10.595.102.482.69.281.2]Ts 2 (Settling time repeatability)
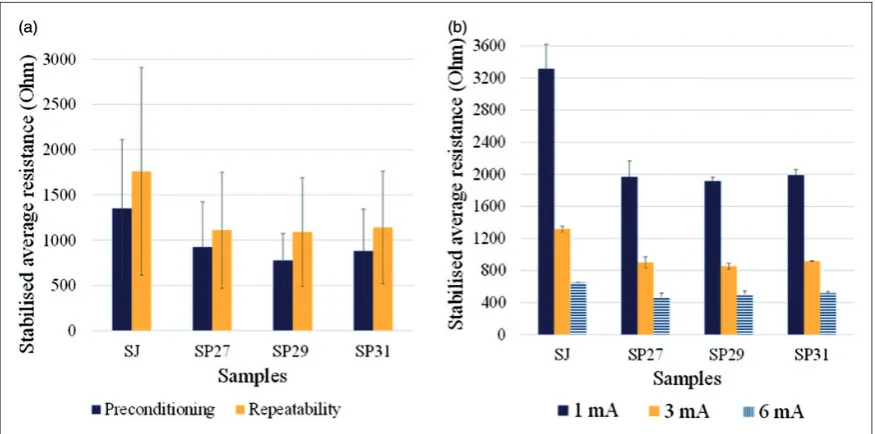
differences were found for all samples, being p<0.05 for the four pairs. This confirmed that the average number of cycles to reach the electrical stabilization was significantly larger during the preconditioning test. Another interesting effect of the preconditioning on all samples was that the stabilized average resistance increased from the preconditioning to repeatability tests. This tendency was likely due to an increase of the total resistance between the trials related to both an increase of the contact resistance and of the length-related resistance. Figure 10(a) illustrates the stabilized average resistance for all samples during preconditioning and repeatability tests. Similarly to Figure 9(a), each bar represents the mean and standard deviation at three dif-ferent currents and two elongation rates, as the tendency was common for all specimens independently of the cur-rent provided and elongation rate performed. Again,
such comparison among values at different test condi-tions justifies the higher standard deviation.
Effect of the current on resistance measurement
It was found that the electrical properties of the con-ductive samples changed with the currents provided. Preconditioning and repeatability sessions performed at three different currents (1, 3 and 6 mA) demonstrated that the stabilized average resistance decreased for increasing currents sourced to the specimens (Figure 10(b)). An explanation of this phenomenon was that on the surface of the stainless steel fibers an oxide film (i.e. passivation layer) exhibited a p-type semiconducting behavior.20Thus, the contact between fibers behaved as an ohmic contact, whose phenom-enon of decreasing resistance with increasing current has been widely observed.25When the sourced current is increased, the contact resistivity c in Equation (2)
decreases, resulting in a decreased contact resistance and, lastly, fabric resistance. The effect of current on resistance (and thus on the stabilized average resist-ance) is more pronounced on SJ as it is the specimen with the highest stitch density. This means that, com-pared to the other samples, SJ has more electrical con-tacts (as represented in Figure 1) between adjacent loops per cm2, leading to more numerous current flow paths.
Effect of the elongation rate on resistance
measurement
It was also demonstrated that the elongation rate had an influence on the number of cycles necessary for the electrical stabilization of the conductive samples, as expressed in Equation (3). In particular, the specimens tested at the highest elongation rates (12 mm/s) gener-ally stabilized more quickly, independently of the cur-rent sourced. Figure 11 describes for all samples the increasing difference of mean number of cycles between preconditioning and the repeatability test (Npre-Nrepeat)
with the elongation rate. The error bars correspond to the standard error.
Sensitivity of the stitch patterns
To evaluate which fabric is a suitable basis for sensor design, it is important to compare the sensing property of the four stitch patterns. To do so, the variation of the gauge factor with the stretching–recovery cycles was calculated as
GF¼ R
R
[image:11.595.68.291.66.434.2]" ð4Þ
Figure 9. (a) Mean number of cycles to reach the electrical stabilization for all samples at three different currents and two elongation rates. (b) Difference of means of number of cycles between the four pairs of samples during and after
whereGFis the gauge factor,Ris the change in resist-ance,Ris the initial resistance andeis the strain value. In this paper, the relative change in resistance is repre-sented by the peak-to-peak span with respect to the average resistance (Ravg). Ravg is the mean value of
the unfiltered fabric resistance variation and is calcu-lated with a Butterworth filter of the order of 2 and normalized cut-off frequency equal to 5105. These values were chosen to remove the ripple due to the loading cycles and, at the same time, to follow the mean variation of the original fabric resistance.
The strain e is the ratio between the absolute change in the specimen length (L¼116100¼16 mm) and the original length of the specimen in the clamps (100 mm).
To specify which stitch pattern delivers the best sen-sitivity under the same test conditions (3 mA and 9.6 mm/s), we compared in the same graph the gauge factor variation with cyclic loading for the four samples (Figure 12). SP29 is the sample that maintains the high-est GF for the longhigh-est time interval. Conversely, the worst sensing properties are shown by SP27. It is evi-dent that there is a common decrease of the gauge factor over time (up to 20 times) due to the loosening of the fabrics.
Time-dependent behavior
[image:12.595.73.511.68.285.2]An important requirement for materials to use as elongation sensors is that their electrical response is repeatable with elongation, to allow computation of elongation based on measurement of resistance. Similarly, for conductive fabrics to be used as motion sensors the aim is that their electrical response is repeat-able with the movement accomplished (e.g. joint flex-ion–extension in correspondence of the fabric stretch– recovery). Therefore, in this study we focused on the fabric electrical behavior during cyclic stretch–recovery phases (and not during a single elongation test) in view of future application in the detection of the knee angle. In applications where conductive fabrics will be embedded into garments for motion capture, the goal Figure 10. (a) Stabilized average resistance for all samples during preconditioning and repeatability tests as mean at three different currents and two elongation rates. (b) Stabilized average resistance for all samples at three different currents during the repeatability test, as mean at two elongation rates.
[image:12.595.58.275.353.528.2]will be to estimate joint angles based on resistance measurement.
A possible reason why the electrical response devi-ates from the ideal behavior is its dependence on the loading path (e.g. stretching, recovery) or hysteresis. Hysteresis is typically caused by friction and structural change in materials.26A study of hysteresis is therefore
important, as the magnitude of such effect can affect the employability of the conductive textiles as sensors.
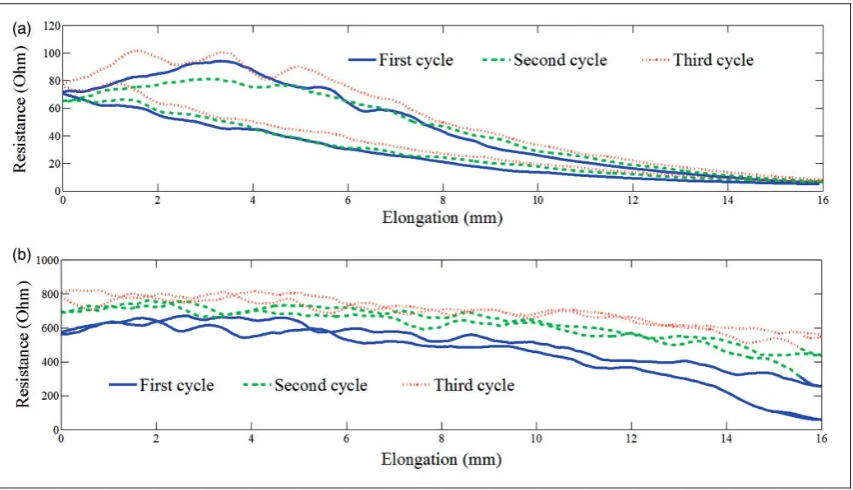
[image:13.595.104.505.66.296.2] [image:13.595.93.520.355.600.2]Figure 13 illustrates the dependence of the elec-trical response of the conductive textiles on the elong-ation for the first three cycles of preconditioning and repeatability tests. The resistance values of both graphs were different, as they referred Figure 13. (a) Hysteresis during the first three cycles of preconditioning and (b) during the first three cycles of the repeatability test for the SP29 sample sourced with 3 mA and tested at 9.6 mm/s.
to different electrical conditions. Figure 13(a) cor-responds to a sample never stretched before. Consequently, its resistance varied slowly during the first cycles of preconditioning, was dependent on the elongation cycle and, thus, affected by a considerable hysteresis.
On the contrary, Figure 13(b) shows the electrical behavior of a sample already preconditioned and tested after a 5 minute rest. From the y-axis range, it is possible to notice the increased average resistance caused by the loosening of the fabrics. The upward shift of the curves was due to the faster electrical sta-bilization during the first cycles of the repeatability test. The hysteresis behavior was also reduced as a result of the mechanical preconditioning.
Time–frequency analysis
The loosening of the fabric during cyclic loading intro-duced additional noise harmonic components to the harmonics spectrum of the resistance signal. A time– frequency analysis is therefore a useful tool to represent how the frequency spectrum of the fabric resistance varies over time. Moreover, from such analysis the har-monics representing both the signal and distortion com-ponents and their variation with time can be described. To evaluate how loosening of the fabric influenced the waveform of the measured resistance during cyclic
loading, the MATLAB functionspectrogramwas used. This command computes a fast Fourier transform (FFT)-based spectral estimate over sliding windows overlapped by 50% and whose width was selected in order to have a frequency resolution equal to 0.01 Hz. In this way it was possible to appreciate how the fre-quency content varied over time during cyclic loading. Figures 14(a) and (c) represent the spectrogram of the SP29 sample during preconditioning and repeatabil-ity tests, with the maximum plotted frequency being 1.55 Hz. This value was chosen as the most relevant frequency content was found in the first five harmonics. The frequency variation within the harmonics spectrum (horizontal axis) was represented as a function of time (vertical axis) with the amplitude (i.e. the power) of a particular frequency at a particular time depicted by the intensity/color of the corresponding rectangle in the spectrogram. The amplitude variations with time for the most relevant five harmonics (0.3, 0.6, 0.9, 1.2 and 1.5 Hz) and for the direct current (DC) component are depicted in Figures 14(b) and (d). The odd harmonics of the fundamental (0.3 Hz) were the expected compo-nents approximating the input (a triangle wave). The even harmonics were instead the distortion terms, which were generated by the loosening of the fabric during cyclic loading.
[image:14.595.71.517.440.681.2]With regard to the evolution with time, it was noticed that the DC component (describing the fabric
average resistance) increased over time. Moreover, during the preconditioning test, the harmonic at the fundamental frequency has seen its amplitude progres-sively reduced, decreasing from the initial value of 300X to approximately 120 X, and the second-order harmonic (0.6 Hz) decreased from 160 X to 110 X, whereas no important variations were appreciated in the other harmonics (Figure 14(b)). During the repeat-ability test, no variation was appreciated in the funda-mental frequency (since its value was almost stabilized since the beginning of the test) and in the other har-monics (Figure 14(d)).
Conclusion
This paper has investigated the effect of mechanical preconditioning tests on the electrical properties of four textiles knitted with conductive yarns. Preconditioning and repeatability sessions performed on an Instron Fatigue machine resulted in a phenom-enon of stabilization of the electrical behavior of the specimens. The results showed that during the precon-ditioning test SJ, SP27, SP29 and SP31 stabilized after 5438, 10655, 11675 and 10822 cycles, whereas during the repeatability session the settling time was considerably reduced to 96, 1815, 176 and 2923 cycles. A paired-samples t-test proved the statistical significance of differences between the preconditioning and repeatability test sessions (p<0.05 for the four pairs), confirming that the average number of cycles to reach the electrical stabilization was significantly larger during the preconditioning test. During repeatability tests it was also observed that there was a larger stabilized average resistance due to the loosening of the fabrics. Increasing sourced currents and elongation rates affected the resistance measurements by, respectively, decreasing the stabilized average resistance (proving the Ohmic behavior of the contact between fibers) and reducing the number of cycles to reach the electrical stabilization. In particular, specimens with the highest stitch density (SJ) showed the most relevant dependence of the resistance on the current (due to the highest number of electrical con-tacts). It was also found that the samples with the lar-gest percentage of variation of loop lengths after preconditioning (þ15.28 for SP27 and þ14.41 for SP29) were more sensitive to cyclic loading under an electrical point of view. Lastly, the hysteresis behavior of the resistance curves was reduced as a result of the mechanical preconditioning.
Acknowledgements
We would like to thank Footfalls & Heartbeats for providing the Single Jersey, SP27, SP29 and SP31 knitted conductive fabrics (ß Footfalls & Heartbeats (UK) Limited) and the
School of Materials textile laboratory at the University of Manchester for manufacturing the samples. We are also grateful to Dr. De Focatiis from the University of Nottingham for providing assistance during testing and the polytetrafluoroethylene insulating pads.
Declaration of conflicting interests
The authors declared no potential conflicts of interest with respect to the research, authorship and/or publication of this article.
Funding
The authors received no financial support for the research, authorship and/or publication of this article.
References
1. Lorussi F, Galatolo S and De Rossi D. Textile-based electrogoniometers for wearable posture and gesture cap-ture systems.IEEE Sensors J2009; 9: 1014–1024. 2. Scilingo EP, Gemignani A, Paradiso R, et al.
Performance evaluation of sensing fabrics for monitoring physiological and biomechanical variables. IEEE Trans Inf Technol Biomed2005; 9: 345–352.
3. Taccini N, Loriga G, Pacelli M, et al. Wearable monitor-ing system for chronic cardio-respiratory diseases. In:
IEEE conference of engineering in medicine and biology society (EMBS), Vancouver, Canada, 20–25 August 2008, pp.3690–3693.
4. De Rossi D, Carpi F, Lorussi F, et al. Electroactive fab-rics for distributed, conformable and interactive systems.
IEEE Sensors J2002; 2: 1608–1613.
5. Huang CT, Shen CL, Tang CF, et al. A wearable yarn-based piezo-resistive sensor. Sens Actuator A-Phys2008; 141: 396–403.
6. Gioberto G and Dunne LE. Overlock-stitched stretch sensors: characterization and effect of fabric property.
JTATM2013; 8: 1–14.
7. Mattmann C, Clemens F and Tro¨ster G. Sensor for measuring strain in textile. Sensors 2008; 8: 3719–3732.
8. Skorobogatiy M and Qu H. Conductive polymer yarns. In: Dias T (ed.)Electronic textiles, smart fabrics and wear-able technology. Cambridge: Woodhead Publishing, 2015, pp.21–53.
9. Zhang H, Tao XM, Wang SY, et al. Electro-mechanical properties of knitted fabric made from conductive multi-filament yarn under unidirectional extension.Text Res J
2005; 75: 598–606.
10. Shedd JC and Hershey MD. The history of Ohm’s Law.
Pop Sci Monthly1913; 83.
11. Holm R.Electric contacts, theory and applications, 4th ed. New York: Springer, 1967.
12. Wang J, Long H, Soltanian S, et al. Electromechanical properties of knitted wearable sensors: part I- theory.
Text Res J2014; 84: 3–15.
study and experimental verification.Text Res J2014; 84: 200–213.
14. Li L, Au W, Wan KM, et al. A resistive network model for conductive knitting stitches. Text Res J 2010; 80: 935–947.
15. Li L, Liu S, Ding F, et al. Electromechanical analysis of length-related resistance and contact resistance of conductive knitted fabrics. Text Res J 2012; 82: 2062–2070.
16. Tong J, Tao X, Au WM, et al. Temperature effect on the conductivity of knitted fabrics embedded with conducting yarns.Text Res J2014; 84: 1849–1857.
17. Ehrmann A, Heimlich F, Bru¨cken A, et al. Suitability of knitted fabrics as elongation sensors subject to structure, stitch dimension and elongation direction. Text Res J
2014; 84: 2006–2012.
18. Li Y and Dai XQ. Biomechanical engineering of textiles and clothing. Cambridge, England: Woodhead Publishing Limited, 2006, p.66.
19. Spencer DJ. Knitting technology: a comprehensive hand-book and practical guide, 3rd ed. Cambridge: Woodhead Publishing, 2001.
20. Yin J, D’Haese C and Nysten B. Surface electrical prop-erties of stainless steel fibres: an AFM-based study.Appl Surf Sci J2014; 330: 65–73.
21. Footfalls & Heartbeats (UK) Limited. http://www.foot-fallsandheartbeats.com/.
22. Cuden A, Hladnik A and Sluga F. Loop length of plain single weft knitted structure with elastane.J Eng Fibers Fabr2013; 8: 110–120.
23. Isaia C. Characterisation and use of knitted conductive textiles as wearable motion sensors. PhD Thesis, University of Nottingham, to be published. http:// eprints.nottingham.ac.uk/etheses/.
24. Picard D. Testing and estimating change-points in time series.Adv Appl Probabil J1985; 17: 841–867.
25. Lee KC. Dependence of contact resistance on current for ohmic contacts to quantized Hall resistors.IEEE Trans Instrum Measur1999; 48: 319–323.