The role of nuclear power in a
low carbon economy
Paper 8:
Uranium resource
availability
An evidence-based report for the Sustainable Development Commission
by Future Energy Solutions, an operating division of AEA Technology plc
AEAT in Confidence
AEA Technology iUranium Resource Availability
Produced by Future Energy Solutions for the
Sustainable Development Commission
Felix Preston
Paul Baruya
AEAT in Confidence
AEA Technology iiTitle Uranium Resource Availability
Customer Sustainable Development Commission
Customer reference
Confidentiality, copyright and reproduction
AEAT in Confidence
This document has been prepared by AEA Technology plc in connection with a contract to supply goods and/or services and is submitted only on the basis of strict confidentiality. The contents must not be disclosed to third parties other than in accordance with the terms of the contract.
File reference
Report number ED02310
Report status Issue 4
Harwell, Didcot Oxon. OX11 0QJ
Telephone +44 (0) 870 190 6757 Facsimile
AEA Technology is the trading name of AEA Technology plc AEA Technology is certificated to BS EN ISO9001:(1994)
Name Signature Date
Author Felix Preston
Reviewed by Paul Baruya
Executive Summary
Figure 1
Projected uranium demand -
MIT base assumptions applied to EIA reference scenerio
0 10,000 20,000 30,000 40,000 50,000 60,000 70,000 80,000 90,000 100,000 20 02 20 03 20 04 20 05 20 06 20 07 20 08 20 09 20 10 20 11 20 12 20 13 20 14 20 15 20 16 20 17 20 18 20 19 20 20 20 21 20 22 20 23 20 24 20 25 U ra ni um D em an d (t on ne s) Africa India China
Central and South America Other Asia
South Korea Eastern Europe Russia & FSU Japan Western Europe North America
!
"
#
•
$ %&%'
(
)* &&&
+
*' &&&
,
Figure 1
-•
+
.
/
0
1
2
3
3
"
•
4
.
-•
!
"
o
7
+
(
+
8
%&
o
7
2
(%9'
,
-(%9'
& 9&6
& %'6
:&6
•
;!<
%(96
'6
%&:&
(
;!<
[image:6.595.79.508.335.604.2]:*6
"
Figure 2
!
"
# $ % & ' $ (
# $ % & ' $ (
# $ % & ' $ (
# $ % & ' $ )
# $ % & ' $ ) * +( ,,
"
,
Figure 2
-•
.
=
=
>?&@"
%&%'
= = A>5&@"
4
?&
*&
•
8
7
:B59
0
.
=
A>5&@"
?&6
%&&9
C
D
•
:&&
3
0
.
=
3
=
, -
:&&
/
•
/
8
#
83E
%&:9
"
F
/
"
#
•
"
/
(
:B)&
+
?&6
7
[image:7.595.99.500.469.736.2]+
"
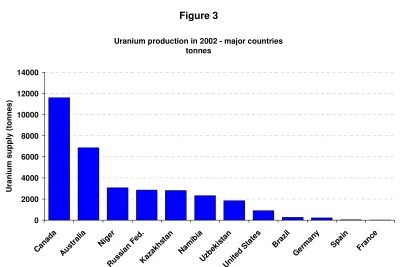
Figure 3
Uranium production in 2002 - major countries tonnes 0 2000 4000 6000 8000 10000 12000 14000 Cana da Aust
ralia Niger
Russ ian Fe
d. Kaza khsta n Nam ibia Uzbe kista n Unite d Sta
tes Braz
il Germ
any
Spain France
•
3E
(
,5&6
- 8
E/
"
•
.
,
Figure 3
-
0 G"
=
"
"
H
"
!3.2
3
•
3E
.
E/
8
!3.2
!3.2
=
0 G"
(
"
!3.2
•
=
0 G"
o
F
=
3E(=
3
2
3E
=
%&6
.
"
8
=
3E
3E
=
E/
%&:?
o
0 G"
"
0 G"
C
/
D
!3.2
"
3
"
"
/
CONTENTS
!
" # $ % $&
' $$
( )
* +
% ,
- .+ / . , 0
1 2/ 3 "
4 '
4 '
) 3 !& 5 (
* ) 3 !0 + 3
-" / $) 3 !% 6 ! 1
' & 5 4
( . $
4 % ,!/
) 3 7 4 & 5
- 3 6 '
1 6 ! 76
3$ 7. + $ $
8 8 % $9 2: 1
6 33$!
6 33$!
/ 9+ ; . :
6 33$!9+ 6+ . :
-" / 6 33$! ""
" $! 7/ $,$! "'
" "'
" 6 ! 7) / "'
" 6 !6 33$! "
" " < $7 ) $ "
" ' / + 6+ .
" * + '
" % $) '
" - % $ = '
' .+ & $ 7 $ . ''
' & $ . ''
' 3$ 7 0 '
' . + *
Introduction
E04
E0
"
/
2
.
,/2.- +
I
(
I
/2.
D
D
H
/2.
#
:
3
%
2
9
/
/
?
7
7
.
'
=
H
3
/
,H3/-
"
' =
H3/
/2.
"
1.1 Overview
E/
2
%&%'
8
"
"
"
,
,
-
,
"
-1.2 Background
=
(
!
.
,
9*& 4
-"
;
+
+
(
5:6
5:6
,
)&B*
-+
"
'&
"
=
"
1.3 Uranium Markets – A History
"
:B?& ,
Figure
4
-!
"
:B'&
(
"
:B)&
"
$
:B)&
Figure 4
/
# .
%&&?
:2
:B)&
E/> ?&@
E/>B&@"
E/> %&@"
:BB&
7
E/> *&(*'@"
E/> )&@"
!
%&&' ,
Figure 5
-
:B5&
7
,E
9!
5-
"
"
J
"
7
E/>@"
Figure 5Ux U3O8 Price converted to US$/kg
Source: UX Consulting, 2005
0 10 20 30 40 50 60 70 80 26 /0 1/ 87 26 /0 1/ 88 26 /0 1/ 89 26 /0 1/ 90 26 /0 1/ 91 26 /0 1/ 92 26 /0 1/ 93 26 /0 1/ 94 26 /0 1/ 95 26 /0 1/ 96 26 /0 1/ 97 26 /0 1/ 98 26 /0 1/ 99 26 /0 1/ 00 26 /0 1/ 01 26 /0 1/ 02 26 /0 1/ 03 26 /0 1/ 04 26 /0 1/ 05 U S $/ lb
/
# E<. %&&'
%
1 “Fueling the Future, A New Paradigm - Assuring Uranium Supplies in an Abnormal Market”, Combs
[image:13.595.76.448.528.740.2]7
Figure 6
"
:B5&
"
"
;
;
:BB9
E/
=
,83E-
"
=
(
,K
3E-%&:9 ,"
83E(
[image:14.595.87.506.247.497.2]-Figure 6
Figure 6
:BB&
83E
,
-C
D
"
:B5&
/
83E
=
C
D
,
-/
83E
7
%&%&
Figure 6
2 Historical Ux Month-end Spot Prices, UX Consulting (2005),
(
"
8
?&6
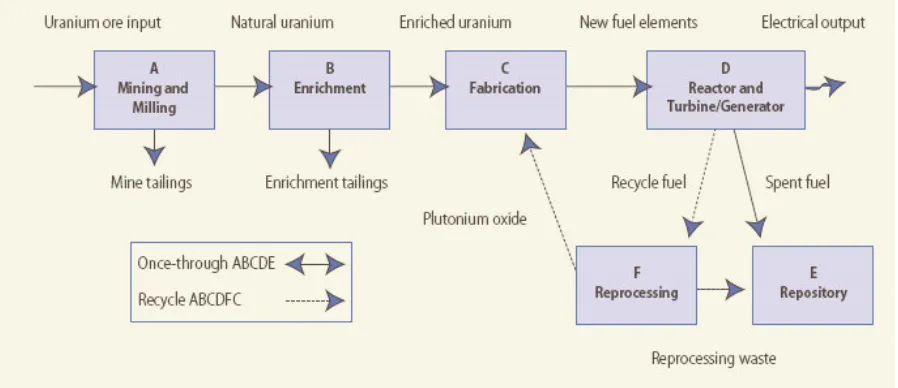
1.4 Nuclear Fuel Primer
.
+
+
;
,; -
H
F
7
%&&9
[image:15.595.75.524.333.527.2]:
;
9Figure 7
,; -
"
3
Figure 7
1.5 Mining and Milling
E
"
%
?
L
?=
,
-.
/ "
.
:&&
.
3 ”The Future of Nuclear Power”, MIT (2003) http://web.mit.edu/nuclearpower/ 4 ”What is Uranium? How does it work?”, Uranium Information Centre, UIC (2005)
;
"
"
,E
9&
5E9!5-
+
"
"
1.6 Conversion
$
E
9&
5,EH
*-
3
=
F
;
"
1.7 Enrichment
E
(%9'
E
9&
5& ):6 (
E
(%95
C
D
E(%9'
& ):6
9 '6
,
-5'6
E
(%95
#
:
%
E(%9'
C
D
E(%95
& %'6
& 9'6 E(%9'
,
-"
E(%9'
+
"
"
E(%9'
(
E
+
8
E/
1.8 Fabrication
3
EH
*,E!
%-G
1.9 The Reactor and Turbine Generator
> 3
$
(
,4 @ -
(
$
(
(
'& 4 @
K
=
K
=
7:&&&
37
"
E0
K
=
B&6
8
(
,
C
D-(
9' 4 @ ,
K
=-
9 %6
'&
4 @
? '6
;
.
(
.
. F2E
$
4=
(
(
H
(
!
K
=
+
(
"
(
.+
$ 7
7
!
F
/
K
=
1.10 MOX Reprocessing
/
(
,E(
%9' 7 (%9B-
,E(%95-;
;!<
%6
"
'7
,;!<
E!
%M7 !
%- ;!<
)6
? '6 E(%9' ,
*&(*'6 7 (%9B-
(
,NB&6 7 (%9B-
'6 7
C
D ;!<
C
D
(
,E!<- (
;!<
;!<
#
-
(
(
-
(
;!<
C
D
;!<
(
"
C
D
+
;!<
"
(
,NB&6 7 (%9B-
E/
=
8
;
C
(
D ;!<
"
;!<
:*6
;!<
E!<
C
D ,
E!<
C
D
- ;
;!<
+
E!<
$
:*6
83E ,
.
% ( 2
5 Information and Issue Briefs – ”Mixed Oxide Fuel", WNA (Jul 2003),
2 Demand
2.1 Introduction to Demand
"
%&%'
!3.2 F
3
*#
C=
(
O
"
(
O !
O
(
(
D
,
-"
.
•
•
"
I
H
/
!
;
"
$
#
?) 3 !0@ A 8?) / $ $ B A C ?*77 ! B A 8?% $% A D ? 4 A
(
"
"
6 ”Uranium 2003: Resources, Production and Demand”, OECD Nuclear Energy Agency and the
E
%&&?
,
4
-,
-$
"
4
"
I
,4
-, -
,
[image:20.595.81.542.368.646.2]-2.2 Capacity Projections
Figure 8
4
%&%'
3 =
Figure 8
Selected projections of nuclear generating capacity to 2025
0 100 200 300 400 500 600
2002 2005 2010 2015 2020 2025 2030
G
en
er
at
in
g
C
ap
ac
ity
(G
W
)
EIA Reference
EIA - Strong Nuclear EIA - Weak Nuclear WNA
'Red Book' High
'Red Book' Low
IEA Reference
3
Figure 8
•
6*
! 7
9
* :
%&&'
# C
"
D C
D
7
3 I
F
;
,
F;-•
E/
F 911":
*)4# $
*
!
!
9
#* :
$
*
!
!9 * :
G
=
$
"
F3
,:5
-
3
!3.2
,%'
-
C$
$
" %&&'D
!3.2
%&%'
•
@
$ # $
9
@# :
F
:%)
!
!3.2 F3
E/ 2
3
•
$*
!
!9* :
13
3
3
E02
,2 -
E02
$
Figure 8
#
•
H
%&&%
%&&'
•
$ %&:&
:&6
"
7 “International Energy Outlook”, US Energy Information Administration (Jul 2005),
http://www.eia.doe.gov/oiaf/ieo/index.html
8 “Nuclear Energy Data 2003”, NEA/OECD (2004)
9 Information and Issue Briefs – “World Nuclear Power Reactors 2004-05 and Uranium Requirements”,
WNA (Sep 2005), http://www.world-nuclear.org/info/reactors.htm
•
%&:&
+
"
/
,
3
-
%&%' ,
3
"
- !
"
3
=
$
"
#
•
3 /
F
=
F3 @ 3 =
$
"
•
3
=
$
" K
F
,
-
%&:&
=
$
" 8
%&%& 2
%&%'
3
,%&&?-$ %&:'
3
::6
3
8
3
%&%'
:96
%&&?
%&&'
3
!
"
3 ,
F
%&&'-
"
3
3
"
$
$
3
3
D
D
,
3
C
D-
"
"
,
-
,
-3
3
!
" %&&'
3
3
+
$3
,! + * G +
*
7
2.3 EIA Capacity Growth Assumptions
3
%&%'
:96
#
•
•
(
•
•
0
7
)%
)9
3
#
C
"
C
D
%&&'
I
')&
%&%'
C
"
D
3
33@H/E
%B)
%&%'
9*:
%&&%
?%%
%&%'
;
P
:?5
P
"
;
3
33@H/E
D
3
C
D
C
"
D
+
Figure 9
Nuclear capacity by region and key countries - EIA reference scenario
0 50 100 150 200 250 300 350 400 450 500
2002 2010 2015 2020 2025
G
en
er
at
in
g
C
ap
ac
ity
(G
W
e)
East Europe Other Asia
South Korea India
China
Central and South America
FSU Japan
West Europe North America
2.4 Regional Capacity Forecast Summary
•
3
9*& 4
%&&%
?9' 4
%&%' ,
:)6-•
3
%&:'
B' 4
%&%'
•
F
:%& 4
•
/
H
/
=
,H/E- 1
/
0
H
1
?* 4
)& 4
•
=
.
9
:' 4
%&%'
.
%
%*
%&%'
.
9* 4
%&%&
+
3
2
2
F
F
::
•
3
C!
D
7 "
Q
F
0
F
•
/
"
3
3EI
"
"
2.5 Projecting Uranium Demand
!
$
7 3
!
,
-.
8
"
.
.
?
;
H
F
7
:%"
$
"
,
.
9 (
/
-!
"
"
#
•
+
$
!3
3
77 $
,
(
-•
+
$ 7
7
!
E(%9'
(
11 Bulletin 46/1 – “China’s Challenging Fast Track”, Zhihong W, IAEA (Jul 2004),
http://www.iaea.org/Publications/Magazines/Bulletin/Bull461/article6.pdf
2.6 Uranium Tails
.
: (
"
$
E(%9'
& %'6
& 9'6
EH
*"
,
-EH
*C
D
E(
%9'
,
& 9'6- .
E(%9'
C
D
(
=
(
/
.
9 ( /
2.7 Demand Forecast by Region
3
Figure 10
[image:26.595.91.503.484.707.2]%&&?
F
Figure 10
Projected uranium demand -
MIT base assumptions applied to EIA reference scenerio
0 10,000 20,000 30,000 40,000 50,000 60,000 70,000 80,000 90,000 100,000 20 02 20 03 20 04 20 05 20 06 20 07 20 08 20 09 20 10 20 11 20 12 20 13 20 14 20 15 20 16 20 17 20 18 20 19 20 20 20 21 20 22 20 23 20 24 20 25 U ra ni um D em an d (t on ne s) Africa India China
Central and South America Other Asia
South Korea Eastern Europe Russia & FSU Japan Western Europe North America
4
3
F3 @ 3 =
$
"
%&%& $
)9 '&&
)' &&&
%6
3
.+
H3
3
E0
%&&%
,:% 4 -
F3 @ 3 =
$
"
;
E0
% &:9
F3 @ 3 =
$
"
E0
: B9&
%&&%
?6
;
E0
;
K
=
E0
(
, 4=
-E0
2.8 Comparison of Uranium Demand Projections
,
-,
-4
3
H
"
F
%&&?
,
-
%&&' ,
-
F
,
-4
#
E
3
(
F
4
#
H
#
H
@4
H
@4
,
-
( (
/
[image:28.595.78.518.490.753.2]2
=
$
"
%&%&
Figure 11
#
-
F
,
F
F %&&?
--
3
,
;
F %&&?
--
=
$
" K
Figure 11
Demand projection comparison for 2020
0 5000 10000 15000 20000 25000 30000
Africa North America
South America
Western Europe
Eastern Europe
FSU China India Japan South Korea
Other Asia
Middle East
U
ra
ni
um
D
em
an
d
(t
on
ne
s)
!
3
;
3
F
/
,
-.
3
F
=
$
"
3 @ ;
3
=
$
"
9&6
*6
3
3
5%6
E/
B%6
::6
7
:96
;
=
$
"
8
=
$
"
+
(
;
,
3
-H
%&%'
2.9 Assumptions and Sensitivities
3
@;
;
3
#
•
,
(
-•
996 ,
@
-•
F
& ):6
•
$
(
'& 4 @ ; 8;,4
-•
=
? ':6 ,
(
'& 4 @ ;
8;-•
& 9&6 ,E(%9'
-•
H
:@9
-;
K
=
,K
=-
7
=
,7
=-!
K
=
$
=
,$
=-"
7 =
(
,
-7 =
%9)4
$ = 5: 4
/
9*& 4
K
=
556
:9;
556
%B* 4
7 =
:?K
=
"
:%6
K
=
;
E0
K
=
/ G
$ $
E0 4=
K
=
E!
%"
[image:30.595.85.544.453.716.2],
.!
%- 8
Figure 12
13 Information and Issue Briefs – “Nuclear Power Reactors”, WNA (Oct 2005)
14 Information and Issue Briefs – “Plans for New Reactors Worldwide”, WNA (Apr 2005)
Sensitivity of demand projections by technical assumption
-30.00 -20.00 -10.00 0.00 10.00 20.00 30.00
70 - 90%
utilisation 100GWd/MTIHM
5 batch management
scheme Tails 0.25% -0.35% 35% thermalefficiency High and Lowscenarios
P er ce nt ag e ch an ge fr om r ef er en ce Demand reduction Demand increase
80% 3
Batch 50
GWd/MTI HM
0.3%
Tails 33% eff.
/
;
Figure
12,
-5&6
3
;
2.10 Summary of Sensitivities
•
5&6
)&6
B&6
M@( :%6
•
(
:&& 4 @ ; 8;
,
'& 4 @ ;
8;-'6 .
(
(
"
"(
+
,
.
:-•
'(
:&6 9(
E/
;
•
C
D
E(%9'
!
E(%9'
& %'6
& 9&6 ,
-•
Figure 13
•
M:56
(%?6
MB&&&
E
(:% &&&
#
,
-"
"
"
Figure 13
Range given by sensitivity of demand assumptions
0 10000 20000 30000 40000 50000 60000 70000 80000 90000 100000
2002 2003 2004 2005 2006 2007 2008 2009 2010 2011 2012 2013 2014 2015 2016 2017 2018 2019 2020 2021 2022 2023 2024 2025
U
ra
ni
um
d
em
an
d
(t
on
ne
s)
Reference Scenario High assumption scenario Low assumption scenario
2.11 Implications of Technological Advancements
8
,
-
%&%'#
-
H
9& 4
%&&'
%&:&
9*& 4
%&&'
-
K
=
+
(
2
$
,
- %&:5
:'-
556
K
= +
K
=
"
"
%&%&
-
4
Q
%&%'
;
K
=
8
4 =
,
(
15 “10-year life extension at Dungeness B nuclear power station”, British Energy (Sep 2005).
0
/
9
1 1:
=
4
+
,
K
=
-E0
!
7(:&&&
E/
F
=
.
,F=.-%&&' .
.
3
E/
;!<
H
F7
,: *&& ; - 3
,37=-
(:BB'
H
H
%&&?
H
F?
4
0
:&6
F?
(
*' 4 @
9*6 E
B%6
*&(
H
H
H
37=
E/
%&&)
4
H
F7
/ = :&&&
:&&&(:%B& ; $ =
:BBB
E/
(
(
%?
!
. F2E
;
3
C
( . F2E( 78 =
7 (%9B
D
. F2E
%'6
3
:*8
. F2E
"
,F3 @ 3
=
$
"
-.=()&& ,
. F2E =
-
C
(
,
: '(% &6 E(%9'-
(
D
F
%:
.
0
I/
9
3
> 1 1:
=
"
4
Q
/
16 “Innovative Technologies for Nuclear Power and the Nuclear Fuel Cycle”, Conference and
4
Q
:)8
,
-F
4
Q
%&9& ,
Figure 14-Figure 14
/
# 4
Q
H
!3.2
,%&&'-H
$
=
+
*&6
;
:5"
%9'
%9B
H
/
K
=
2.12 Mixed Oxide Fuel (MOX)
;!<
C
D
"
:B.
%6
;!<
;!<
9&&
$
H
E0 1
=
F #
17 “A Technology Roadmap for Generation IV Nuclear Energy Systems”, Generation IV International
Forum, OECD (2005), http://www.gen-4.org/Technology/roadmap.htm
18 Appendix 4 – ”Future of Nuclear Power”, Beckjord E S et al,MIT (2003),
http://web.mit.edu/nuclearpower/
19 Nuclear Issues Briefing Paper 42 – “MOX Oxide Fuel”, Uranium Information Centre (Jul 2003),
[image:34.595.76.522.167.420.2]C
;!<
"
%&&
R
S
%&&'
;!<
$ %&:&
;!<
;!<
'6
D
;!<
,E!<- 8
#
;!<
.
;!<
,F3 @ 3
=
$
"
- 8
"
+
F
;!<
#
C
;!<
E(%9'
"
(
9& 4 @
; 8;
'& 4 @ ; 8;
;!<
;!<
/
E!
%;!<
(
9'6
D
@
3
> 0
&$
"
;!<
1
%&&&
E/
=
9?
(
%&:?
%&F
# C
(
;!<
9&6
L
:'
9&&&
::&
"
D
%:8
;
E/
;!< H
(
"
,
20 “Backgrounder on Mixed Oxide Fuel”, NRC (May 2005),
http://www.nrc.gov/reading-rm/doc-collections/fact-sheets/mox-bg.pdf
21 Nuclear Issues Briefing Paper 4 – “Military Warheads as a Source of Nuclear Fuel”, UIC (Nov 2004),
E/
9?
=
(
;!<
E/
%%8
E/ 2
3
;!<
%9&$
7
) $/
@
!
;!<
,
CE!<D
E
!
-Figure 15
2
;
H
F
7
;!<
[image:36.595.115.472.301.527.2]( ;!<
E!<
C
D
Figure 15
Possible MOX fuel contribution resulting in demand saving - up to 2025 tonnes
-10,000 20,000 30,000 40,000 50,000 60,000 70,000 80,000 90,000
2005 2006 2007 2008 2009 2010 2011 2012 2013 2014 2015 2016 2017 2018 2019 2020 2021 2022 2023 2024 2025
U
ra
ni
um
d
em
an
d
(t
on
ne
s)
EIA / MIT Ref
EIA / MIT Ref w/ MOX saving
;
;!<
:*6
83E ,
.
% ( 2
-/
%&:'
;
(
;!<
K
=#
C.
;!<
K
=
(
'& 4 (@(; 8;
E!<
%?
22 Statement of Linton Brook, Acting Under Secretary of Energy and Administrator for National
Security, U.S. DOE (Mar 2003)
http://www.house.gov/hasc/openingstatementsandpressreleases/108thcongress/03-03-04brooks.html
23 Frequently Asked Questions About Mixed Oxide Fuel, US Nuclear Regulatory Commission (Jun
2005), http://www.nrc.gov/materials/fuel-cycle-fac/mox/faq.html#3
24 Appendix 4 – “Future of Nuclear Power”, Beckjord E S et al,MIT (2003),
;!<
:*6
%&:'
"
;!<
'6
%&:& ,
=
$
"
-
;
B
4
;!<
,% '6
-
;!<
Figure 15
3 Supply
3.1 Introduction to Supply
"
%&%'
E
"
%
?
L
%'E
8
%*
.
"
%)
0 G"
.
;
(
.
/ "
:&&
,.
-E
/
"
C
D
(
(
"
,;!<-
"
;!< /
,
T
-,
:&(
:'
T
-
.
? (
=
3.2 Uranium Reserves (the Long Term)
,
-=
$
"
.
25 “What is Uranium? How does it work?” Uranium Information Centre UIC (2005)
http://www.uic.com.au/uran.htm
26 Annex 8 – “Evaluation of Cost of Seawater Uranium Recovery and Technical Problems toward
Implementation”, Analytical Centre for Non-proliferation (2005), http://npc.sarov.ru/english/digest/132004/appendix8.html
Q
(
(
"
%'
.
(
(
,
=
$
"
- .
F3 @ 3
=
$
"
Table 1
F3 @ 3 .
/
=
=
,= =-
"
C
D
3
=
, -
3 = ,
-(
8
"
= =
= =
3 = , -
0
.
=
=
$
"
# >?& @ "
>5& @ "
>:9& @ "
,
>)& @ " -
=
$
"
,%&&?-
= =
,
Figure 16
[image:38.595.96.485.480.726.2]-3
=
, -
/
"
Figure 16
Distribution of uranium resources 2003 - countries reporting major reserves (RAR) tonnes 0 100 200 300 400 500 600 700 800 Aust ralia Kaza khst an Unite d St
ates Cana
da
Sout h Af
rica Nam ibia Russ ian Fede ratio n Nige r Braz il Uzbe kist an Ukra ine Mon golia Indi
a Chin a U ra ni um (t on ne s) USD 80-130/kgU USD 40-80/kgU < USD 40/kgU
)&6
= =
= =
A>?& @ "
0 G"
H
!3.2 0 G"
/
Table 1
F3 @ 3 .
/
/ ,$! / 9/ /: "
G
3
"
= = E
= =
, = =
-* $/ ) ! 9* /> :
= = (
" I
= = 3
" "
K
= = E 3 =(
, = =
-* $/ ) ! 9* /> :
3 =(
(
" 3
" "
K
3 =( 3 =(
63 $ / 96/: 3 =(
G /=
)
E/ ,>- = $ "
3
=
, -#
Figure 17
Distribution of uranium resources 2003 - countries reporting major reserves (EAR-I) tonnes 0 50 100 150 200 250 300 350 Aust ralia Kaz akhs tan Nige r Rus sian Fed erat ion Can ada Nam ibia Sout h Af
rica Braz il Uzbe kist an Indi a Mon
golia Chin a U ra ni um (t on ne s) USD 80-130/kgU USD 40-80/kgU < USD 40/kgU
8
0 G"
.
E/
/
,
= =
-
0
.
=
Figure 18
=
$
"
%&
Figure 18
1983 - 2003 Known Convention Resources (KCR = RAR + EAR-I) '000 tonnes -500 1,000 1,500 2,000 2,500 3,000 3,500 4,000 4,500 5,000
1983 1986 1988 1989 1993 1994 1995 1996 1997 1998 1999 2000 2001 2002 2003
U ra ni um ( '0 00 to n ne s) 80-130 USD/kg
[image:41.595.102.480.524.753.2]0
"
A>5& @ "
?&6
0.=
=
$
"
"
K
C
D
"
8
$
"
[image:42.595.80.515.293.561.2]8
#
Figure 19
Global Red Book Reserves 2003 by category
0 1,000,000 2,000,000 3,000,000 4,000,000 5,000,000 6,000,000 7,000,000 8,000,000 9,000,000 10,000,000 20 02 20 03 20 04 20 05 20 06 20 07 20 08 20 09 20 10 20 11 20 12 20 13 20 14 20 15 20 16 20 17 20 18 20 19 20 20 20 21 20 22 U ra ni um d em an d (t on ne s)
1.73 millon tonnes - <40 $/t - RAR 2.46 millon tonnes - <80 $/t - RAR 3.17 millon tonnes - <130 $/t - RAR 4.59 millon tonnes - <130 $/t - KCR
7.54 million tonnes - speculative undiscovered conventional resources
6.84 millon tonnes - <130 $/t - KCR + EAR II
? *
0.=
>:9& @ "
% %
3 =
Figure 19
)'
(
2
"
(
"
%:
E
+
T
%5,
-+
"
+
@
+
F #
C
"
/
"
"
"
D
%B$
+
"
,
- ;
.
? (
=
3.3 Uranium Supply (the Short to Medium Term)
"
%&
7
$ G
4
Figure 20
.
F
=
0 G"
F
EG "
E/
"
.
"
F
F
:'6
%&&% 0 G"
EG "
:96
=
56 8
0 G"
,
.
? (
=
-"
:B)& +
+
28 “Nuclear Power is a Dead End”, International Physicians for the Prevention of Nuclear War,
http://www.facts-on-nuclear-energy.info/download/en_1a1.pdf
29 “Can Uranium Supplies Sustain the Global Nuclear Renaissance”, WNA (Jul 2005),
8
3
E
,83E-
C
D
K
3
E
,K
3E-Figure 20
Uranium production in 2002 - major countries tonnes
0 2000 4000 6000 8000 10000 12000 14000
Cana da
Aust
ralia Niger
Russ ian Fe
d.
Kaza khsta
n
Nam ibia
Uzbe kista
n
Unite d Sta
tes Braz
il
Germ any
Spain France
U
ra
ni
um
s
up
pl
y
(t
on
ne
s)
*&6
%&&' $
%&%&
"
9&Table 2
Secondary
E
,
=
$
"
F
30 “Analysis of Uranium Supply to 2050”, IAEA (May 2001),
[image:44.595.79.518.174.413.2]Table 2
/
E
) $
" "
" E "
2
" G "
"
$ !
H :BB9 = '&& 8 3
E ,83E- ( %&
, ; ; - 9& 83E
B&&& :&(:96
%&:9
E/ :)? 83E
:'9 K3E
9B 83E
83E %&:9
2
;!< . % ( 2 8
;!< 1 %&&: %&&9 F3 $ $ "
%'& &&& ,
-:)& &&&
$ $ "
;!< " '6
%&:&
. $
, . : %- =
( =
8 3 E
( "
E :BB5 )&&& E
/
= ( E .
3 / ,3/
-%&&& %'&& :&&&
%&&& 3 E
2
=
$
"
/
%&&?
; "
2G "
7
0 G
F
.
0 G
9: [image:46.595.113.490.221.447.2]"
#
Figure 21
%&:'
E/(=
83E
(
%&:9
2G "
%&:'
C83E
D
9%
8
Figure 21
=
$
"
Figure
22
+
"
A>5& @
Figure 21
H
%&:&
2G "
?5 &&&
H
Figure 22
*9 &&&
Figure 22
>5&
"
/
>)&
"
,N>9&
-
2G "
31 ”Uranium production in Kazakhstan as a potential source for covering the world uranium shortage”,
Dzhakishev (2004). Kazatomprom clearly have an interest in calling for additional investment in uranium resources. However, Dzhakishev is careful to explain that his supply data is more optimistic than NEA/IAEA.
32 ”Back from the Brink”, Connor (2004)
Expected uranium production with secondary supply breakdown (Dzhakishev)
0 10,000 20,000 30,000 40,000 50,000 60,000 70,000 80,000
2005 2006 2007 2010 2015
F3 @ 3
Figure 22
Uranium production capability at < US$ 80/t tonnes -10,000 20,000 30,000 40,000 50,000 60,000 70,000
2004 2010 2015 2020
Grade of reserve
[image:47.595.95.509.144.745.2]U ra ni um (t on ne s) Other South Africa Ukraine China Uzbekistan Niger Namibia Kazakhstan Russian Fed United States Australia Canada Table 3
B-II B-II B-II B-II
Canada 12,885 16,425 16,425 14,125 Australia 10,300 12,000 12,000 12,000 United States 3,600 7,200 5,200 5,000 Russian Fed 3,200 4,700 4,700 4,700 Kazakhstan 3,500 4,500 4,500 4,500 Namibia 4,000 4,000 4,000 4,000 Niger 3,800 3,800 3,800 3,800 Uzbekistan 2,300 2,500 3,000 3,000 China 850 1,560 1,560 1,560 Ukraine 1,000 1,500 2,000 2,000 South Africa 1,270 1,270 1,270 1,270 Brazil 340 1,100 1,100 1,100 Mongolia - 1,100 1,100 1,100 India 230 880 1,560 2,890 Argentina 120 500 500
Iran - 410 410 410 Romania 100 300 300 400 Pakistan 65 110 200 250 Czech Republic 440 84 87 80 Total 48,000 63,939 63,712 62,185
2020
2010 2015
7
Figure 22
Table 3
.
%&&?
%&%&
+
!
8
3E
.
3.4 Risks to Uranium Supply
0 G"
4
.
? (
=
,
-"
"
3
/
:&
"
99
#
1. Lack of investment in conversion
2. Lack of investment in new mines
3. Financial/legal difficulties for producers
4. Overregulation, frequent changes and lack of harmonisation in transport
approvals/authorisations
5. Permanent closure of a uranium mine
6. Lack of ports open to nuclear transport - concentration of nuclear transport
companies
7. Permanent closure of a conversion facility
8. Interruption of the US - Russia HEU Agreement
9. Uncertainty of US enrichment capacity in future
10. Delays of new projects due to licensing / environmental regulations.
"
+
;
.
? (
=
One issue - both related to investment and extending beyond it – is the impact on and the
rights of indigenous peoples in uranium mining areas. According to one estimate, 70% of the
worlds uranium resources are located in the lands inhabited by indigenous peoples in Africa,
33 “Analysis of the Nuclear Fuel Availability at EU Level from a Security of Supply Perspective”,
Asia, Australia, and North and South America. Issues typically relate to environmental
pollution, land rights and right to proceeds.
At the Jabiluka mine in Australia, tension and negotiation have existed between the Mirrar
aborigines, ERA (a subsidiary of Rio Tinto) and the government for many years. In 2005 the
Jabiluka Long Term Care and Maintenance Agreement was finally signed. This obliges ERA
(and its successors) to secure Mirarr consent prior to any future mining development of
uranium deposits at Jabiluka.
The European Parliament adopted a motion calling upon Australia to take action in this area
in 1998. The motion notes that the Vienna Declaration adopted by the World Conference on
Human Rights stresses the protection of Indigenous peoples' economic, social and cultural
well-being including their distinct identities and cultures. A green group within the Swedish
Parliament has also led a campaign on the issue. Clearly other international agreements
such as the Convention on Biodiversity, and the Rio Declaration on Environment and
Development are relevant here. It is also an issue UNESCO have been heavily involved in,
including at Jabiluka.
These are complex issues that can clearly, amongst other issues, have a significant impact
on resource availability. In practical terms, it can lead to long delays before otherwise
economic mines are introduced.
4 Analysis of Resource Availability
4.1 Introduction
8
.
,; @
3
-
.
: (
.
% ( 2
"
"
2
%&%'
.
"
4.2 Security of Current Reserves
Figure 23
3
=
8
=
$
"
,
-Figure 23
-,. ' +,( / ! "
!
"
0 +,( 1 2 3/
0 +,( 4 /
! 5 5 6 0 "
0 +,( 4 /
# $ % & ' $ (
# $ % & ' $ (
# $ % & ' $ (
# $ % & ' $ )
# $ % & ' $ ) * +( ,,
,
-!
E/> ?& @ "
%&
8
E/> )& @ "
E/> ?& @ "
"
" ,
-E/> :9& @ "
"
'&
"
8
.
9 ( /
3
(
"
;!<
(
AE/>?& @ "
: )9 ;
4
"
E/> )& @ "
-= -=
% ;
%&
,
.
[image:50.595.77.532.121.395.2]:-•
,
%&%' ,
= = >?&(5& @ "
-•
5:6
B&6
,
E/-%&%9
!
•
)&6
%&%'
•
,
3 /
F
=
/
-
B&6
%&%:
•
= = A>?& @ 0
%&%&
4
?&
*&
= =
"
= = A>?& @ 0
G
:*
%%
8
+
/
? ?
4.3 Secondary Supply Issues
.
% + 2
;!<
:*6
;!<
E!<
C
D ;
;!<
:*6
83E ,
.
%
( 2
-;!<
:*6
%&:'
;!<
"
:%6
8
;!<
"
"
'6
,
.
% ( 2
-4.4 Qualification and Conclusion
.
9 ( /
7
=
$
"
=
=
3
=
,
"
0.= +
0
.
=
-
%&
+
@
;
"
"
3
= =
3 =
C
D
:B)B
9?7
.
9 ( /
9'
,
-
"
/
(
.
,
/
-
I
[image:52.595.118.446.441.702.2],
-
I
Table 4
Ownership of Uranium Production in 2002
Domestic Government
Domestic Private
Foreign Government
Foreign Private
2002 production
% % % %
Canada 52.0 47.0 1.0 11,607
Australia 39.1 2.9 58.0 6,854
United States
Russian Fed 100 2,850
Kazakhstan 96.6 3.4 2,822
Namibia 3.5 96.5 2,333
Niger 32.9 38.8 28.3 3,080
Uzbekistan 100 2,300
China 100 850
Ukraine 100 1,000
South Africa 100.0 824
TOTAL 31 34 20 15 34,520
34 “Uranium - Recent Uranium Industry Developments, Exploration, Mining and Environmental
Programs in the US and Overseas”, American Association of Petroleum Geologists (Jul 2005), http://emd.aapg.org/technical_areas/uranium.cfm
35 ”Nuclear Confusion”, Fairfax Digital citing Prospect Magazine (Jul 2005),
"
F
;
# C
(
:&&&
?&
D
(
(
;!<,
.
% ( 2
-
(
!3.2@ 3
#
=
$
"
%: .
#
C
2
T0
3
8
D
3
3
B&6
,
5:6
- "
(
0.=
"
%&
9&
F
"
!
4
,A>:9& @ " -
+
4.5 Resources in the Short to Medium Term
,
-H
,
-
"
.
9 ( /
Figure 24
2G "
,
.
9 ( /
-
3
,.
% ( 2
- 2
H
Figure 24
%&:'
=
$
"
%&&'
%&:& !
** *&&
%&&'
=
$
"
)& *&&
2G "
** '&&
%&&'
Figure 24
Expected uranium production versus demand up to 2015
0 10,000 20,000 30,000 40,000 50,000 60,000 70,000 80,000 90,000 100,000
2005 2010 2015
U ra ni um (t on ne s eq ui va le nt ) 5 / -78
3 7+ ,
. 5 /
,
/ ,
1+ ! 9 "
: 9 : /
+,( 1 2 0
+,( 4 0
+,( 4 !/ "
B&6#
:& &&&
"
"
3
.
$ %&:'
3
:? &&&
"
E/(=
83E(
,
.
9 ( /
-%&:9
2G "
83E
%&:&
% &&&
I
;
=
)%&&
%&&?
::6
,
U*)&&&
-;
=
::6
.
K"
*&&& ( 5 &&&
%&:'
%&&)
"
!
1
"
8
2G "
.
K"
1
"
8
+
3
/
#
-.
K" ,%&&)- 1
" ,%&::-
8
9*
-
,;
%&&?
"
-
9)-
7
,8
L
;
%&&?--
83E
%&:9
-
=
,
-"
"
"
H
3
=
$
"
:& &&&
,
-
%& &&&
,
-
%&%&
7
H
.
C ?' &&&
.
D
95F
=
36 ”Teetering on the Brink?”, Connor M, WNA Annual Symposium (Sep 2003)
http://www.world-nuclear.org/sym/2003/pdf/connor.pdf
37 ”The Macarthur River Mine Flood”, ITT Flygt (2003),
http://www.ittflygt.ca/Site/En/Pumptalk/Casestories/TheMcArthurRivermineflood.asp
38 ”Uranium Shortage Poses Threat”, Jameson A, The Times (August 2005),
C
D
9B;
C
''6
R
S
,
-O
=
"
"
"
D
?&"
,
C
D-
"
+
+
"
!
C
D
"
3
"
D
D E
(
"
#
C!
H
2
" C
"
8
E/> %' @ "
"
E/> )& @ "
E/
=
83E(
%&:9
+
E/
=
"
"
"
4.6 Demand Side Response
F
3
/
3E ;
/
39 ”Teetering on the Brink”, Connor M, WNA Annual Symposium, (Sep 2003),
http://www.world-nuclear.org/sym/2003/pdf/connor.pdf
40 ”Teetering on the Brink”, Connor M, WNA Annual Symposium (Sep 2003),
,
-C
D
?:;
3E
"
?%;
& 9&6
& %'6
:&6
.
% + 2
8
C
D
?9"
+
4.7 Enrichment
3
.
9 ( /
3E
8
"
.
9&6
%&%&
F
,
3
-
??/
& %'6 ,
-4.8 Fuel Conversion
.
3/
F
EH
*3
?'4.9 A Failing Market?
8
#
T
1 .
?*#
C
2 I "
"
41 “Fueling the Future, A New Paradigm - Assuring Uranium Supplies in an Abnormal Market”, Combs
J, WNA (Sep 2004), http://www.world-nuclear.org/sym/2004/pdf/combs.pdf; Combs also estimates the saving at about 10%
42 “Annual Report”, Euratom Supply Agency (2002), http://europa.eu.int/comm/euratom/ar/ar2002.pdf 43 “Fueling the Future, A New Paradigm - Assuring Uranium Supplies in an Abnormal Market”, Combs
J, WNA (Sep 2004), http://www.world-nuclear.org/sym/2004/pdf/combs.pdf
44 “Fueling the Future, A New Paradigm - Assuring Uranium Supplies in an Abnormal Market”, Combs
J, WNA (Sep 2004), http://www.world-nuclear.org/sym/2004/pdf/combs.pdf
45 Annual Report, Euratom Supply Agency (2002), http://europa.eu.int/comm/euratom/ar/ar2002.pdf 46 Leading u
; " "
I I
I
.
I G
"
"
! I , "
- "
"
I " " I "
, - " , - I
, - 8
D?)
/
.
%&&?
"
8
.
' (
7
E
.
%
?
47 “Fueling the Future, A New Paradigm - Assuring Uranium Supplies in an Abnormal Market”, Combs