Ssennoga Twaha, Jie Zhu*, Bo Li, Yuying Yan, Kuo Huang 1
Fluids & Thermal Engineering Research Group, Faculty of Engineering, University of 2
Nottingham, NG7 2RD, United Kingdom 3
Abstract: 4
The power generated from TEG is relatively unstable owing to temperature variations at its 5
hot and cold side terminals. The dc-dc converters can provide more stable power output thereby 6
improving the overall efficiency of TEG system. However, to facilitate better performance 7
improvement, maximum power point tracking (MPPT) algorithm can be applied to extract 8
maximum power from TEG system. Therefore, parameter analysis of a TEG/dc-dc converter 9
system in different modes is being carried out. A TEG-dc-dc boost converter model is analysed 10
in both MPPT and direct pulse width modulation (PWM) modes subjected to a variable load. 11
To further study the capability of dc-dc converters to stabilise the TEG power output, 12
increasing ramp and random hot side temperature is applied to the MPPT and direct PWM 13
based modes so that the effect on output parameters i.e. voltage and power, can be analysed. It 14
is noted that even for the random temperature input to the TEG, the output voltage resulting 15
from the converter is almost constant. Therefore dc-dc converters are able to stabilise the power 16
generated from TEG. It is also observed that dc-dc converter with MPPT based model is able 17
to effectively extract the maximum power without having to adjust any component from the 18
MPPT algorithm as it is the case with direct PWM based model. From the study, it has been 19
established that proper selection of converter components is necessary to reduce converter 20
losses as well interferences on the load connected to TEG-dc-dc converter system. 21
22
23
Keywords: TEG devices; random temperature; dc-dc converter; MPPT; direct PWM. 24
25
Parameter Analysis of Thermoelectric Generator/dc-dc Converter System with
Maximum Power Point Tracking
1. Introduction 26
Energy-harvesting systems which convert heat into electricity with the use of thermoelectric 27
energy generation (TEG) devices are being constantly developed and manufactured [1][2]. A 28
number of currently available and applicable low-grade waste heat recovery methods adopt 29
thermoelectric (TE) modules including plant/district/water heating, direct power generation 30
and others [3]. TE modules offer low cost electricity without moving parts or production of 31
environmentally deleterious wastes [4]. However, the optimal performance of TE modules 32
depends on several factors like material properties and operation strategy [5]. 33
Various research efforts are underway to improve the performance of TE conversion 34
system. The integrated thermoelectric devices are also developed by restructuring them to 35
allow more heat to enter the p–n junctions, thereby producing more power output [6]. Product 36
development for TEG devices requires solving a couple of challenges in material and system 37
construction aspects for numerous TEG system applications [7]. Accuracy of mathematical 38
models used in thermoelectric simulation is assessed with special reference to thermal 39
influence of insulated air zone and radiation heat [8]. Heat transfer analysis between TEG cold 40
and hot plates reveals that the developed model is of theoretical significance in guiding TEG 41
design for high-power or large-temperature-difference application. Different TEG structures 42
including rotated and coaxial leg configurations [9], rectangular prism and cylindrical legs [10], 43
have been evaluated with regards to power output, temperature distribution, conversion 44
efficiency and thermal stresses in the legs. Not forgetting to mention the concentric cylindrical 45
design which is also applied to TEG system with improved power output [11]. With all these 46
efforts, it is still necessary to do more research work on the performance improvement for TEG 47
systems. 48
Maximum power point tracking (MPPT) methods for a long time have been applied to 49
improve the performance of photovoltaic (PV) system in both normal and partial shading 50
conditions [12]. In order to fully utilize the energy generated from TEG systems, dc-dc 51
converters with MPPT are being adopted to stabilize the output voltage generated from TEG 52
as well as to ensure maximum power extraction from TEG system [13][14][15][16] [17][18]. 53
In [13], an analysis is carried out on an MPPT control strategy for thermoelectric-solar hybrid 54
energy harvesting system. The hot side temperature is set between 40oC and 50oC while single 55
supercapacitor is used as the load to the system purposely to increase the tracking response. 56
The authors in [14] presented a simple MPPT method for TEG which is based on controlling a 57
power converter such that it operates on a pre-programmed locus of operating points close to 58
[16], Yi-Hua et al. presented a novel MPPT for TEG system which combines the benefits of 60
perturb and observe (P&O) method and the fast tracking ability of open circuit voltage (OCV) 61
method with batteries used as the load to the system. In reality, temperature profiles are random 62
in nature, especially in vehicles. As well, some loads are never constant, making it a necessity 63
to analysis the TEG-converter systems when they are subjected to different loads. In our 64
previous study [19], an IC-based MPPT method is presented with a ramp step temperature on 65
the hot side and a constant temperature on the cold side whereas the converter is subjected to a 66
constant resistive load. Therefore, it is necessary to test the TEG-converter system with a 67
random temperature because temperature profiles are random in most of the real applications. 68
Moreover, it is necessary to analyse the system with a variable load to identify the optimal load 69
for the TEG-converter system to perform near its maximum potential. The objective of this 70
work is to investigate the parameters of TEG-dc-dc converter system enabled by incremental 71
conductance (IC) based MPPT and direct PWM signals. The converter performance is analysed 72
with reference to the temperature variation at the hot side of TEG in addition to varying the 73
external converter load. The study is aimed to test the TEG output power conditioning model 74
for application in the waste heat recovery in low carbon vehicle. 75
76
2. Thermoelectric module 77
A Single p-n pair of the TEG module is shown in Fig. 1. A TEG is a solid-state device that 78
can convert heat directly into electrical energy when a temperature difference is placed across 79
it [20]. Electric power can be converted to cooling or heating by reversing the current direction 80
[21]. In a thermoelectric material there are free electrons or holes which carry both charge 81
and heat. The electric potential (Voltage) produced by a temperature difference is known as the 82
Seebeck effect and the proportionality constant is called the Seebeck coefficient. If the free 83
charges are positive (the material is p-type), positive charge will build up on the cold end which 84
will have a positive potential. Similarly, negative free charges (n-type material) will produce a 85
87
Fig. 1. A Single p-n pair of the TEG module [22]. 88
While choosing TEGs for application in varying conditions, it is necessary to select an 89
appropriate semiconductor with acceptable performance in the temperature range of that 90
condition [23]. The figure of merit (Z) is a parameter generally used to gauge the performance 91
of a TE material: 92
𝑍 = 𝑆𝑝,𝑛2𝜎𝑝,𝑛
𝑝,𝑛 (1)
93
Where Sp,n is the Seebeck coefficient of n-type or p-type material; σp,n is the electrical
94
conductivity of the material in p-type or n-type in Siemens per meter whereas 𝑝,𝑛 is the
95
thermal conductivity [23]. All these parameters are known and sometimes given in the 96
datasheet from the manufacturers of the TE devices. 97
In general, for obtaining maximum efficiency, the important characteristic for 98
thermoelectric material is the dimensionless measurement thermoelectric performance figure 99
of merit ZT [21]. 100
𝑍𝑇 =𝜎𝑆2𝑇 (2) 101
Where S, σ, T and are the Seebeck coefficient, electrical conductivity, absolute temperature 102
and thermal conductivity, respectively. In order to get high thermoelectric efficiency, the figure 103
of merit should be large i.e. ZT>1. Alloys, particularly with AgSbTe2, have led to several 104
reports of ZT>1 for both n-type and p-type materials. The p-type alloy (GeTe) 105
3. TEG-dc-dc converter model 107
The developed model is shown in Fig. 2 consisting of the TEG, dc-dc converter and the 108
MPPT algorithm as discussed in the following subsections. 109
[image:5.595.134.462.151.325.2]110 111
Fig. 2. The TEG-converter simulation model 112
113
3.1 TEG Model 114
TEG is modelled based on the concept of simplified model in which some thermoelectric 115
effects are ignored [5]. This is done for simplicity although there is reduced accuracy. The 116
following equations are used to design the model 117
𝑆𝑒𝑒𝑏𝑒𝑐𝑘 𝑐𝑜𝑒𝑓𝑓𝑖𝑐𝑖𝑒𝑛𝑡 (𝑆) = 2𝑉𝑚𝑎𝑡𝑐ℎ
∆𝑇𝑠𝑝 (3)
118
𝑡𝑒𝑚𝑝𝑒𝑟𝑟𝑎𝑡𝑢𝑟𝑒 𝑑𝑖𝑓𝑓𝑒𝑟𝑒𝑛𝑐𝑒 (∆𝑇) = 𝑇ℎ− 𝑇𝑐 (4) 119
For TEG made of two semiconductor components, the output voltage of TEG is expressed as 120
[25]; 121
𝑉𝑜𝑐 = (𝑝−∝𝑛)(∆𝑇)(𝑁𝑇𝐸𝐺−𝑠) (5) 122
For TEG made of a single semiconductor type, 𝑉𝑜𝑐 is given as; 123
𝑉𝑜𝑐 = (𝑁𝑇𝐸𝐺−𝑠)(∆𝑇)(𝑆) (6)
124
𝑅𝑖𝑛𝑡 = 𝑚 [𝑇ℎ+𝑇𝑐
2 ] + 𝑛 (7)
125
Cin
VTE G
ITEG
TEG
LO
AD
DC-DC Converter
Where 𝑝 and ∝𝑛 are the Seebeck coefficients of the p- and n-type materials of TEG 126
respectively; S is the Seebeck coefficients of a single material for TEG; Vmatch is the matched
127
load voltage, Tsp is the temperature difference of the measurement stated in TEG datasheet,
128
Th and Tc are the hot and cold side temperatures of TEG respectively; NTEG-s is the number of
129
TEG modules, Rint is the TEG internal resistance, m is the TEG internal resistance vs TEG
130
temperature (Rint-T) curve slope and n is the Rint-T curve intercept;
131
The TEG model internal resistance Rint and the open circuit voltage Voc vary in real time
132
with temperature. The real-time values of Voc and Rint are mapped to the controlled voltage
133
source and variable resistance respectively in the converter to generate its input voltage and 134
current [26]. The model is designed with time-varying hot side temperature and a constant cold 135
side temperature. It is masked to input other parameters included in the datasheets of practical 136
TEG module from different manufacturer including Vmatch, NTEG-s, Tsp, m and n. So the results
137
of the model can be compared with the practical results of manufactured TEGs if experiments 138
are carried out. The TEG1-12611-6.0 module parameters which is used in [27] are applied in 139
this work with its specification shown in Table I. 140
[image:6.595.104.480.440.659.2]141
Table I. Specifications of the TEG module 142
Hot side temperature (oC) 300
Cold side temperature (oC) 30
Matched load output voltage (V) 4.2 Matched load output current (A) 3.4 Matched load resistance (Ohms) 1.2
Matched load output (W) 14.6
Open circuit voltage (V) 8.4
Heat flow across the module (W) Approximately 365 Heat flow density (Wcm-2) Approximately 11.6 AC Resistance measured at 27oC at 1000 Hz () 0.5 – 0.7
143
3.2. The dc-dc boost converter model 144
Here the converter that operates in a continuous conduction mode (CCM) is discussed with 145
regard to the design specifications and components selection. The first step in designing a dc-146
current the switch or integrated circuit (IC) the inductor and the diode can withstand. But before 148
that, the duty cycle D and the ripple current have to be determined. The duty cycle of a practical 149
dc-dc boost converter is expressed as; 150
𝐷 =𝑉𝑖𝑛 (𝑚𝑖𝑛)∗𝜂𝑐𝑜𝑛𝑣
𝑉𝑜𝑢𝑡 (8)
151
Where 𝑉𝑖𝑛 (𝑚𝑖𝑛) is the minimum input voltage; 𝜂𝑐𝑜𝑛𝑣 the converter efficiency whereas 𝑉𝑜𝑢𝑡 is 152
the desired output voltage. 153
The efficiency is included in the duty cycle equation in order to compute a more realistic 154
value of D in addition to catering for the dissipated energy since the converter has the energy 155
losses. Either an estimated efficiency value can be used e.g. 82% or a typical efficiency value 156
can be selected from the converter characteristics from the datasheet for use in equation (8). 157
Before calculating the ripple current, it is necessary to first compute or determine the 158
inductor value. Various ways are used to determine the inductor value; the recommended 159
inductor value or the middle value in the inductor range given in the datasheet can be used if 160
there is no recommended value given. Alternatively, the inductor value can be computed as; 161
𝐿 =𝑉𝑖𝑛∗{𝑉𝑜𝑢𝑡−𝑉𝑖𝑛}
∆𝐼𝐿∗𝑓𝑠𝑤∗𝑉𝑜𝑢𝑡 (9)
162
Where 𝑉𝑖𝑛 is the typical input voltage; 𝑓𝑠𝑤 the minimum converter switching frequency while
163
∆𝐼𝐿 is the estimated inductor ripple current. 164
A suitable value of 𝑓𝑠𝑤 for the converter application without causing losses should be 165
selected. The inductor ripple current is not calculated but estimated in the range of 20% - 40% 166
of the output current as; 167
∆𝐼𝐿 = 0.2 ∗ 𝐼𝑜𝑢𝑡_𝑚𝑎𝑥∗ 𝑉𝑖𝑛
𝑉𝑜𝑢𝑡 (10)
168
Where 𝐼𝑜𝑢𝑡_𝑚𝑎𝑥 is the maximum output current for designated converter load. 169
Therefore, the ripple current is expressed as; 170
∆𝐼𝐿 =
𝑉𝑖𝑛_𝑚𝑖𝑛∗𝐷
𝑓𝑠𝑤∗𝐿 (11)
171
The ripple current should be reduced in the converter circuit because if it is left to penetrate 172
the converter load such as the battery, it can reduce battery life and degrade the operation of 173
the load [28]. Switching ripple filters can be used to prevent the switching ripple current from 174
reaching the load or grid [29]. 175
The maximum output current delivered by the converter is calculated as 176
𝐼𝑜𝑢𝑡_𝑚𝑎𝑥 = [𝐼𝐼𝐶_𝑚𝑖𝑛−∆𝐼𝐿
2 ] ∗ (1 − 𝐷) (12)
177
Another IC of higher switching current has to be selected if 𝐼𝑜𝑢𝑡_𝑚𝑎𝑥 of the selected IC is 179
below the targeted maximum current value of the application or the load. However, if 𝐼𝑜𝑢𝑡_𝑚𝑎𝑥
180
is slightly smaller than the required maximum load current, the inductor value can be increased 181
as longer as the increased inductance remains within the recommended range in the datasheet. 182
This is because increasing inductance reduces the ripple, thereby increasing the maximum 183
output current to the desired value. If calculated 𝐼𝑜𝑢𝑡_𝑚𝑎𝑥 is above the required maximum
184
output current, then the switching current 𝐼𝑠𝑤_𝑚𝑎𝑥 is calculated as:
185
𝐼𝑠𝑤_𝑚𝑎𝑥 = [ ∆𝐼𝐿
2 +
𝐼𝑜𝑢𝑡_𝑚𝑎𝑥
1−𝐷 ] (13)
186
To select the diode, the average forward current rating required is equal to 𝐼𝑜𝑢𝑡_𝑚𝑎𝑥 i.e. 187
𝐼𝐹 = 𝐼𝑜𝑢𝑡_𝑚𝑎𝑥 (14)
188
Where 𝐼𝐹 is the diode’s average forward current.
189
For reduced losses, Schottky diode types should be utilized. They also have higher peak 190
current than their rating and the higher peak current is not a problem. The power dissipated by 191
the diode is: 192
𝑃𝐹 = 𝐼𝐹∗ 𝑉𝐹 (15)
193
Where 𝑉𝐹 is diode’s Forward voltage. 194
The practical diodes have different threshold forward voltages (barrier potential) Vo beyond
195
which the diode is able to conduct large amount of current to the output terminal of the 196
converter. The value of Vo is normally 0.2V, 0.3V and 0.7V for Shockley, germanium and
197
silicon diodes respectively. A practical or real diode has a barrier potential Vo and a drop-in
198
forward resistance RF. Therefore the required voltage VF to operate the diode in forward biased
199
mode becomes: 200
𝑉𝐹 = 𝑉0+ 𝑅𝐹𝐼𝐹 (16) 201
Where 𝐼𝐹 is the forward current.
202
The next step is to select the capacitance. Due to peak current requirement of the converter 203
the input voltage has to be stabilized by a minimum value of input capacitor. The minimum 204
value of input capacitor Cin is always specified in the datasheet. Ceramic capacitors are
205
recommended because they have low Equivalent Series resistance (ESR). The capacitance Cin
206
can be increased if the input voltage has higher noise so that higher harmonics are suppressed 207
to avoid noise interference. Class 2 ceramic capacitors with dielectric material X7R should be 208
used for higher temperature applications because they operate in the temperature range of -209
a capacitance drift that may not exceed 15% of the nominal capacitance value at 25 oC in a 211
temperature range from −55 to 85 oC [30]. If lower temperature rated capacitors are used, the 212
capacitor would lose much of its capacitance due to temperature or DC bias. 213
During selection of output capacitor Cout, low ESR should be put into consideration to
214
reduce the ripple on the output voltage. Capacitors with similar qualities as Cin can be used as
215
Cout.
216
The recommended L and C values in the datasheet should be used if internal compensation 217
is used in the converter. If external compensation is used, the capacitance has to be adjusted 218
as: 219
𝐶𝑜𝑢𝑡_𝑚𝑖𝑛 =
𝐼𝑜𝑢𝑡_𝑚𝑎𝑥∗𝐷
𝑓𝑠𝑤∗∆𝑉𝑜𝑢𝑡 (17)
220
Where 𝐶𝑜𝑢𝑡_𝑚𝑖𝑛 is the minimum value of output capacitance; ∆𝑉𝑜𝑢𝑡 is the desired output 221
voltage ripple. 222
The additional ripple caused by ESR of 𝐶𝑜𝑢𝑡 is expressed as:
223
∆𝑉𝑜𝑢𝑡_𝐸𝑆𝑅 = [∆𝐼𝐿 2 +
𝐼𝑜𝑢𝑡_𝑚𝑎𝑥
1−𝐷 ] ∗ 𝐸𝑆𝑅 (18)
224
225
3.3. Incremental conductance algorithm 226
The IC method operates by incrementally comparing the ratio of derivative of conductance 227
with the instantaneous conductance. This is due to the fact that at maximum power point 228
(MPP), the derivative of power with respect to voltage (𝑑𝑃 𝑑𝑉⁄ ) is zero, i.e. 229
230
𝑑𝑃 𝑑𝑉 =
𝑑(𝑉𝐼)
𝑑𝑉 = 𝐼 + 𝑉 𝑑𝐼
𝑑𝑉 = 0 (19)
231
After re-arranging Eq. (15) 232 −𝐼 𝑉 = 𝑑𝐼 𝑑𝑉≅ ∆𝐼
∆𝑉 (20)
233
234
Where I and V are the TEG output current and voltage; I and V are the increments of TEG 235
output current and voltage, respectively. The basic rules for IC can be written as: 236
{
𝑑𝐼 𝑑𝑉⁄ = − 𝐼 𝑉⁄ , 𝐴𝑡 𝑀𝑃𝑃 𝑑𝐼
𝑑𝑉
⁄ > − 𝐼 𝑉⁄ , 𝐿𝑒𝑓𝑡 𝑜𝑓 𝑀𝑃𝑃 𝑑𝐼
𝑑𝑉
⁄ < − 𝐼 𝑉⁄ , 𝑅𝑖𝑔ℎ𝑡 𝑜𝑓 𝑀𝑃𝑃
(21)
237
It can be noticed that the MPP condition (𝑑𝐼 𝑑𝑉⁄ + 𝐼 𝑉⁄ = 0) rarely exists in practical 239
applications; hence another alternative yet effective way to utilize the IC was proposed by a 240
number of researchers [17]. The idea is to generate a marginal error Ɛ using the instantaneous 241
conductance and the incremental conductance. Mathematically, it can be written as: 242
𝑑𝐼 𝑑𝑉
⁄ + 𝐼 𝑉⁄ = Ɛ (22)
243
From Eq. (22), it can be seen that the value of is zero at MPP. Hence, based on the amount 244
of and using the rules of Eq. (21), the basic flow chart for IC method is shown in Fig. 3. 245
246
248
Fig. 3. Basic flow chart of incremental conductance (IC) method [31] 249
4. Results and discussion 250
251
The TEG-dc-dc converter model is tested with input temperature in the range of 150oC to 252
250oC. As indicated in the introduction, the aim of this work is to test the TEG output power 253
conditioning model used in the waste heat recovery in low carbon vehicles. Therefore, the 254
Initialization
Sense I (k) and V(k)
∆𝐼 = 𝐼(𝑘 − 1) − 𝐼(𝑘) ∆𝑉 = 𝑉(𝑘 − 1) − 𝑉(𝑘)
Yes
Yes
No
Yes
No No
Yes Yes
𝑑(𝑘)ฑ
∗
= 𝑑(𝑘)ฑ
∗
− ∅
V=0
∆𝐼 ∆𝑉+
𝐼(𝑘) 𝑉(𝑘)= 𝜖
∆𝐼 > 0 ∆𝐼
∆𝑉>= − 𝐼(𝑘) 𝑉(𝑘) = 𝜖
𝑑(𝑘)ฑ
∗
= 𝑑(𝑘)ฑ
∗
− ∅ 𝑑(𝑘)ฑ
∗
= 𝑑(𝑘)ฑ
∗
+ ∅ 𝑑(𝑘)ฑ
∗
= 𝑑(𝑘)ฑ
∗
+ ∅
∆𝐼 = 0
No No
𝐼(𝑘 − 1) = 𝐼(𝑘) 𝑉(𝑘 − 1) = 𝑉(𝑘)
chosen maximum temperature is based on the fact that in the gas oil or hybrid vehicles, the 255
average temperature of the exhaust manifold is over 250oC [32]. The input temperature test 256
scenarios for the model are shown in Fig. 4a and 4b for an increasing step and random signals 257
respectively at hot side temperature terminal. 258
[image:12.595.62.527.154.371.2]259
Fig. 4a. Increasing step hot side temperature 260
261
262
Fig. 4b. Increasing random hot side temperature 263
4.1 Results for the increasing step hot side temperature 264
The results in this section are based on the temperature input of an increasing step signal at 265
[image:12.595.71.521.415.638.2]temperature is maintained at a constant value of 30oC. The model has been operated in both 267
MPPT and direct PWM switching modes to compare their performances. 268
269
4.1.1 Converter parameters with the MPPT mode 270
During the MPPT mode the model is subjected to varying loads in the range of 0-14 in 271
order to find out the effect of different loads on the converter parameters including output 272
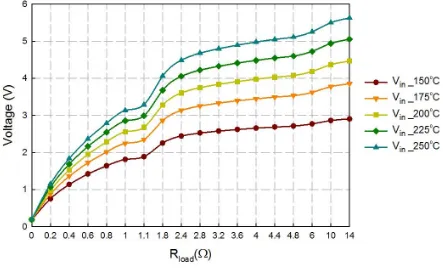
voltage, current and power. Fig. 5 and 6 show the input and output voltages of the converter at 273
different temperatures. It can be observed from both figures that the input as well as the output 274
voltage increases with the temperature. So the highest voltage is observed at hot side 275
temperature (Th) of 25oC. This is because as Th increases under a constant cold side temperature
276
Tc, the temperature difference at TEG increases and in turn the Seebeck effect which is
277
responsible for the generated voltage increases. 278
[image:13.595.74.517.362.632.2]279 280
Fig. 5. Variation of input voltage of the converter with load resistance 281
283
Fig. 6. Variation of output voltage of the converter with load resistance 284
285
It is also clear that as the converter load increases, the input and output voltages also rise. 286
However, a sharp increase in the voltage is observed from zero resistance up to 1.1 where the 287
rate of rise reduces. The rate of voltage rise again increases after Rload of 1.1 onwards until at
288
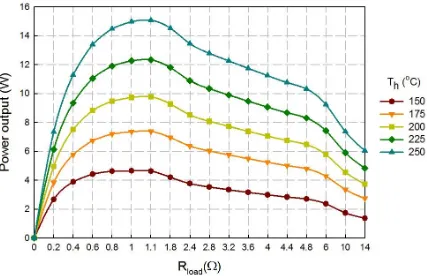
the about 10. The interpretation for this trend is better explained based on power curve for 289
TEG shown in Fig. 7. The graph of Rload against power output of the converter indicates that at
290
a converter load of 1.1, this is where the maximum power is obtained from the converter. 291
This load is referred to as the optimal load at which the total resistance of the converter 292
(including the ESR and other parasitic resistance of the components) is equal to the internal 293
resistance of the TEG, Rint. At this point, the load is said to be matched and it is advisable to
294
operate the converter at this load to harvest maximum power from the TEG-dc-dc converter 295
system. The increase in Th results in the corresponding increase in internal resistance of TEG
296
device leading to the rise in the optimum points due to increase in the value of matching load 297
resistance as seen in Fig. 7. Given the nature of the variation of the internal resistance of TEG, 298
300
Fig. 7. Variation of output power with converter with load resistance 301
302
Fig. 8 shows the I-V characteristic of the converter plotted with output power. It is seen 303
that as the converter load is increased, the output current reduces but the output voltage instead 304
increases. The current and voltage curves meet almost at the maximum power point i.e. at the 305
load matching point though the point of intersection is not the same for different hot side 306
temperature. The output current is maximum at zero load. In ideal circuit, the current is always 307
zero at zero load but in this case the current is maximum since there is some ESR resistance in 308
the output capacitor which is parallel to the output terminal. So, the current through the diode 309
takes the easiest path to the ground. 310
311
312
314
Fig. 8. Variations of output power, voltage and current at different hot side temperature with 315
load resistance 316
317
4. 1.2 Converter parameters with direct PWM signal 318
During the direct PWM mode the model is subjected to varying loads in the range of 0-40 319
in order to find out the effect of different loads on the converter parameters at different duty 320
cycle. Fig. 9 shows the output voltages of the converter at different temperature and duty cycle 321
D. As observed, higher output voltage is obtained at D = 10% and the least voltage is obtained 322
at D = 80%. During simulation, it is noticed that different ranges of D gives different output 323
voltages as indicated in Fig. 9. The maximum voltage is achieved at duty cycle range of 1 – 324
20%. Similarly the output power for the converter is shown in Fig. 10. The only observable 325
difference between the output voltage and output power is that the rate of increase of output 326
power with Th rises as D increases. Nevertheless in both cases the output voltage and power
327
increase linearly with temperature. The slopes for lines indicated in Fig. 10 are different from 328
each other whereby the highest slope is obtained at a duty cycle range of 1-20%. Similar trends 329
331
Fig. 9. Variation of converter output voltage with hot side temperature and duty cycle at Rload
332
= 1.1 333
334
Fig. 10. Variation of converter output power with hot side temperature and duty cycle at Rload
335
[image:17.595.80.511.439.696.2]Fig. 11 shows the output power at different values of D. For clarify, only three Th and duty
337
cycle values have been plotted. It is noted that for the same range of duty cycle, the matching 338
load is the same even for different temperatures. For example in Fig. 11 the matching load is 339
1.1 for Th of 150oC, 200oC and 250oC at a duty cycle of 10%. However, as soon as D is
340
changed, the matching load also changes. For example the matching load is 1.1, 1.8 and 341
2.4 for duty cycle values of 10%, 30% and 50% respectively at the same Th= 250oC.
342
Therefore, it can be concluded that in cases where a fixed load is connected to the converter, it 343
is not suitable to change the duty cycle even at different values of Th.
344
[image:18.595.75.514.270.521.2]345
Fig. 11. Comparison of output power at different values of D and hot side temperature 346
347
Fig. 12 shows MPPT and direct PWM model output powers. It has been observed that the 348
maximum power from the converter is obtained at the duty cycle of 10%. Also it is clear that 349
the output power from MPPT based converter model corresponds to the output power from 350
direct PWM mode at D =10% (as well as D in the range 1-20%). However, at higher values of 351
D, the power output reduces. Therefore, the MPPT can automatically extract maximum power 352
from the system without having to adjust any component from the MPPT algorithm as it is the 353
355
Fig. 12. Comparison between MPPT and direct PWM model output power. 356
357
Voltage conversion ratios (VCR) at D =0.1 for different converter loads are shown in Fig. 358
13. It is clearly observed that as the temperature increases, VCR reduces. However, VCR 359
reduces with the converter load. Therefore in this TEG-dc-dc converter system, if higher 360
voltage is required it is necessary to operate the TEG system at slightly lower hot side 361
temperature so that the lower TEG output voltage can be boosted to the desired voltage level 362
suitable for the application. 363
365
Fig. 13. Voltage conversion ratio at D=0.1 for different converter loads 366
367
4.2. Results for the increasing random hot side temperature 368
To further study the capability of dc-dc converter to stabilise the power output from TEG, 369
an increasing random hot side temperature in Fig. 4b is applied to the MPPT and direct PWM 370
based modes so that the behaviour of output parameters can be analysed. Note that the cold 371
side temperature is still maintained at 30oC. Fig. 14 shows the voltages and output current for 372
MPPT based model with a converter load Rload =1.1. It is clearly noted from this figure that
373
although the input temperature is random in nature, the output voltage resulting from the 374
converter is almost constant. Unlike the input random hot side temperature at the hot side 375
terminal, the output voltage and current have no several optimum points. Similar to the output 376
voltage, the input voltage to the converter is almost constant because it is filtered by the input 377
capacitor. Similarly, Fig. 15 shows the voltage and output current for MPPT based model at 378
Rload =4. The noticeable difference is that the voltage is increased to 4.6V peak for Rload =4
379
load as compared to 2.9V peak for Rload =1.1. Additionally output current is reduced to 1.2A
380
peak down from 2.6A peak. 381
383
Fig. 14. Voltages and output current for MPPT based model with Random increasing hot side 384
temperature at Rload =1.1
385
386
387
Fig. 15. Voltages and output current for MPPT based model with Random increasing hot side 388
temperature at Rload =4
389
390
Fig. 16 shows the voltages and output current for direct PWM based model with Random 391
increasing hot side temperature at Rload =1.1 and D =10%. As already noted the output voltage
[image:21.595.74.521.398.657.2]and current are more or less the same for direct PWM mode at D =0.1 as that of MPPT mode. 393
The difference cannot be clearly observed on the graph but rather on calculations. Therefore, 394
similar results are indicated in Fig. 16 as those in Fig. 15 since the converter load is the same. 395
However at a higher value D i.e. D = 0.5, the converter fails to weed out some of the peaks 396
from the input voltage. Hence the input voltage as well as output voltage and current are 397
observed with over shooting behaviour in Fig. 17, which may result into more converter losses. 398
It is therefore recommended to use a converter at a lower duty cycle to get a highly stabilised 399
output power. However, the best option is to make use of MPPT algorithm since it 400
automatically choose the MPP without the need to adjust the duty cycle. 401
[image:22.595.71.524.259.515.2]402
Fig. 16. Voltages and output current for direct PWM based model with Random increasing 403
hot side temperature at D =0.1 and Rload =4
404
406
Fig. 17. Voltage and output current for direct PWM based model with Random increasing hot 407
side temperature at D =0.5 and Rload =4
408
409
4.3. Effect of the converter components on the accuracy of the results 410
In this section, the cause of inaccuracy in converter output parameters are discussed. As 411
discussed earlier, the converter losses are mainly caused by parasitic resistance of the converter 412
components such as the ESR of input and output capacitors, resistance of the inductor, 413
sometimes the resistance of the switch and others. Fig. 18a and 18b indicate the residual voltage 414
that remains when the converter is not loaded i.e. at Rload =0. This represents the ripple voltage
415
caused by ESR of the output capacitor since the output capacitor is in parallel with Rload. In
416
Fig. 18a the ESR is kept at 1x10⁻⁹Ω while in Fig. 18b it is 1x10⁻⁶Ω. The voltage spikes on the 417
ripple can be observed to increase when the ESR is increase from1e-9 to 1x10⁻⁶Ω in Fig. 18b.
418
420
Fig. 18a. Ripple voltage at ESR = 1x10⁻⁹Ω 421
422
Fig. 18b. Ripple voltage at ESR = 1x10⁻⁶Ω 423
424
[image:24.595.40.537.88.725.2]The effect of ripple voltage can clearly be noticed if the load is increased from 0 to 1. 425
Fig. 19a and 19b show the ripple voltage for ESR of 1x10⁻⁶Ω and 1 respectively at R load =
426
1. In Fig. 19a, the spread of the ripple voltage on the output voltage is less than that of ESR 427
[image:24.595.65.523.417.624.2]the converter load is an audio equipment such as radio receiver, the ripple will be audible within 429
the output of the receiver and therefore cause noise interference. Therefore, the ESR has to be 430
reduced as low as possible, else the ripple should be filtered to avoid such unnecessary 431
occurrences within the TEG system. 432
433
[image:25.595.75.520.176.341.2]434
Fig. 19a. Ripple voltage at ESR = 1x10⁻⁶Ω when Rload = 1
435
436
437
Fig. 19b. Ripple voltage at ESR = 1Ω when Rload = 1Ω
438
439
The switching frequency also needs proper tuning as it affects the output parameters. Fig. 440
20 illustrates the effect of increasing the switching frequency from 5 kHz to 20 kHz on the 441
input and output voltages with overshooting. Although increasing Fsw reduces inductor ripple
442
current and output ripple voltage, it has the disadvantage of increasing the switching losses, 443
hence reducing efficiency. 444
[image:25.595.76.516.392.556.2]446
Fig. 20. Effect of increasing the switching frequency from 5 kHz to 20 kHz on the input and 447
output voltages 448
5. Conclusion 449
A dc-dc converter as a power conditioning device can provide a more stable power output 450
and facilitate the extraction of more power from the TEG system. But, for performance 451
improvement, maximum power point tracking (MPPT) algorithm can be applied to extract the 452
maximum power from TEG system. Therefore, this work has analysed the performance of a 453
TEG/dc-dc converter system and the parameters that influence the system’s performance in 454
different modes. A TEG/dc-dc boost converter model has been investigated in both MPPT and 455
direct pulse width modulation (PWM) modes subjected to a variable load. To further study the 456
ability of dc-dc converters to stabilise the power output from TEG system, increasing ramp and 457
random hot side temperature profiles have been applied to the MPPT and direct PWM based 458
modes so that the effect on output parameters i.e. voltage and power, are analysed. It has been 459
noted that even for the random temperature input to the TEG, the output voltage resulting from 460
the converter is almost constant. Therefore dc-dc converters are able to stabilise the power 461
is able to effectively extract maximum power from TEG compared to the direct PWM based 463
model. It has been established that for maximum power to be achieved easily, an optimum load 464
has to be connected to the system. Besides, proper selection of converter components is 465
necessary to avoid converter losses as well noise interferences on the load connected to 466
TEG/dc-dc converter system. 467 468 469 References 470
[1] X. Liu, C. Li, Y. D. Deng, and C. Q. Su, “An energy-harvesting system using 471
thermoelectric power generation for automotive application,” Int. J. Electr. Power 472
Energy Syst., vol. 67, pp. 510–516, 2015. 473
[2] M. Noori, S. Gardner, and O. Tatari, “Electric vehicle cost, emissions, and water 474
footprint in the United States: Development of a regional optimization model,” 475
Energy, vol. 89, pp. 610–625, 2015. 476
[3] K. Ebrahimi, G. F. Jones, and A. S. Fleischer, “A review of data center cooling 477
technology, operating conditions and the corresponding low-grade waste heat recovery 478
opportunities,” Renew. Sustain. Energy Rev., vol. 31, pp. 622–638, 2014. 479
[4] T. Seetawan, K. Singsoog, and S. Srichai, “Thermoelectric Energy Conversion of p-480
Ca3Co4O9/n-CaMnO3 Module,” in The 6th International Conference on Applied 481
Energy – ICAE2014, 2014, vol. 0, pp. 2–5. 482
[5] S. Twaha, J. Zhu, Y. Yan, and B. Li, “A comprehensive review of thermoelectric 483
technology: Materials, applications, modelling and performance improvement,” 484
Renew. Sustain. Energy Rev., vol. 65, pp. 698–726, 2016. 485
[6] M. M. Barry, K. A. Agbim, and M. K. Chyu, “Performance of a Thermoelectric 486
Device with Integrated Heat Exchangers,” J. Electron. Mater., vol. 44, no. 6, pp. 487
1394–1401, 2015. 488
[7] S. Leblanc, “Sustainable Materials and Technologies Thermoelectric generators : 489
Linking material properties and systems engineering for waste heat recovery 490
applications,” Susmat, vol. 1–2, pp. 26–35, 2014. 491
[8] J. Gao, Q. Du, M. Chen, B. Li, and D. Zhang, “Assessing the accuracy of 492
mathematical models used in thermoelectric simulation: Thermal influence of 493
insulated air zone and radiation heat,” Appl. Therm. Eng., vol. 82, pp. 162–169, 2015. 494
[9] U. Erturun and K. Mossi, “Thermoelectric devices with rotated and coaxial leg 495
configurations: Numerical analysis of performance,” Appl. Therm. Eng., vol. 85, pp. 496
304–312, 2015. 497
[10] U. Erturun, K. Erermis, and K. Mossi, “Effect of various leg geometries on thermo-498
mechanical and power generation performance of thermoelectric devices,” Appl. 499
Therm. Eng., vol. 73, no. 1, pp. 126–139, 2014. 500
[11] Y. Y. HUANG KUO, BO LI, SSENNOGA TWAHA, “Comprehensive Study on 501
Novel Concentric Cylindrical Thermoelectric Power Generation System,” Appl. 502
Therm. Eng., 2016. 503
[12] M. A. M. Ramli, S. Twaha, K. Ishaque, and Y. A. Al-Turki, “A review on maximum 504
power point tracking for photovoltaic systems with and without shading conditions,” 505
[13] A. M. Yusop, R. Mohamed, and A. Mohamed, “Inverse dynamic analysis type of 507
MPPT control strategy in a thermoelectric-solar hybrid energy harvesting system,” 508
Renew. Energy, vol. 86, pp. 682–692, 2016. 509
[14] A. Paraskevas and E. Koutroulis, “A simple maximum power point tracker for 510
thermoelectric generators,” Energy Convers. Manag., vol. 108, pp. 355–365, 2016. 511
[15] M. G. Molina, L. E. Juanicó, G. F. Rinalde, E. Taglialavore, and S. Gortari, “Design of 512
improved controller for thermoelectric generator used in distributed generation,” Int. J. 513
Hydrogen Energy, vol. 35, no. 11, pp. 5968–5973, 2010. 514
[16] Y. H. Liu, Y. H. Chiu, J. W. Huang, and S. C. Wang, “A novel maximum power point 515
tracker for thermoelectric generation system,” Renew. Energy, vol. 97, pp. 306–318, 516
2016. 517
[17] Y. H. Liu, Y. H. Chiu, J. W. Huang, S. C. Wang, S. Manikandan, S. C. Kaushik, M. G. 518
Molina, L. E. Juanicó, G. F. Rinalde, A. Paraskevas, E. Koutroulis, C. Yu, K. T. Chau, 519
A. M. Yusop, R. Mohamed, A. Mohamed, X. Zhang, and K. T. Chau, 520
“Thermodynamic studies and maximum power point tracking in thermoelectric 521
generator-thermoelectric cooler combined system,” Energy Convers. Manag., vol. 97, 522
no. 13, pp. 682–692, 2016. 523
[18] M. G. Molina, L. E. Juanicó, and G. F. Rinalde, “Design of innovative power 524
conditioning system for the grid integration of thermoelectric generators,” Int. J. 525
Hydrogen Energy, vol. 37, no. 13, pp. 10057–10063, 2012. 526
[19] S. Twaha, J. Zhu, Y. Yan, B. Li, and K. Huang, “Performance analysis of 527
thermoelectric generator using dc-dc converter with incremental conductance based 528
maximum power point tracking,” Energy Sustain. Dev., 2017. 529
[20] S. Yu, Q. Du, H. Diao, G. Shu, and K. Jiao, “Start-up modes of thermoelectric 530
generator based on vehicle exhaust waste heat recovery,” Appl. Energy, vol. 138, pp. 531
276–290, 2015. 532
[21] X. F. Zheng, C. X. Liu, Y. Y. Yan, and Q. Wang, “A review of thermoelectrics 533
research - Recent developments and potentials for sustainable and renewable energy 534
applications,” Renew. Sustain. Energy Rev., vol. 32, pp. 486–503, 2014. 535
[22] Y. S. H. Najjar and M. M. Kseibi, “Heat Transfer and Performance Analysis of 536
Thermoelectric Stoves,” Appl. Therm. Eng., vol. 102, pp. 1045–1058, 2016. 537
[23] Z. Niu, S. Yu, H. Diao, Q. Li, K. Jiao, Q. Du, H. Tian, and G. Shu, “Elucidating 538
modeling aspects of thermoelectric generator,” Int. J. Heat Mass Transf., vol. 85, pp. 539
12–32, 2015. 540
[24] S. Twaha, J. Zhu, Y. Yan, and B. Li, “A comprehensive review of thermoelectric 541
technology: Materials, applications, modelling and performance improvement,” 542
Renew. Sustain. Energy Rev., vol. 65, 2016. 543
[25] S. Lv, W. He, L. Wang, G. Li, J. Ji, H. Chen, and G. Zhang, “Design, fabrication and 544
feasibility analysis of a thermo-electric wearable helmet,” Appl. Therm. Eng., vol. 109, 545
pp. 138–146, 2016. 546
[26] M. Li, “Thermoelectric-Generator-Based DC-DC Conversion Network for Automotive 547
Applications,” KTH Information and Communication Technology, 2011. 548
[27] S. Twaha, J. Zhu, and Y. Yan, “Power conditioning of thermoelectric generated power 549
using dc-dc converters: a case study of a boost converter,” in International Heat 550
Transfer Symposium 2016, 2016. 551
[28] K. Uddin, A. D. Moore, A. Barai, and J. Marco, “The effects of high frequency current 552
ripple on electric vehicle battery performance,” Appl. Energy, vol. 178, pp. 142–154, 553
2016. 554
[29] M. Büyük, A. Tan, M. Tümay, and K. Ç. Bayindir, “Topologies, generalized designs, 555
inverter: A comprehensive review,” Renew. Sustain. Energy Rev., vol. 62, pp. 46–69, 557
2016. 558
[30] R. Mikkenie, O. Steigelmann, W. A. Groen, and J. E. Ten Elshof, “A quick method to 559
determine the capacitance characteristics of thin layer X5R multilayer capacitors,” J. 560
Eur. Ceram. Soc., vol. 32, no. 1, pp. 167–173, 2012. 561
[31] K. Ishaque, Z. Salam, and G. Lauss, “The performance of perturb and observe and 562
incremental conductance maximum power point tracking method under dynamic 563
weather conditions,” Appl. Energy, vol. 119, pp. 228–236, 2014. 564
[32] C. Yu and K. T. Chau, “Thermoelectric automotive waste heat energy recovery using 565
maximum power point tracking,” Energy Convers. Manag., vol. 50, no. 6, pp. 1506– 566
1512, 2009. 567
![Fig. 1. A Single p-n pair of the TEG module [22].](https://thumb-us.123doks.com/thumbv2/123dok_us/8589052.370749/4.595.172.434.73.273/fig-a-single-pair-of-the-teg-module.webp)


![Fig. 3. Basic flow chart of incremental conductance (IC) method [31]](https://thumb-us.123doks.com/thumbv2/123dok_us/8589052.370749/11.595.74.505.57.612/fig-basic-flow-chart-incremental-conductance-ic-method.webp)