REPRODUCTIVE PERFORMANCE LINKS TO FINE SCALE SPATIAL
PATTERNS OF FEMALE GREY SEAL RELATEDNESS.
Pomeroy, P.P.1, Worthington Wilmer, J2*, Amos W.2 & Twiss, S.D.3.
1
Sea Mammal Research Unit, University of St. Andrews, Gatty Marine Laboratory, St. Andrews, Fife KY16 8LB Scotland, UK.
2
Molecular Ecology Group, Dept. of Zoology, University of Cambridge, Downing St. Cambridge CB2 3EJ UK.
3
Spatial Ecology Group, University of Durham, Department of Biological Sciences, Science Laboratories, South Road, Durham DH1 3LE UK.
*
Current address: Dept. of Biology, Boston University, 5 Cummington St, Boston, MA USA.
Corresponding author: Patrick Pomeroy,
Sea Mammal Research Unit
Tel. +1334 462631 Fax +1334 462632
Summary
Fine scale spatial patterns of female relatedness throughout the established grey seal breeding colony
of North Rona, Scotland, were investigated by accurate mapping and spatially explicit analyses of a
large sample (n=262) of mothers using variation at 9 microsatellite DNA loci. Local spatial
autocorrelation analyses identified locations where seals were more highly related to the colony than
average. These locations were also areas where the more successful females bred, were occupied first
during each breeding season, were centrally placed locations of preferred habitat types and are likely
to be the locations which were the first to be colonized historically. Mothers occupying such sites
achieved higher than average pup growth rates, suggesting a founder fitness benefit.
Keywords: Grey seals, relatedness, fitness, reproduction, spatial patterns, GIS, habitat quality,
topography.
1. Introduction
In many species, the identity, social status and relatedness of the interactants determine the likely
outcome of behavioural encounters, which often have reproductive consequences (eg Chesser 1991,
Dunbar 1988, Whitehead & Dufault 1999). The importance of this “social context” for individual
breeding performance is most evident and widely studied in accessible species which form permanent,
or semi-permanent, groups (Chesser 1991, 1998, Pope 1992, Pusey & Packer 1995). However, social
context is also likely to be important for species that form short-lived aggregations. For example,
breeding success may be influenced by an individual’s location within a seasonal breeding aggregation
and the time at which it arrives and leaves the aggregation. It is important therefore to consider the
social structure of aggregations when examining individual success. The most tractable component of
this social structure is the spatio-temporal dispersion of related individuals within an aggregation.
Studies of the relationship between associative behaviour and breeding success and more particularly,
its long-term fitness consequences, in long-lived marine mammals pose particular problems because of
the temporal and geographic scales required to document complete life histories for individual
animals. Cetaceans are known to form matrilineal and fission-fusion groupings whose stability can
vary over large time scales (Amos et al. 1993, Norris et al. 1994, Slooten et al. 1993, Wells et al. 1987,
Whitehead et al. 1991). In contrast, many pinniped species form large, but short-lived, aggregations
during the annual pupping and mating season, usually at a few colonies that offer limited space for
breeding, and then disperse at sea for the remainder of the year (e.g. Baldi et al. 1996, Francis et al.
1991). In the U.K., adult grey seals (Halichoerus grypus) come ashore to breed in the autumn,
forming aggregations of tens to thousands of animals. Males (Twiss et al. 1994) and females (Pomeroy
et al. 1994) show a high degree of fidelity to particular breeding sites within a colony, and some
females return to breed at their birth location (Pomeroy et al. 2000a). The function of such fidelity
remains uncertain, but nevertheless presents the possibility of longer term stabilty in colony
composition and social structure, with a potential for local aggregations of closely related individuals
(Pomeroy et al. 2000a). Here, we used accurate mapping of seals within a Geographical Information
System (GIS) to identify spatial patterns of genetic relatedness within a breeding colony of grey seals.
The relationship of such patterns to habitat features was examined using a Digital Terrain model
(DTM) of the same site to obtain topographic habitat measures for these locations. Lastly, we
examined local variation in direct measures of breeding performance in a sub-sample of known
females and their offspring from a long term study of grey seal reproductive success. The fitness
2. Materials and Methods
Study site and colony history
The grey seal colony on the island of North Rona (59 06' N, 05 50' W) was established prior to the 1880s
and has been the subject of a study of reproductive behaviour for 40 years (Boyd & Laws, 1962). The
main seal breeding area is the Fianuis peninsula, measuring 1.0x0.3 km, which is divided into Study Area,
Fianuis South, and Fianuis North (Pomeroy et al. 1994). Approximately 95% of the 1200 pups produced
in a typical year are born between 19 September and 29 October (Harwood et al. 1991, Hiby et al. 1996,
SMRU unpublished).
Seal breeding behaviour.
Female grey seals become sexually mature aged 3-5 and their reproductive longevity can exceed 25 years
(Hewer 1960, Pomeroy et al. 1999). Males become socially mature at around 8 years old, although some
appear on the breeding colonies before this age, and have potential breeding spans of up to 15 years
(Worthington Wilmer et al. 2000, Twiss & Pomeroy, unpublished data). Individual females spend 18-20
days ashore, during which time they each bear and suckle one pup, come into oestrus towards the end of
lactation and are mated. Weaning occurs abruptly when the female returns to the sea (Hewer 1960).
Each breeding colony offers pupping sites of varying suitability, but females exhibit preferences for
particular habitat characteristics. These are low slope, low elevation and easy access to or from the sea
(Pomeroy et al. 1994, Pomeroy et al. 2000b, Twiss et al. in press). Known adult females on North Rona
return to within a median distance of55m from their previous pupping sites, irrespective of the number of
years between comparisons (Pomeroy et al. 1994); adult males show similar site fidelity (median distance
= 53m, Twiss et al., 1994). Whilst some dispersal from breeding sites occurs (Coulson & Hickling 1960,
Harwood, Anderson & Curry 1975, Pomeroy et al. 1994, Twiss pers. obs.) philopatry seems common, as
indicated through resightings (Pomeroy et al. 2000a) and by differences in microsatellite allele
frequencies between colonies (Allen et al. 1995). At colonies where seals breed inland, such as North
Rona, mothers tend to remain at their birth location (median daily movement of mothers occurs within a
10m radius of their pupping sites, Pomeroy & Aust, unpublished data) thereby adding stability to the
colony within a breeding season.
Sampling and mapping.
During the peak of the 1996 breeding season a remote biopsy punch was used to collect 2mm2 skin
the females present in the Study Area at the time and 50% of the females present in Fianuis North (Fig.
2). Our sample comprised 25% of the females breeding on North Rona in 1996. All sampling occurred
under HO licence and a prophylactic antibiotic (tetracycline) was applied to sampled animals. Samples
stored in DMSO were frozen at -20C until they were genotyped for 9 polymorphic microsatellites as
described earlier (Allen et al. 1995, Worthington Wilmer et al. 1999). Relatedness values (R) between
all pairs of females were calculated according to Queller & Goodnight (1989) using the program Kinship
(Goodnight software, http://bioc.rice.edu/Keck2.0/labs/).
The location of each sampled female was recorded on detailed fine grain maps of the breeding colony.
Maps incorporating a 10x10m grid were derived from digitised geo-rectified high resolution aerial
photographs (Twiss et al. 2000a, in press). Location was summarised as the central x,y coordinate of a
specific 10m grid cell, allowing calculation of Euclidean distances between the centres of any pair of grid
cells containing sampled females. Seals were sampled in 126 grid cells from Fianuis North to Study Area
representing the full range of topographies used by breeding female seals at this colony (Boyd & Laws
1962; Pomeroy et al. 1994). These same maps were used to make daily records of the location of every
seal, identified by sex and age. Estimates of the density of adult females in each 10m grid cell were
derived from these daily maps of seals' locations at the peak of the breeding season when sampling
occurred.
The locations of all sampled and mapped females were stored in a Geographical Information System
(GIS) together with a sub-meter resolution Digital Terrain Model (DTM) generated from the same
aerial photos of the colony (Mills et al. 1997, Twiss et al. 2000a) so that local female density and
topographic habitat descriptors could be included in analyses of factors likely to be important in
determining local indices of relatedness. Each 10m grid cell was characterised by the median elevation
and slope of its 2500 constituent 0.2m sub-cells. These values were used to generate cost-surface models
which provide, for each location, an index describing the relative distances from the locationto points of
access from the sea and to pools of water in the colony, whilst accounting for the difficulty of terrain
traversed in reaching water (Twiss et al. 2000b, in press). Sampling effort was calculated as the
proportion of females present in each 10m grid cell that had been sampled.
Testing for local kin aggregations – are neighbours highly related?
The aggregation of seals into two breeding areas separated by 400m (Study Area and Fianuis North)
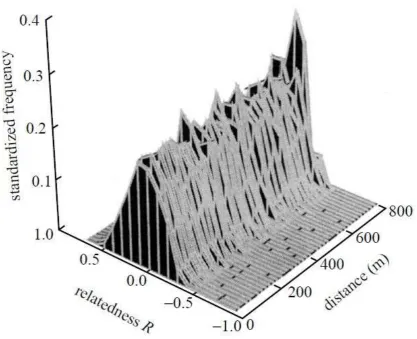
patterns of relatedness. To correct for this, we generated a joint distribution of R and d in which the
continuous distribution of R from -1 to +1 was split into 20 x 0.1 bins and d, ranging from 0-800m, was
split into 40 x 20m bins. Frequencies of observations for discrete R bins within each distance category
were standardised for the total number of observations over that specific distance category. These
standardised frequencies (in effect a proxy for probability) were then displayed as the corrected joint
distribution for evidence of distance effects on R.
Examining the spatial pattern of relatedness using Local Spatial Autocorrelation
This approach provides an index which describes the relative shift in local mean values compared to
the global mean: that is, it identifies locations where local data values tend to be higher, or lower than
the global average. Here, our aim was to produce a map indicating where local groups of seals are
more, or less, related to the colony as a whole when compared to our global (sample) average. Local
spatial autocorrelation (Gi*(d)) statistics (Getis & Ord 1992, Ord & Getis 1995, Sokal et al. 1998)
were calculated to identify locations of statistically significant nonstationarity ('hotspots') in the
mapped patterns of relatedness. At each sampled location, the average of all dyadic relatedness values
from females within a specified radius (10, 20, 30, 40 and 50m) of the focal sampling point was compared to the average relatedness of all sampled females. A positive Gi* statistic for a location
indicates clustering of high R values (most highly related seals) within the specified radius of that
location with respect to the global mean, while negative Gi* statistics indicate clustering of low values
(most unrelated seals). Standardized normal values for the local spatial autocorrelations were
calculated as ZGi*(d). The pattern of occurrence of locations with high or low ZGi*(d) statistics was
of particular interest. ZGi*(d) values were categorised using a ± 1sd cutoff to define locations with
high, medium or low ZGi*(d) values, enabling sampling locations to be mapped and visualised
according to their relatedness categories. Local spatial autocorrelation calculations were conducted
using the Rookcase Visual Basic routine (Sawada 1999).
The spatial pattern of relatedness and habitat characteristics
We investigated the ability of elevation, slope, distance to nearest access, distance to nearest pools, female
density and sampling intensity to account for variation in uncategorised, continuous ZGi*(d) values at
each location in the Study Area using stepwise multiple regression procedures. Variables were retained at
a critical level of p=0.05.
Reproductive performance and patterns of relatedness
locations categorized by ZGi*(d) values. Contrasts were between high ZGi*(d) locations (>1SD of
the Zgi*(30m) distribution) and all other locations. Maternal mass loss rate, estimated from the
difference in mass of mothers near the start and end of the lactation period was used as an index of
maternal performance (Pomeroy et al. 1999). The growth rate of pups (kg/d), estimated from the
difference in mass of pups near the start and end of the lactation period, taking account of mother's
identity, was used as an index of breeding performance for mothers and their pups weighed in 1996
and 1997. For the purposes of this analysis, locations sampled in 1997 were assumed to have the
same relatedness attributes as they had in 1996.
All statistical procedures were carried out in SPSS 8 & 9 or Minitab 11.
3. Results
Testing for local kin aggregations – are neighbours highly related?
Individual relatedness values ranged from -0.62 to +0.68. The overall average level of relatedness
between dyads in our sample was 0.00 0.18 (s.d., n=262, 33826 comparisons). Euclidean distances
separating dyads ranged from 0 to 799.9m. There was no evidence of a simple relationship between
relatedness values and the distance separating dyads, after the effects of the bimodal distance
distribution between sampling locations had been taken into account (Fig. 1). However this analysis
referred only to the distance separating two females, without any simultaneous consideration of how
dyad members were related spatially to other sampled seals.
Examining the spatial pattern of relatedness using Local Spatial Autocorrelation
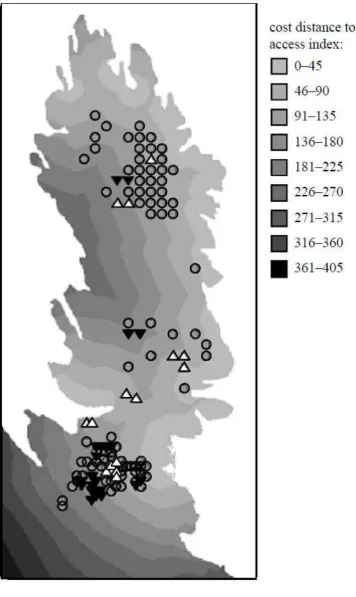
Local spatial autocorrelation analysis indicated that there were locations where on average, individuals
within a radius of 30m had higher than average relatedness to all others in the colony (high positive
ZGi* statistics, Fig 2). Such locations also tended to be aggregated at the centres of seal groupings
(Fig.2). Aggregations of locations expressing high ZGi* values became less evident at scales of 20m
to 10m and at 50m. Thus locations with higher than average relatedness to the colony as a whole were
most clustered when the radii of inclusion were 30m or 40m.
The spatial pattern of relatedness and habitat characteristics
Our null hypothesis was that there would be no relationship between local habitat quality and the
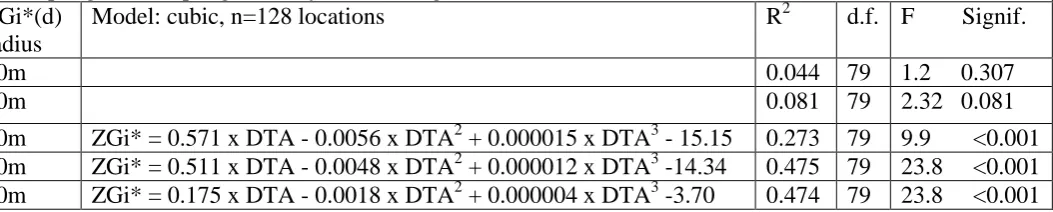
average relatedness of seals at a location in comparison to the colony as a whole (ZGi*). Regression
an important explanatory variable (Table 1). These relationships were best described by a cubic model
for the spatial scales of 30m, 40m and 50m (Table 1) and suggested that ZGi* increased up to
"distance to access" values of approximately 80 and then declined with increasing distance to access,
in an index ranging from 0 to 300 (where 0 = the access point where it meets the sea, and 300 = the
maximum access value obtained inland). Elevation was also a significant explanatory variable at each
scale considered, but is highly correlated (Spearman's rho 0.96, n= 86, p<0.001) with distance to
access at these locations and, in this context at least, has less obvious biological meaning than distance
to sea. Slope featured as a barely significant variable at the 50m scale. No other potential factors,
including local animal density and sampling intensity, were significant. These results imply that the
average relatedness of seals at a location in comparison to the colony as a whole was greatest at
specific low-lying locations that are some optimum distance from access to the sea on this colony.
Reproductive performance and patterns of relatedness
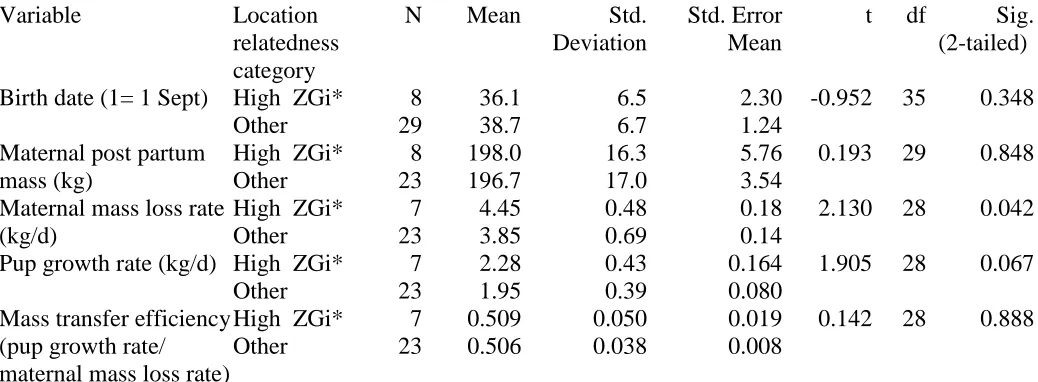
There were differences in individual reproductive performance data from known seals according to
their ZGi*(30m) category. Although maternal postpartum masses and parturition dates were not
significantly different, maternal mass loss rates were greater in locations of higher than average
relatedness to the colony as a whole compared to other locations (Table 2). Growth rates of pups
tended in a similar direction. There was no difference in growth rate of pups according to their sex
(males 2.04±0.50 (s.d.), females 1.88±0.40, t=1.005, d.f.=37, p>0.3). The efficiency of mass transfer
for mothers (estimated by pup daily growth rate / mothers daily mass loss) was the same in the two
area categories. Growth rates of pups were greater in locations of higher than average relatedness to
the colony as a whole compared to other locations when maternal mass loss rate and mother's identity
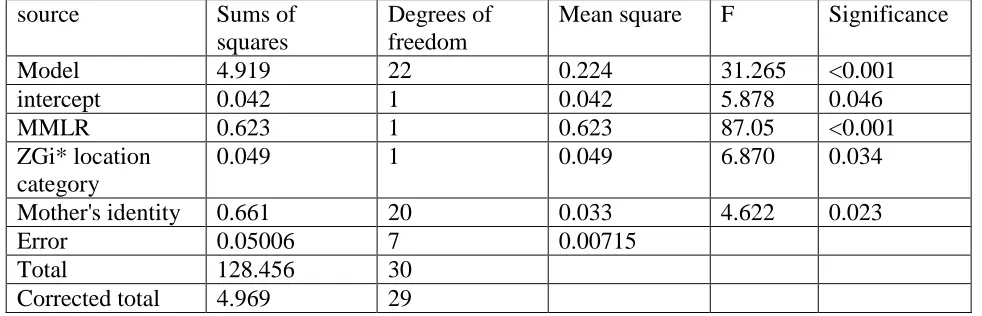
were taken into account in a General Linear Model (Table 3). The difference in growth rates of pups
between area categories remained when only the few 1996 data were examined, (2.59 0.30 (s.d.),
2.040.36, t = 2.48, d.f. = 15, p=0.026). There was no relationship between the ages of weighed
mothers and relatedness at their location, but the small aged sample (n=18) was biased towards older
females, while the larger relatedness sample (n=262) should be representative of the female age
structure in the colony.
4. Discussion
We found that: (i) locations where on average female grey seals were more related to the colony were
close to the main access points to the colony, but away from the access points themselves; (iii) pups in
areas of higher relatedness had higher growth rates than those elsewhere, but these could not be
explained by differences in maternal size or efficiency. While repeated, spatially accurate breeding
site fidelity and philopatry would be expected to generate local clumps of closely related kin (Pomeroy
et al. 2000a), the fine-scale genetic structuring within the breeding colony, uncovered using this
microsatellite approach, does not appear to be based solely on local direct kin association, as dyads of
females at these locations did not show higher relatedness than in colony-wide dyadic comparisons
(Fig.1). However, females occupying central breeding locations contribute more to the colony than
females elsewhere, probably through habitat-related fitness benefits. Females in centralareas showed
better intra-seasonal reproductive performance in producing bigger, faster-growing pups that are likely
to have higher than average survival (Hall et al. in press). This self-reinforcing feedback allows
certain genetic strains to become prevalent in the colony, as revealed by our snapshot of genetic
make-up of the colony (Fig. 2).
Locations containing seals with higher than average relatedness to the colony as a whole occurred in
core areas of the N. Rona colony. These locations occur close to access points, but avoid the busy
access points themselves which act as thoroughfares for animals arriving at or departing from the
colony (Anderson et al. 1975, Twiss et al. in press). Otherproximatebenefits for individuals occupying these prime locations include access to predictable resources. Breeding females require
relatively flat terrain with ready access to water (Twiss et al. 2000b, in press)). At North Rona there is
an excess of suitably flat terrain (hence no effect of slope), but access to water can be more limiting.
Availability of water is known to be an important factor in pupping site selection and standing pools
are a feature of areas which are occupied first (Pomeroy et al. 1994, Twiss et al. 2000b). Females that
breed early are larger than average, produce bigger pups and have fewer pupping failures than later
breeding females (Pomeroy et al. 1999). Mothers forming the two subsamples of weighed animals in
this analysis had similar pupping dates and partum masses, so the differences in growth rates of their
pups and maternal rates of mass loss according to relatedness area category could not be attributed
simply to either maternal size or to N. Rona’s temporal cline in maternal size (Pomeroy et al. 1999).
As the average efficiency of mass transfer was similar for the two area categories, the higher pup
growth rates and maternal mass loss rates recorded in the areas of higher than average relatedness to
the colony as a whole were likely the result of greater suckling rates. Maternal quality may vary
enough to account for these differences (Table 3) as documented elsewhere (Mellish et al. 1999,
Pomeroy et al. 1999), but it is also possible that harassment of mothers by transient males away from
lower growth rates recorded there (Boness et al. 1995).
In other species where mothers can affect daughter quality, for example, by passing on social status or
high quality territory, variation in female reproductive success is substantial and may even exceed that
of males (Hausfater et al. 1982, Leimar 1996). Female grey seals show substantial variance not only
in the number of pups they raise successfully, but in the size of pups they produce (Pomeroy et al.
1999). Our analyses indicate the locations where the more successful mothers breed. Furthermore,
these locations cluster in areas which are defined by unchanging topography and therefore are likely to
be used consistently by the higher quality mothers. This suggests that locations may be important
predictors of mate quality for males. Socially dominant males tend to occupy central positions (Twiss
et al. 1998). In a moderately polygynous species such as the grey seal, males may compete for prime
breeding locations, which on average will have the highest quality females.
At present it is not possible to distinguish between cause and effect for locality and breeding success.
The core areas occupied first during each breeding season are likely to be the areas which were the
first to be colonized historically (Anderson et al. 1975, Pomeroy et al. 1994, Pomeroy et al. 2000b,
Twiss et al. 2000b). Here, we have demonstrated for the first time that mothers breeding in central
parts of the colony are not only more successful in rearing pups within years, but are also the current
representatives of the more prevalent genotypes in the colony. These results suggest that as long as the
relationship between female quality, reproductive performance and habitat quality is robust, long term
spatial genetic structuring of the N. Rona colony should persist.
While this approach has demonstrated non-random distribution of relatedness among breeding female
grey seals at North Rona within a season, the inter-annual stability of this pattern is unknown. Colony
social structure elsewhere may be different and it remains to be seen whether similar colony structure
occurs where topographic variation and/or site-fidelity and philopatryis minimal (e.g. Boness &
James 1979). However, the ability to view the behaviour of individuals against a fine spatial scale
“genetic map” of a breeding colony provides a clearer view of the factors which may influence short
term individual choices and their ultimate fitness consequences. Grey seal breeding colonies
represent temporary aggregations, yet social structure is apparent. Even amongst temporary, or at
least semi-permanent, aggregations social structure is likely to be widespread. This is likely to be the
case where (i) individuals vary in competitive ability, (ii) resources vary in quality and (iii) variation
in resource quality within groups remains constant over time. This last feature is not restricted to
may similarly constitute a variable resource. These features are likely to be common amongst
temporary aggregations across species. Finally, as we have shown for grey seals, such structuring can
have fitness consequences.
This work was supported under NERC's Core strategic programme and through grants to W. Amos from NERC and the Royal Society. SDT was in receipt of a NERC postdoctoral fellowship and extension; JWW was in receipt of a NERC postdoctoral fellowship during this work. Thanks are due to all those involved in fieldwork, particularly S. Moss, M. Biuw and O. Kiely. C. Duck kindly provided access to aerial photographs. C.J. Thomas, J. Harwood, J. Matthiopoulos and 3 anonymous referees improved an earlier draft of the manuscript.
References:
Allen, P. J., W. Amos, P. P. Pomeroy, & S. D. Twiss. 1995. Microsatellite variation in grey seals
Halichoerus grypus shows evidence of genetic differentiation between two British breeding colonies.
Molecular Ecology, 4,653-662.
Amos, W., C. Schlötterer, & D. Tautz. 1993. Social structure of pilot whales revealed by analytical DNA typing. Science260, 670-672.
Anderson, S. S., R. W. Burton, & C. F. Summers. 1975. Behaviour of grey seals Halichoerus grypus
during a breeding season at North Rona. Journal of Zoology, 177,179-195.
Baldi, R., Campagna, C., Pedraza, S. & LeBoeuf, B.J. 1996. Social effects of space availability on the breeding behaviour of elephant seals in Patagonia. Animal Behaviour51, 717-724.
Boyd, J. M., & R. M. Laws. 1962. Observations on the grey seal (Halichoerus grypus) at North Rona in 1960. Proceedings of the Zoological Society of London, 164, 469-512.
Boness , D.J. & H. James. 1979. The reproductive behaviour of the grey seal (Halichoerus grypus) on Sable Island, Nova Scotia. Journal of Zoology, 188, 477-500.
Boness, D.J., D. Bowen & S.J. Iverson. 1995. Does male harassment of females contribute to reproductive synchrony in the grey seal by affecting maternal performance? Behavioural Ecology and Sociobiology36, 1-10.
Chesser, R.K. 1991. Gene diversity and female philopatry. Genetics127: 437-447.
Chesser, R.K. 1998. Relativity of behavioural interactions in socially structured populations. Journal of Mammalogy79(3):713-724.
Coulson, J. C., & G. Hickling. 1960. The Grey seals of the Farne Islands 1958-1959. Transactions of the Natural History Society of Northumberland, 13,151-178.
Francis, J.M. & Boness, D.J. 1991. The effect of thermoregulatory behaviour on the mating system of the Juan Fernandez fur seal, Arctocephalus philippi. Behaviour42, 104-126.
Getis, A. & J.K. Ord. 1992. The analysis of spatial association by use of distance statistics. Geographical Analysis24(3), 189-206.
Hall, A. J., B.J. McConnell & R.J. Barker. In press. Factors affecting first-year survival in grey seals and their implications for life history strategy. Journal of Animal Ecology.
Harwood, J., L. Hiby, D. Thompson, & A. Ward. 1991. Seal stocks in Great Britain. Surveys conducted between 1986 and 1989. NERC News, January,11-15.
Harwood, J., S.S. Anderson & M.G. Curry. 1975. Branded grey seals at the Monach Isles, Outer Hebrides. Journal of Zoology 180: 506-508.
Hausfater, G., J. Altman, S. Altman. 1982. Long-term consistency of dominance relations among female baboons (Papio cynocephalus). Science 217: 752-755.
Hewer, H. R. 1960. Behaviour of the grey seal (Halichoerus grypus Fab.) in the breeding season.
Mammalia, 24,400-421.
Hiby, A. R., C. D. Duck, D. Thompson, A. J. Hall, & J. Harwood. 1996. Seal Stocks in Great Britain.
NERC News, (January)20-22.
Leimar, O. 1996. Life-history analysis of the Trivers and Willard sex-ratio problem. Behav. Ecol.8, 395-400.
Mellish, J.E., S. Iverson & D. Bowen. 1999. Variation in milk production and lactation performance in grey seals and consequences for pup growth and weaning characteristics. Physiological and Biochemical Zoology72(6), 677-690.
Mills, J. P., I. Newton & S.D. Twiss. 1997. Photogrammetry from archived digital imagery for seal monitoring. Photogrammetric Record15(89): 715-724.
Norris K.S., B. Wrsig, R.S. Wells, & M. Wrsig. 1994. The Hawaiian spinner dolphin. Univ. of California Press, Los Angeles.
Ord, J.K. & A. Getis. 1995. Local spatial autocorrelation statistics: distributional issues and an application. Geographical Analysis27(4), 287-305.
Pomeroy, P. P., S. S. Anderson, S. D. Twiss, & B. J. McConnell. 1994. Dispersion and site fidelity of breeding female grey seals (Halichoerus grypus) on North Rona, Scotland. Journal of Zoology, 233,
429-448.
Pomeroy, P. P., M. A. Fedak, S. S. Anderson, & P. Rothery. 1999. Consequences of maternal size for reproductive expenditure and pupping success of grey seals at North Rona, Scotland. Journal of Animal Ecology, 68, 235-253.
Pomeroy, P. P., S. D. Twiss, & C.D. Duck. 2000b. Expansion of a grey seal (Halichoerus grypus) breeding colony: changes in pupping site use at the Isle of May, Scotland. Journal of Zoology, 250, 1-12.
Pope, T.R. 1992. The influence of dispersal patterns and mating system on genetic differentiation within and between populations of the red howler monkey (Alouatta seniculus). Evolution46, 1112-1128,
Pusey, A.E. & Packer, C. 1995. The ecology of relationships. In Behavioural ecology 4th edition (ed. J.Krebs & N. B. Davies) pp 254-283. Oxford: Blackwell Scientific Publications.
Queller, D. C. & Goodnight, K. F. 1989 Estimating relatedness using genetic markers. Evolution43, 258-275.
Sawada, M. 1999. Rookcase: An Excel 97/2000 Visual Basic (VB) Add-In for exploring global and local spatial autocorrelation. Bulletin of the Ecological Society of America, 80(4), 231-234.
Slooten, E., S.M. Dawson & H. Whitehead. 1993. Associations among photographically identified Hector's dolphins. Can. J. Zool.71, 2311-2318.
Sokal, R.R., N.L. Oden & B.A. Thompson. 1998. Local spatial autocorrelation in a biological variables. Biological Journal of the Linnean Society65, 41-62.
Twiss, S. D., S.S. Anderson & P. Monaghan. 1998. Limited intra-specific variation in male grey seal (Halichoerus grypus) dominance relationships in relation to variation in male mating success and female availability. Journal of Zoology246, 259-267.
Twiss, S. D., P. P. Pomeroy, C. J. Thomas, & J. P. Mills. 2000a. Remote estimation of grey seal length, width and body mass from aerial photography. Photogrammetric Engineering and Remote Sensing66(7) 859-866.
Twiss, S. D., A. Caudron, P. P. Pomeroy, C. J. Thomas, & J. P. Mills. 2000b. Fine scale topographical correlates of behavioural investment in offspring by female grey seals. Animal Behaviour. 59(2), 327-338
Twiss, S. D., P. P. Pomeroy, & S. S. Anderson. 1994. Dispersion and site fidelity of breeding male grey seals (Halichoerus grypus) on North Rona, Scotland. Journal of Zoology, 233,683-693.
Twiss S.D., C.J. Thomas & P.P. Pomeroy. (in press). Topographic spatial characterisation of grey seal
Halichoerus grypus breeding habitat at a seal’s perceptual spatial grain. Ecography
Wells, R.S., M.D. Scott & A.B. Irvine. 1987. The social structure of free ranging dolphins. In
Current Mammalogy (ed. H.H. Genoways) Vol. 1, pp 247-305. Plenum, New York.
Whitehead, H., S. Waters & T. Lyrholm. 1991. Social organization in female sperm whales and their offspring: Constant companions and casual acquaintances. Behavioural Ecology and Sociobiology29, 385-389.
Whitehead, H. & S. Dufault. 1999. Techniques for analyzing vertebrate social structure using
Worthington Wilmer, J., P. Allen, P.P. Pomeroy, S.D. Twiss, & W. Amos. 1999. Where have all the fathers gone? An extensive microsatellite analysis of paternity in the grey seal (Halichoerus grypus).
Molecular Ecology 8, 1417-1429.
Figure legends.
Figure 1. Surface plot of standardised frequencies of occurrence for the joint distribution of
relatedness, R and distance (m) separating pairs of female grey seals sampled on North Rona in 1996.
Figure 2. Categorised local spatial autocorrelation ZGi*(d) statistics for locations where seals were
sampled in 1996, displayed on a surface of ‘cost-distance to access’ map of Fianuis, North Rona. Note
that sampled locations are indicative of seal distribution on Fianuis. A positive Gi* statistic indicates
clustering of high relatedness (R) values of females within a radius of (d)m from a location with
respect to the global mean, while negative Gi* statistics indicate clustering of low values. The radius
(d) for this plot was 30m. Standardised Gi*(d) values were categorised for visualisation using a 1 S.D.
cutoff, such that locations with similarly high, average and low R values compared to the colony as a
Table 1. Regression models of variation in local spatial autocorrelation statistics ZGi*(d) for relatedness of female grey seals at locations on North Rona, 1996. Linear, quadratic and cubic models of the relationship between ZGi* and distance to nearest access (DTA, Twiss et al. 2000) as the single important explanatory variable were compared. There was no significant relationship between ZGi*(d) and DTA at 10 or 20m scales for linear, quadratic or cubic models. For the 30, 40 and 50m cases, the cubic model showed a significant reduction in the error sum of squares compared to the quadratic and linear models. Elevation was also a significant predictor variable, but was highly correlated with distance to access. Slope, female density at time of sampling and sampling intensity were not significant.
ZGi*(d) radius
Model: cubic, n=128 locations R2 d.f. F Signif.
10m 0.044 79 1.2 0.307
20m 0.081 79 2.32 0.081
Table 2. Birth date, mass and mass change data for mothers and pups on North Rona according to pupping location, categorised as either: High Zgi* - locations with higher than average (>1S.D. of the ZGi*
distribution at 30m scale) relatedness to the colony as a whole; or Other - all other locations where seals were sampled. Comparisons among groups use 2-tailed t-tests.
Variable Location relatedness category
N Mean Std. Deviation
Std. Error Mean
t df Sig. (2-tailed)
Birth date (1= 1 Sept)
High ZGi* 8 36.1 6.5 2.30 -0.952 35 0.348 Other 29 38.7 6.7 1.24
Maternal post partum mass (kg)
High ZGi* 8 198.0 16.3 5.76 0.193 29 0.848 Other 23 196.7 17.0 3.54
Maternal mass loss rate (kg/d)
High ZGi* 7 4.45 0.48 0.18 2.130 28 0.042 Other 23 3.85 0.69 0.14
Pup growth rate (kg/d)
High ZGi* 7 2.28 0.43 0.164 1.905 28 0.067 Other 23 1.95 0.39 0.080
Mass transfer efficiency (pup growth rate/ maternal mass loss rate)
Table 3. General linear model of pup growth rate (kg/d) according to maternal mass loss rate (MMLR, kg/d), ZGi* location category (locations with higher than average (>1S.D. of the ZGi* distribution at 30m scale) relatedness to the colony as a whole, or other) and mother's identity for grey seals at North Rona in 1996 and 1997. Adjusted r2 = 0.958. Birth date (F=0.041, p>0.8) and the interaction term between mother's identity and ZGi* location category (F=1.35, p>0.35) were dropped from the model.
source Sums of squares
Degrees of freedom
Mean square F Significance
Model 4.919 22 0.224 31.265 <0.001 intercept 0.042 1 0.042 5.878 0.046 MMLR 0.623 1 0.623 87.05 <0.001 ZGi* location
category
0.049 1 0.049 6.870 0.034
Mother's identity 0.661 20 0.033 4.622 0.023 Error 0.05006 7 0.00715