Influence of Reaction Time and Synthesis Temperature on Physical
Properties of ZnO Nanoparticles Synthesized by Hydrothermal
Method
H.S. Wasly*1, M.S. Abd El-Sadek2,3, Mohamed Henini4
1Mining, Metallurgy and Petroleum Eng. Dep., Faculty of Engineering, Al-Azhar University,
Qena- 83513, Egypt.
2Nanomaterials Lab., Physics Dep., Faculty of Science, South Valley University,
Qena-83523, Egypt.
3Egypt Nanotechnology Center (EGNC), Cairo University, El-Sheikh Zayed Campus,
Egypt.
4School of Physics and Astronomy, Nottingham Nanotechnology and Nanoscience Center,
University of Nottingham, Nottingham NG7 2RD, United Kingdom
ABSTRACT
Influence of synthesis temperature and reaction time on structural and optical properties of ZnO nanoparticles synthesized by hydrothermal method was investigated using X-ray diffraction (XRD), high resolution transmission electron microscopy (HR-TEM), energy-dispersive X-ray (EDX), Fourier transform infrared spectroscopy (FT-IR), and UV-visible and fluorescence spectroscopy. The XRD pattern and HR-TEM images confirmed the presence of crystalline hexagonal wurtzite ZnO nanoparticles with average crystallite size in the range 30-40 nm. Their energy gap determined by fluorescence was found to depend on the synthesis temperature and reaction time with values in the range 2.90-3.78 eV. Thermal analysis, thermogravimetric (TG) and the differential scanning calorimetry(DSC) were used to study the thermal reactions and weight loss with heat of the prepared ZnO nanoparticles.
Keywords: ZnO nanoparticles; Hydrothermal Synthesis; Reaction time; Energy gap, HR-TEM, Optical properties
* Corresponding author: dhsw73@gmail.com
Manuscript Click here to download Manuscript manuscript-.docx
Click here to view linked References
1. Introduction
Metal oxide nanoparticles, due to their distinctive properties (optical, electrical, and magnetic), are applied in many areas including energy storage, sensors, optics, coatings, piezoelectric, and biotechnology [1-3]. Zinc oxide nanoparticles are an important class of metal oxide materials, because of their unique physical, electrical, chemical, optical, biological and medical properties. They are suitable for many applications such as solar cells, ultraviolet photodiodes, catalyst, semiconductors, gas sensors, piezoelectric devices, coatings, antibacterial and medical [4-7]. In addition, due to their resistance to the UV-radiation [8] and antimicrobial properties [9] they are used in transparent UV-protection films and as a UV-filter in sunscreens, and in the process of canning food lining, respectively. Recently, ZnO nanoparticles achieved an effective presence in biomedical and agricultural soils applications [10-12].
Many methods have been used to synthesize various ZnO nanostructures, which include physical vapor deposition, chemical vapor deposition, thermal decomposition and thermal evaporation process [13-15]. These techniques are complex, have a high cost, and require high temperatures. Hydrothermal method is considered as a distinctive alternative method in the fabrication of nanomaterials because it is a process which involves low temperature, simple equipment usage, low cost, and is environmental friendly. Additionally, it has a good control on particles size, structure and morphology of the products. It has been applied to prepare ZnO nanoparticles and other luminescent materials [16-20].
The aim of the present work was to prepare ZnO nanoparticles using hydrothermal method and study the influence of reaction time and reaction temperature on their properties. The structure and morphology of the obtained nanostructure product was characterized by using several analysis techniques.
2. Experimental
2.1 Materials
In ZnO nanoparticles synthesis, Zinc acetate di-hydrate [Zn(Ch3COO)2.2H2O 98%] and sodium hydroxide [NaOH 98%] were used. All the commercially purchased materials were used as received without further purification.
2.2 ZnO nanoparticles synthesis
Hydrothermal technique has the ability to prepare nanomaterials with high quality and low cost. In this work, the ZnO nanoparticles were synthesized by a modified hydrothermal method [1,21-22]. The reactions involved in the synthesis process of ZnO nanoparticles can be described through the following [1]:
Zn(CH3COO)2.2H2O + 2NaOH → Zn(OH)2 + 2CH3COONa +2H2O (1)
Zn(OH)2 + 2H2O = Zn2+ + 2OH- + 2H2O = [Zn(OH)4]2 (2)
[Zn(OH)4]2–↔ ZnO2-2 +2H2O (3)
ZnO2-2 +2H2 O ↔ZnO + 2OH− (4)
alkali solution effect. Zn(OH)2 precipitates with the hydrothermal conditions dissolves into Zn2+ and OH− ions (equation 2). When Zn2+ and OH− ions formation exceeds a critical value, which is necessary for the formation of ZnO crystals (supersaturation degree) (equation 3), ZnO begins to nucleate and the crystal growth begins (equation 4) [1,21-22].
In typical synthesis, 0.1 Mole (M) of Zinc acetate di-hydrate was dissolved in distilled water and 0.4 M of sodium hydroxide was dissolved in distilled water. The NaOH solution was poured at a slow rate into the Zinc acetate solution at 75oC under continuous stirring. After 2 hours of stirring the mixture was moved to a Teflon lined stainless steel autoclave and maintained at a temperature of 150 oC for 8 hrs. The autoclave was allowed to cool to room temperature naturally. After the completion of the reaction, the produced white precipitate was separated by centrifuge and washed many times by ethanol and distilled water, and then dried in air in an oven at 75 oC for 6 hrs. The same procedure was followed for the preparation of samples at 12, 16, 20 and 24 hrs. To study the effect of reaction temperature, the autoclave was maintained at different temperatures 100, 125, 175, and 200 oC for 12 hrs.
2.3 Characterization
X-ray diffraction patterns were recorded for the prepared nanoparticles to determine the crystal phase and estimate the crystallite size. The crystalline structures of the synthesized powders were analyzed by X-ray diffractometry (X’Pert PRO, PANalytical, Netherlands) using Cu-Kα radiation in the angular region of (20o - 70o) at 40 kV. The crystallite size (D) and the lattice strain were estimated using the Scherer's equation and Williamson-Hall method. The elemental analysis was performed by energy-dispersive X-ray (EDX) instrument (JEOL, JEMA 2100-Japan) at 10 kV. The morphology of the obtained ZnO nanoparticles was characterized with high resolution transmission electron microscope (HR-TEM), (JEOL, JEMA 2100-Japan), performed at 200 kV. Fourier transform infra-red (FTIR) spectra was carried out using (FTIR Perkin Elmer-Spectrum One) at range 400-4000 cm-1 with a resolution of 4 cm-1 at room temperature. For the optical measurements, JASCO 6700 UV-VIS-NIR spectrophotometer was used in UV–visible absorption analysis. Fluorescence measurements were taken under ambient conditions and at room temperature by using JASCO 8600 fluorescence spectrophotometer (λexc=365 nm). Thermal analysis was done using LINSEIS STA PT-1000 to study the thermal stability of ZnO nanoparticles. Approximately, 25 mg of the samples were used and the heating rate was 10 °C/min up to 800 °C.
3. Results and Discussion
3.1 X-ray diffraction (XRD) studies
and intense peaks observed from XRD patterns (Figs.1a, b) confirm that the prepared ZnO nanoparticles is of high crystalline nature with hexagonal phase.
The average crystallite size, D, has been obtained from the main diffraction peak along the (101) plane using the Debye–Scherrer formula [1] as follows:
D = 0.9 λ /β cosθ (5)
where, λ is the wavelength of X-ray used (1.54060 Å), β is the angular peak width at half maximum in radians and θ is Bragg’s diffraction angle. From the recorded XRD pattern, the synthesized ZnO nanoparticles are listed as wurtzite hexagonal closely packed structure and its lattice constants a and c were determined from the following equation using the interplanar distance d and (hkl) values of the XRD profile [23],
(6)
2 2 2 2 2 3 4 2 1 c l a l hk h d
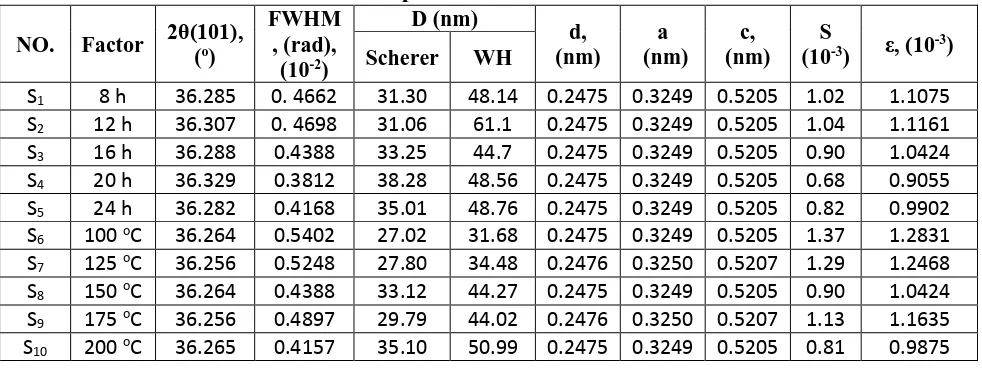
Table 1 shows the calculated lattice parameters, which are matched to those available in standard JCPDS data (No. 36-1451). To estimate the crystallite size and the lattice strain, an inspection of the shape of the diffraction peaks was performed using Williamson-Hall (WH) method (Equation 7). WH calculations procedure is carried out for every peak obtained in the XRD spectra of the ZnO nanoparticles. The full width at half maximum (FWHM), β, is related to the crystallite size, D, and the strain, ε, by equation 7:
β* =d*ε + 1/D (7)
where β*= β cos θ /λ and d*= 4 sinθ/λ; θ is the Bragg angle and λ is the wavelength used. From Eq. (7), the intercept and the slope of the plot of β*against d* give 1/D and the strain [24-25], respectively. Table 1 shows crystallite size values for the prepared samples estimated by Scherer and Williamson-Hall methods. From the XRD calculations, it is obvious that the average crystallite size slightly increases with the increase of the reaction time and synthesis temperature (see Fig. 2a, b). This may be due to increasing of nucleation and growth rate of nanoparticles [23]. From table 1, it is clear that the crystallite size calculated from XRD data using Debye–Scherrer equation is smaller than crystallite size determined from Williamson–Hall method. This may be due to the fact that the Scherrer method actually measures the coherence length of the X-rays, any crystal imperfections will cause the calculated size to be smaller than the true size but in WH method the microstrain effect was taken into consideration [26].
The dislocation density (concentration of defects and vacancies in the crystal), S, can be determined from the following equation by using the crystallite size (D) [23]:
S = 1/D2 (8)
From Table 1, it can be seen that S changes with different values of time and temperature, which means that the lattice imperfection decreases with particle size. Also, the micro-strain of the samples changes with time and temperature, which may be attributed to the change in microstructure, size, shape and defects of the particles [27].
Figure 3 (a, b) shows the EDX spectrum of ZnO nanoparticles synthesized by hydrothermal method with different reaction times and different temperatures. Similar spectra were obtained for all the prepared samples, only two spectra are shown here (S1 and S8). The strong peaks shown in the spectra, referred to zinc and oxygen elements, indicate that the synthesized nanoparticles have Zn and O elements only.
3.3. Transmission electron microscope analysis
HR-TEM was carried out to investigate the shape and size of the synthesized ZnO nanoparticles. Figure 4 (S1-S10) shows the HR-TEM images of prepared ZnO nanoparticles with different reaction times 8, 12, 16, 20 and 24 hrs and reaction temperatures 100, 125, 150, 175, and 200 oC. The reaction time and synthesis temperature affect the shape and size of the obtained ZnO nanoparticles. The particles with spherical-like shape were observed in S1 and S6 only. With increasing the reaction time and temperature spherical-like and rods shapes of ZnO nanoparticles were obtained due to the increase of the growth rate. As the reaction time and temperature increased, nearly all the ZnO nanoparticles appeared in clusters of nanorods shape due to smaller nanoparticles coalescing and forming larger particles, i.e. clusters. From the HR-TEM images the average size of the ZnO nanoparticles is in the range of 30-40 nm, which agree with the size determined from XRD data. 3.4 Fourier transform infra-red (FT-IR) analysis
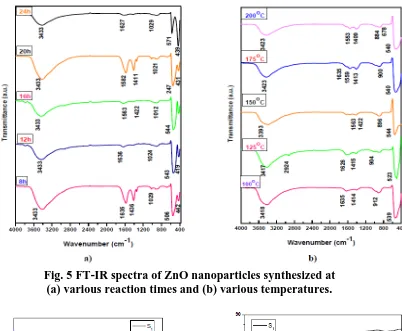
Figures 5 (a) and 5 (b) display results of FT-IR analysis for prepared ZnO nanoparticles at different times and temperatures, respectively. A group of absorption peaks observed in the range of 4,000 to 400 cm-1 represents the vibration modes of contaminations such as hydroxyl, carboxyl found in the prepared nanoparticles. The absorption bands at (3433-3413 cm-1) represent O–H stretching vibration. Peaks recorded between (1,626 and 1,581 cm-1) are probably from C=O band. The absorption peaks at (1,410–1,435 cm-1) represent the carboxylate group (COO-). The peaks around (1,021–1,028 cm-1)confirm the stretching vibration of C–O attributed to zinc acetate. In the infra-red region, characteristic Zn–O stretching mode was found between (418 and 571 cm-1). The difference in wavenumber may be attributed to the difference in particle sizes of prepared samples [7,23,28-29].
3.5 Optical properties of ZnO nanoparticles
Figures 6 (a) and 6 (b) show the optical absorption and transmittance spectra of the prepared samples at near normal incidence over a spectral ranging between 200 and 800 nm for different times and temperatures, respectively. The direct optical band gap with direct transition can be calculated using the relation:
αhγ = B (hγ - Eg)1/2 (9)
where hγ is the photon energy and B is a constant that depends on the transition probability, α is the absorption coefficient and Eg is the optical band gap. As shown in
Figure 7 (a, b) the energy gap (Eg) can be estimated from the plot hγ against (αhγ)2.
The values of Eg are in the range (2.90-3.62 eV) and depend the reaction times and
reaction temperatures (Table 2). These obtained values are different from that of the bulk ZnO (3.37eV). This blue shift may be attributed to quantum confinement effects in the prepared zinc oxide samples [20, 23].
From Fig.7, it can be noticed that with increasing the reaction time and reaction temperature, the band gap value decreases due to the increase of the crystallite size. This confirms that the above behavior may be due to increasing of nucleation and growth rate of nanoparticles [23].
3.6 Fluorescence Spectra of ZnO Nanoparticles
Figures 8(a) and 8(b) show fluorescence spectra of ZnO nanoparticles synthesized under different reaction times and temperatures, respectively. Each curve reveals that the PL intensity decreases with reaction times and temperatures. The observed dominant narrow UV emission band peak at 417 nm originates from the near-band-edge transition and its intensity decreases with increasing particle size of ZnO nanoparticles. The tail-band violet emission at 445 nm is attributed to the presence of zinc interstitials (Zni). Exciton recombination between the electrons at the zinc interstitials and valence band holes leads to this violet emission. This type of violet emission band was also observed by others [23,30]. The broad-band green emission at 530 nm is assigned to the recombination of electrons trapped at vacancy defects [31-33]. The fluorescence spectrum confirms that the type of emissions from the ZnO nanoparticles, whether UV (or) violet is affected by the time and temperature of the reaction. In addition, the violet and green bands confirm that the samples contain ZnO nanoparticles [30,34-35].
3.7 Thermal analysis spectra
Figure 9 (a, b) shows the thermogravimetric (TG) analysis of ZnO nanoparticles.
From the figure, it can be seen that there is no significant weight loss observed for
all samples (approximately 10%). This may be due to the evaporation of water and the removal and decomposition of organic groups found in the samples during the hydrothermally synthesis [36-39]. Furthermore, no significant loss of weight was observed from the samples above 750 oC.
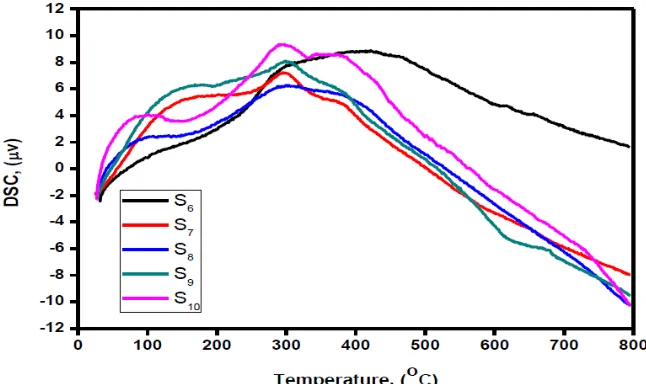
Figures 10(a) and 10(b) show the differential scanning calorimetry (DSC) of ZnO nanoparticles under different reaction times and temperatures, respectively. Two peaks are observed, the first one occurs at around 150 oC and is weak. This peak can be attributed to an activation energy involving an endothermic reaction. The second peak around 400 oC is a broad, which suggests an exothermic reaction that may be due to the burn-out of organic composition. It is worth pointing out that both peaks are due to change of phases at those temperatures [36-39].
4. Conclusions
confirm that the type of emissions from the ZnO nanoparticles, is affected by the time and temperature of the reaction. TG analysis of the ZnO nanoparticles showed that no significant loss of weight was observed above 750 oC for all prepared samples. DSC of ZnO samples under different times and temperatures indicates endothermic reactions and exothermic reactions which are due to change of phases at those temperatures.
ACKNOWLEDGEMENT
The authors would like to express their gratitude to Al-Azhar University and South Valley University for providing administrative and technical support.
References
1. A.M.O. Dalia, A.M. Mustafa, Synthesis and Characterization of Zinc Oxide Nanoparticles using Zinc Acetate Dihydrate and Soium Hydroxide, Journal of Nanoscience and Nanoengineering 1 (2015) 248-251.
2. A. Benazir, K. Gomathi, S. Aram. Structural and Optical Properties of Zn1-xNixO Nanoparticles Synthesized by Co-precipitation Method, J. Environ. Nanotechnol. 6 (2017) 39-43.
3. K.P. Kamal, G. Dambaru, A. Venugopal, V.M.A. Mohan, P. Ganngam, L.P. Narasimham, K.S. Hrushi, B.P. Brahma, Green Synthesized Zinc Oxide (ZnO) Nanoparticles Induce Oxidative Stress and DNA Damage in Lathyrus sativus L. Root Bioassay System, Antioxidants 6 (2017) 35-51.
4. A.K. Barve, S.M. Gadegone, M.R. Lanjewar, R.b. Lanjewar, Synthesis of ZnO nanomaterial by Precipitation Method and its Characterization, International Journal of Chemical and Physical Sciences 4, (2015) 432-439.
5. S. Sabita, C.B. Subash, P.S. Shankar, P.J. Leela, Synthesis and study of zinc oxide nanoparticles for dye sensitized solar cell, Research Journal of Physical Sciences, 5 (2017) 6-10.
6. R.A. Zargar, M. Arora, Synthesis and Characterization of ZnO Nanoparticles for Biomedical Applications, Glob J Nanomed, 2 (2017) 1-3.
7. K. Zheng, K. Zidek, M. Abdellah, P. Chabera, M.S. Abd El-sadek, T. Pullerits, Effect of metal oxide morphology on electron injection from CdSe quantum dots to ZnO, Applied Physics Letters 102 (2013) 163119-1 - 163119-5.
8. M. Vaseem, A. Umar, Y.B. Hanh, ZnO nanoparticles: Growth, properties, and applications. In: A.Ummer, Y.B. Hanh (Eds), Metal Oxide Nanostructures and Their Applications, 5 American Scientific Publishers, Los Angeles, CA, USA, (2010) 1–36.
9. Y. Xie, Y. He, P.L. Irwin, T. Jin, X. Shi, Antibacterial activity and mechanism of action of zinc oxide nanoparticles against Campylobacter jejuni, Appl. Environ. Microbiol. 77 (2001) 2325-2331.
10. J.W. Rasmussen, E. Martinez, P. Louka, G. Denise, D.G. Wingett, Zinc oxide nanoparticles for selective destruction of tumor cells and potential for drug delivery applications, Expert Opin. Drug Deliv, 7 (2010) 1063-1077.
11. J.L. Watson, T. Fang, C.O. Dimkpa, D.W. Britt, J.E. McLean, A. Jacobson, A.J. Anderson, The phytotoxicity of ZnO nanoparticles on wheat varies with soil properties, Biometals 28 (2015) 101-112.
12. H. Ma, P.L. Williams, S.A. Diamond, Ecotoxicity of manufactured ZnO
13. Z. An-Qi, Z. Lu, S. Li, Q. Dong-Jin, C. Meng, Morphology-controllable synthesis of ZnO nano-microstructures by a solvothermal process in ethanol solution Cryst. Res. Technol. 48 (2013) 947-955.
14. E. R. Shaaban, A. M. A. Mostafa, H. Shokry Hassan, M.S. Abd El-Sadek, Gehan
Y. Mohamed, I. Sharaf, Effect of γ-irradiation on Structural and Optical Ellipsometry Parameters of ZnO Nanocrystalline, Int. J. Thin Film Sci. Tec. 3 (2014) 129-141.
15. S.D. Lee, S.H. Nam, M.H. Kim, J.H. Boo, Synthesis and photocatalytic property of ZnO nanoparticles prepared by spray-pyrolysis method, Physics Procedia 32 (2012) 320-326.
16. H.P. Suryawanshi, S.G. Bachhav, D.R. Patil, Hydrothermal Synthesis of Zinc Oxide and Its Photocatalytic Effect, IJCPS 4 (2015) 483-486
17. B. Sunandan, D. Joydeep, Hydrothermal growth of ZnO nanostructures, Sci. Technol.Adv. Mater.10 (2009) 1-18.
18. A.S. Nehal, E.K. Maged, M.I. Ebtisam, Synthesis and Characterization of ZnO Nanotubes by Hydrothermal Method,IJSRP, 5 (2015) 1-4.
19. A.R. Reddy, A.N. Mallika, K.S. Babu, K.V. Reddy, Hydrothermal synthesis and characterization of ZnO nanocrystals, International Journal of Mining, Metallurgy & Mechanical Engineering, 3 (2015) 52-55.
20. S.N. Shaha, I.S. Alib, A.S. Rizwan, M. Naeema, B. Yasmeen, S.A. Rehan, S.R. Masood, K. Yousuf, K. S. Sikander, Synthesis and Characterization of Zinc Oxide Nanoparticles for Antibacterial Applications, Journal of Basic & Applied Sciences, 12 (2016) 205-210.
21. K.P. Saroj, A novel chemical approach to fabricate ZnO Nanostructure, PhD thesis, Indian Institute of Technology Kharagpur (2008).
22. K. Venkateswarlu, D. Sreekanth, M. Sandhyarani, V. Muthupandi, A. C. Bose, N. Rameshbabu, X-Ray Peak Profile Analysis of Nanostructured Hydroxyapatite and Fluorapatite, International Journal of Bioscience, 2 (2012) 389-393.
23. C.M. Jay, M. Sathya, K. Pushpanathan, Effect of pH on Crystal Size and Photoluminescence Property of ZnO Nanoparticles Prepared by Chemical Precipitation Method, Acta Metall. Sin. (Engl. Lett.), 28 (2015) 394-404.
24. K.G. Williamson, H.W. Hall, X-ray broadening from field aluminium and wolfram, Acta Metall. 1 (1953) 1-22.
25. S.K.V. Sesha, K.P. Venkateswara, X-ray Peak Broadening Analysis and Optical Studies of ZnO Nanoparticles Derived by Surfactant Assisted Combustion Synthesis, Journal of Nano- and Electronic Physics 5 (2013) 02026-1 - 02026-6. 26. J. Markmann, V. Yamakov, Weissemu¨ller. Validating grain size analysis from X-ray
line broadening: A virtual experiment J. Scr. Mater. 59 (2008) 15-18.
27. A. Jagannatha Reddy, M.K. Kokila, H. Nagabhushan, R.P.S. Chakradhar, C. Shivakumar, J.L. Rao, B.M. Nagabhushan, Structural, optical and EPR studies on ZnO:Cu nanopowders prepared via low temperature solution combustion synthesis, Journal of Alloys and Compounds 509 (2011) 5349–5355.
28. D.M. Fernandes, R. Silva, A.A.W. Hechenleitner, E. Radovanovic, M. MAC, E.A.G. Pineda, Synthesis and characterization of ZnO, CuO and a mixed Zn and Cu oxide, Mater. Chem. Phys. 115 (2009) 110-115.
29. F. Ahmed, S. Kumar, N. Arshi, M.S. Anwar, B.H. Koo, C.G. Lee, Rapid and Cost
Effective Synthesis of Zno Nanorods Using Microwave Irradiation Technique, Funct. Mater. Lett. 4 (2011) 1-5.
30. C.H. Ahn, Y.Y. Kim, D.C. Kim, S.K. Mohanta, H.K. Cho, A comparative analysis of deep level emission in ZnO layers deposited by various methods, J. Appl. Phys. 105 (2009) 013502-1 - 013502-5.
31. S. Fujita, K. Matsuura, Inclusion of Zinc Oxide Nanoparticles into Virus-Like Peptide Nanocapsules Self-Assembled from Viral β-Annulus Peptide, Nanomaterials, 4 (2014) 778-791.
32. Z.W. Liang, X.A. Yu, B.F. Lei, P.Y. Liu, W.J. Mai, Novel blue-violet photoluminescence from sputtered ZnO thin films, J. Alloys Compd, 509 (2011) 5437-5440.
33. Y. Hu, H.J. Chen, Preparation and characterization of nanocrystalline ZnO particles from a hydrothermal process, J. Nanopart. Res, 10 (2008) 401-407. 34. C. Aydın, M.S. Abd El-sadek, Kaibo Zheng, I.S. Yahia, F. Yakuphanoglu,
Synthesis, diffused reflectance and electrical properties of nanocrystalline Fe-doped ZnO via sol-gel calcination technique, Optics & Laser Technology 48 (2013) 447-452.
35. R. Bekkari, L. laânab, D. Boyer, R. Mahiou, B. Jaber,
Influence of the sol gel synthesis parameters on the photoluminescence properties of ZnO nanoparticles, Materials Science in Semiconductor Processing 71 (2017) 181-187.
36. J.N. Hasnidawani, H.N. Azlina, H. Norita, N.N. Bonnia, S. Ratim, E.S. Ali, Synthesis of ZnO Nanostructures Using Sol-Gel, Procedia Chemistry 19 (2016) 211-216.
37. S. Bagheri, K.G. Chandrappa, S. B. Abd Hamid, Facile synthesis of nano-sized ZnO by direct precipitation method, Der Pharma Chemica, 5 (2013) 265-270. 38. N.A. Salahuddin, M. El-Kemary, E.M. Ibrahim, Synthesis and Characterization of
ZnO Nanoparticles via Precipitation Method: Effect of Annealing Temperature on Particle Size, Nanoscience and Nanotechnology, 5 (2015) 82-88.
39. Sarunya Klubnuan, Pongsaton Amornpitoksuk, Sumetha Suwanboon,
Structural, optical and photocatalytic properties of MgO/ZnO nanocomposites prepared by a hydrothermal method, Materials Science in Semiconductor Processing 39 (2015) 515-520.
Figures
[image:10.595.107.521.581.721.2]Fig. 1a XRD spectrum of ZnO nanoparticles under different reaction times 8, 12, 16, 20 and 24 hrs.
Fig.1b XRD spectrum of ZnO nanoparticles under different synthesis temperatures 100, 125, 150, 175, and 200 oC.
Fig. 2: Crystallite size as a function of (a) reaction time and (b) synthesis temperature.
Fig.3 EDX spectra of ZnO nanoparticles prepared at (a) 8 hours and (b) 150 oC.
[image:11.595.106.492.244.724.2]Fig. 5 FT-IR spectra of ZnO nanoparticles synthesized at (a) various reaction times and (b) various temperatures.
[image:12.595.112.515.398.560.2]Fig. 6b Absorbance and transmittance spectra of ZnO nanoparticles synthesized at different temperatures.
Fig. 7a Plots of hγ against (αhγ)2 of ZnO nanoparticles synthesized at different
reaction times.
Fig. 7b Plots of hγ against (αhγ)2 of ZnO nanoparticles synthesized at different
[image:13.595.115.457.551.729.2]Fig. 8a Fluorescence spectra of the ZnO nanoparticles synthesized at different times.
[image:14.595.129.465.341.542.2]Fig. 9a TG curves of ZnO nanoparticles synthesized at different times.
[image:15.595.108.428.347.543.2]Fig. 10a DSC of ZnO nanoparticles synthesized at different times.
[image:16.595.128.451.315.507.2]Tables
Table 1. The characteristics of the ZnO nanoparticles synthesized at various time and temperature values.
NO. Factor 2θ(101), (o)
FWHM , (rad), (10-2)
D (nm)
d, (nm)
a (nm)
c, (nm)
S
(10-3) ε, (10-3) Scherer WH
S1 8 h 36.285 0. 4662 31.30 48.14 0.2475 0.3249 0.5205 1.02 1.1075
S2 12 h 36.307 0. 4698 31.06 61.1 0.2475 0.3249 0.5205 1.04 1.1161
S3 16 h 36.288 0.4388 33.25 44.7 0.2475 0.3249 0.5205 0.90 1.0424
S4 20 h 36.329 0.3812 38.28 48.56 0.2475 0.3249 0.5205 0.68 0.9055
S5 24 h 36.282 0.4168 35.01 48.76 0.2475 0.3249 0.5205 0.82 0.9902
S6 100 oC 36.264 0.5402 27.02 31.68 0.2475 0.3249 0.5205 1.37 1.2831
S7 125 oC 36.256 0.5248 27.80 34.48 0.2476 0.3250 0.5207 1.29 1.2468
S8 150 oC 36.264 0.4388 33.12 44.27 0.2475 0.3249 0.5205 0.90 1.0424
S9 175 oC 36.256 0.4897 29.79 44.02 0.2476 0.3250 0.5207 1.13 1.1635
[image:17.595.149.450.368.456.2]S10 200 oC 36.265 0.4157 35.10 50.99 0.2475 0.3249 0.5205 0.81 0.9875
Table 2. Band gap values estimated for different reaction times and temperatures.
Time, hrs. Eg, eV Temperature, oC Eg, eV
8 3.62 100 3.60
12 3.40 125 3.38
15 3.26 150 3.28
20 3.13 175 3.18
24 2.90 200 2.91