using thermoelastic stress analysis and synchrotron X-ray
diffraction experiments
AMJAD, Khurram, ASQUITH, David <http://orcid.org/0000-0002-0724-7415>,
EANN, Patterson, SEBASTIAN, Chris and WANG, Wei-Chun
Available from Sheffield Hallam University Research Archive (SHURA) at:
http://shura.shu.ac.uk/17343/
This document is the author deposited version. You are advised to consult the
publisher's version if you wish to cite from it.
Published version
AMJAD, Khurram, ASQUITH, David, EANN, Patterson, SEBASTIAN, Chris and
WANG, Wei-Chun (2017). The interaction of fatigue cracks with a residual stress
field using thermoelastic stress analysis and synchrotron X-ray diffraction
experiments. Royal Society Open Science, 4 (171100).
Copyright and re-use policy
See http://shura.shu.ac.uk/information.html
Sheffield Hallam University Research Archive
rsos.royalsocietypublishing.org
Research
Cite this article:Amjad K, Asquith D,
Patterson EA, Sebastian CM, Wang W-C. 2017 The interaction of fatigue cracks with a residual stress ield using thermoelastic stress analysis and synchrotron X-ray difraction experiments.R. Soc. open sci.4: 171100. http://dx.doi.org/10.1098/rsos.171100
Received: 9 August 2017 Accepted: 6 October 2017
Subject Category: Engineering
Subject Areas:
materials science/mechanical engineering
Keywords:
cold expansion, fastener holes, residual stresses, thermoelastic stress analysis, synchrotron X-ray difraction, fatigue cracks
Author for correspondence: Eann A. Patterson
e-mail:[email protected]
The interaction of fatigue
cracks with a residual stress
ield using thermoelastic
stress analysis and
synchrotron X-ray
difraction experiments
Khurram Amjad
1,2
, David Asquith
3
, Eann A. Patterson
1
,
Christopher M. Sebastian
1
and Wei-Chung Wang
2
1School of Engineering, University of Liverpool, Liverpool L69 3GH, UK2Department of Power Mechanical Engineering, National Tsing Hua University, Taiwan, ROC
3Materials and Engineering Research Institute, Sheield Hallam University, Sheield S1 1WB, UK
EAP,0000-0003-4397-2160
This article presents an experimental study on the fatigue behaviour of cracks emanating from cold-expanded holes utilizing thermoelastic stress analysis (TSA) and synchrotron X-ray diffraction (SXRD) techniques with the aim of resolving the long-standing ambiguity in the literature regarding potential relaxation, or modification, of beneficial compressive residual stresses as a result of fatigue crack propagation. The crack growth rates are found to be substantially lower as the crack tip moved through the residual stress zone induced by cold expansion. The TSA results demonstrated that the crack tip plastic zones were reduced in size by the presence of the residual compressive stresses induced by cold expansion. The crack tip plastic zones were found to be insignificant in size in comparison to the residual stress zone resulting from cold expansion, which implied that they were unlikely to have had a notable impact on the surrounding residual stresses induced by cold expansion. The residual stress distributions measured along the direction of crack growth, using SXRD, showed no signs of any significant stress relaxation or redistribution, which validates the conclusions drawn from the TSA data. Fractographic analysis qualitatively confirmed the influence on crack initiation of the residual stresses induced by the
2
rsos
.ro
yalsociet
ypublishing
.or
g
R.
Soc
.open
sc
i.
4
:17
1100
...
cold expansion. It was found that the application of single compressive overload caused a relaxation, or reduction in the residual stresses, which has wider implications for improving the fatigue life.
1. Introduction
The manufacturing of aerospace structures requires thousands of fastener holes to be drilled for the purpose of assembly. Fatigue cracks can initiate from such holes, thereby reducing the overall integrity of aerospace structures. The split sleeve cold expansion of holes is one of the most widely used cold-working processes in the aerospace industry and is employed to improve the fatigue performance of new and old airframes. In this process, a hardened steel mandrel, with an oversized head, is passed through an initially undersized hole to cause plastic expansion. As the mandrel head is removed after the expansion, a ring of compressive residual stresses is developed as a result of the spring-back effect from the surrounding elastic material. An internally lubricated split sleeve resides on the mandrel shank to allow the cold expansion to be carried out with access to only one side of the component. It also ensures that there is no direct contact of the mandrel head with the internal hole edge, which minimizes the out-of-plane distortion during cold expansion. The specimen faces from which the mandrel enters and exits the specimen during cold expansion are referred to as the mandrel entry and exit faces, respectively.
Life predictions for fatigue cracks emanating from cold-expanded holes involve the determination of the effective stress intensity factor range (Keff) by superimposing stress intensity factor due to
the residual stress field resulting from cold expansion on the corresponding one due to the applied mechanical loads, typically using the weight function method [1–7], and the subsequent use of the evaluatedKeffvalues in appropriate theoretical relations, similar to Paris’ Law, which relatesKeffto
the crack growth rate. This approach intrinsically assumes that the initial residual stress field developed by cold expansion does not change due to propagation of a fatigue crack. Various researchers [1,7–9] have highlighted that the residual stresses could potentially redistribute as the fatigue crack grows and this should be taken into account for reliable fatigue life predictions. Therefore, it is important to develop a clear understanding about the potential for and causes of any redistribution of these residual stresses. Various aspects related to the fatigue performance of cold-expanded holes have been studied extensively over the past three and a half decades; however, few investigations [10–18] have focused on the potential redistribution or relaxation of beneficial compressive residual stresses resulting from either fatigue loading or due to the propagation of fatigue cracks from such holes. Cannonet al. [10] were the first to state that the application of large compressive loads can cause the redistribution or relaxation of these compressive residual stresses. Stefanescuet al. [11] later reaffirmed their conclusions by determining the residual stress relaxation close to the hole edge, resulting from compressive overloads, using a laboratory X-ray diffraction technique. It is, therefore, well understood that the fatigue loads, causing large-scale plastic deformation at the hole edge, could significantly alter the initial residual stress distribution. Compressive loads are particularly detrimental in this context, because only a small magnitude load is required to cause the highly compressive residual stresses at the hole edge to exceed the yield stress.
3
rsos
.ro
yalsociet
ypublishing
.or
g
R.
Soc
.open
sc
i.
4
:17
1100
...
Lacaracet al. [18] used a different approach to investigate the issue of residual stress relaxation by measuring the crack opening stress, σopat different crack lengths. The values for σop were found to
be constant for all crack lengths. In a more recent investigation by Backmanet al. [19], crack opening displacements along crack flanks were found to be constant across the compressive residual stress zone, which is in agreement with the results reported by Lacaracet al. [18]. The findings of these investigations [18,19], therefore, imply that the residual stress distribution does not necessarily relax as a result of fatigue crack propagation, which is contrary to the conclusions drawn by Özdemir & Edwards [13] and Stefanescuet al. [14,15]. The experimental study presented in this article investigates the propagation
of fatigue cracks emanating from cold-expanded holes and their influence on the surrounding residual stresses, with the aim of resolving the above-mentioned differences found in the literature by establishing the reasons for the potential redistribution of these residual stresses.
2. Background
Two experimental techniques were used in this work, i.e. thermoelastic stress analysis (TSA) and synchrotron X-ray diffraction (SXRD). TSA was employed to study the behaviour of fatigue cracks during propagation; whereas SXRD was used to measure residual stresses around un-cracked and cracked cold-expanded holes to determine whether any significant redistribution of these residual stresses occurred. Fractographic analysis was also performed to qualitatively analyse the influence of residual stresses on fatigue crack initiation.
2.1. Thermoelastic stress analysis technique
TSA is a non-contact technique used to determine the stresses from the surface of a cyclically loaded specimen by measuring the thermoelastic effect. The theoretical basis for the thermoelastic effect was first proposed by Lord Kelvin in 1853 by relating the temperature change to the elastic deformation. The detailed mathematical theory underpinning TSA can be found in a review by Pitarresi & Patterson [20]. The generalized form of the relation that relates the change in temperature of an elastic solid to its change in strain is as follows:
T= T
ρCε
∂σij
∂Tεij+
Q
ρCε
, (2.1)
whereTis the temperature change,Tis the absolute temperature,ρ is the density,Cε is the specific
heat capacity at constant strain, σij andεij are the stress and stain tensors, respectively, andQ is the
heat input. TSA is usually performed by loading the specimen cyclically, at a suitably high frequency to ensure adiabatic conditions, which allows the second term in equation (2.1) to be ignored. For an isotropic material in a state of plane stress and assuming adiabatic, reversible conditions, equation (2.1) can be simplified to:
T= −αT
ρCp(σ11
+σ22), (2.2)
whereαis the coefficient of linear thermal expansion andCp is the specific heat capacity at constant
pressure. The variation in temperature on the surface of a cyclically loaded specimen can be measured by an infrared detector in terms of the voltage output,Sof the detector. Therefore, the working form of the relationship used for practical TSA is as follows:
AS=(σ11+σ22), (2.3)
whereSis the output signal from the infrared detector, which corresponds to the thermoelastic effect,
andAis the calibration constant, which is a function of both the material properties and the detector
parameters. The calibration constant,Ais usually determined experimentally by obtaining the detector
4
rsos
.ro
yalsociet
ypublishing
.or
g
R.
Soc
.open
sc
i.
4
:17
1100
...
Tomlinsonet al. [21], which was further improved and implemented in the software algorithm, FATCAT by Diazet al.[22]. In this methodology, a mathematical model describing the distribution of the sum of principal stresses around a crack tip, which is based on Muskhelishvili’s approach [23], is fitted to the thermoelastic data collected from the singularity-dominated elastic zone around the crack tip. The location of the crack tip and the extent of the singularity-dominated region can be determined using the methodology described by Diazet al. [22].
2.2. Synchrotron X-ray difraction technique
Modern synchrotron radiation sources are capable of providing a high intensity, coherent, monochromatic, X-ray beam with a small spot size, and have great potential for engineers to make non-destructive, high resolution, residual stress measurements in metallic components at much greater penetrations depths [24] than was previously possible. The conventional approach for measuring residual stresses using SXRD, referred to as theθ/2θscanning method [24], was used in this experimental
study. This technique utilizes the phenomenon of shifts in Bragg’s diffracted intensity peak to determine the residual strains and is briefly explained here. The X-rays are diffracted from the atomic planes of a crystal lattice based on the well-known Bragg’s law:
nλ=2dsinθ, (2.4)
whereλis the wavelength,nis the order number of the wavelength,dis the distance between atomic
planes andθ is the diffraction angle. The angle at which a diffracted intensity peak is detected is
measured using a diffractometer and the lattice spacing is thus calculated from Bragg’s Law. The presence of residual elastic stresses causes a change in the lattice spacing and this causes a change in the angle at which the diffracted intensity peak is detected. Therefore, for the purpose of evaluating the residual strains (ε), the strain-free lattice spacing (d0) needs to be determined as well. The residual strain
can be calculated from the change in lattice spacing using the following equation:
ε=d−d0
d0 , (2.5)
The suitability of this approach for measuring residual stresses around cold-expanded holes has been previously investigated by Stefanescuet al. [15]. The measurements from SXRD using this method were
compared with neutron diffraction and laboratory X-ray diffraction results and were found to be in good agreement [15].
3. Experimental work
Experiments were conducted using aluminium specimens (6.02 mm thickness) with central holes (diameter 6.36 mm). In some of these specimens the hole was cold-worked to expand it by 3.5% using a mandrel in a split sleeve, while other specimens were left as control samples with un-expanded holes. Digital image correlation was used during the cold expansion to measure the induced strains; subsequently fatigue loading was applied to the specimens and both the stress field and extent of the plasticity monitored using thermoelastic stress analysis on one face while a pair of digital cameras was used to monitor fatigue cracks on the other face. A small subset of both the control and cold-expanded specimens were examined using synchrotron X-ray diffraction to evaluate the residual strain fields associated with both the cold expansion process and fatigue crack propagation. Finally, optical and scanning electron microscopes were used to examine the fracture surfaces in a small number of specimens from the control set and cold-expanded set. A detailed description of these experiments is provided below whiletable 2provides an overview of the fatigue loading applied to the specimens.
3.1. Cold expansion and fatigue test procedures
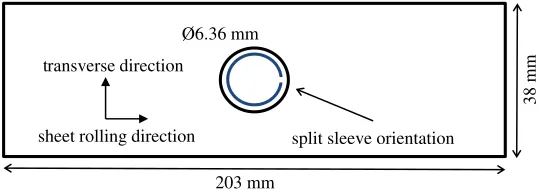
A total of 23 specimens were machined, with the geometry shown in figure 1, from a 2024-T351 aluminium plate with a nominal thickness of 0.25′′(6.35 mm). The thickness of the fabricated specimens
5
rsos
.ro
yalsociet
ypublishing
.or
g
R.
Soc
.open
sc
i.
4
:17
[image:6.522.126.397.42.137.2] [image:6.522.105.419.189.426.2]1100
...
sheet rolling direction transverse direction
203 mm
38 mm
Ø6.36 mm
split sleeve orientation
Figure 1.Schematic of centrally drilled hole specimen with the split sleeve shown in the hole (not to scale).
infrared camera
two-position zoom lens
specimen digital cameras
Figure 2.Experiment set-up for the fatigue tests.
Table 1.Mechanical properties of the 2024-T351 aluminium plate.
0.2% proof stress (MPa)
tensile strength (MPa)
elastic modulus (GPa)
elongation (%)
Ramberg–Osgood strain hardening parameter,n
rolling direction 315 505 72 19.3 7.0
. . . .
transverse direction 300 485 71 20.7 6.20
. . . .
cold expansion, the split in the sleeve was positioned along the longitudinal direction of the specimen as shown infigure 1. The combination of the oversized mandrel head and split sleeve thickness provided a maximum interference of 4.6%. The diameter of the expanded hole after mandrel removal was measured to be 6.58 mm, providing a retained expansion of 3.5%.
Fatigue tests were performed in an Instron servo-hydraulic test machine equipped with a 100 kN load cell. The experimental set-up used for the fatigue tests is shown infigure 2. On the mandrel entry side of the cold-expanded specimens, an infrared camera (FLIR 7650; FLIR Systems Inc., USA), with a InSb detector array of 640×512 pixels, was employed to simultaneously monitor the cracks and capture the
thermoelastic response. The camera is capable of acquiring images using the full sensor at a maximum frame rate of 100 Hz. For this experiment, the camera was operated at a frame rate of 250 Hz with a reduced active sensor window of 320×256 pixels. A two-position zoom lens (Stressphotonics Ltd, USA)
was used and provided a spatial resolution of 29.6 µm pixel−1. On the mandrel exit side, the cracks were
6
rsos
.ro
yalsociet
ypublishing
.or
g
R.
Soc
.open
sc
i.
4
:17
1100
...
Germany) with a resolution of 1292×964 pixels. The digital cameras were mounted with a pair of
identical Sigma macro lenses of 105 mm focal length, providing a spatial resolution of 8 µm pixel−1.
For the un-expanded specimens, the specimen faces facing the infrared camera and the pair of digital cameras will be referred to as the front and back faces, respectively, in the later sections.
Two different levels of maximum applied load were used for fatigue loading of the cold-expanded and the un-expanded specimens. For the cold-expanded specimens, the maximum applied load of 38.9 kN was used compared with 34.3 kN for the un-expanded ones. These load levels corresponded to the maximum remote nominal stresses of 170 and 150 MPa, respectively. The primary reason for using a lower maximum applied load for the un-expanded specimens was to reduce the crack growth rate in order to make it possible to manually track the tip of a growing crack and simultaneously capture the thermoelastic response from the crack tip region using an infrared camera; while a higher load was needed for the cold-expanded specimens to allow the tests to be conducted in a practical time period. All fatigue tests were performed using a load ratio of 0.1 and a frequency of 19 Hz. The fatigue loads applied to the cold-expanded specimens were chosen to ensure that the maximum hoop stress at the hole edge does not exceed the yield stress in order to avoid large-scale plastic deformation. The maximum hoop stress at the hole edge,σh,maxwas calculated by linear superposition of the hoop stress
resulting from the maximum applied load (σh,app) and the compressive residual hoop stress developed
from cold expansion (σh,res).σh,appwas evaluated by multiplying the stress concentration factor of 3.1
at the hole edge, determined for the specimen geometry shown infigure 1using an empirical relation provided in Peterson’s SCF handbook [28], with the maximum remote stress (σR,max).σh,reswas taken
as the residual hoop stress value obtained from the SXRD measurements close to the hole edge. It is pertinent to mention here thatσh,maxis a theoretical value for superimposed elastic stresses, which does
not necessarily represent the actual magnitude of hoop stresses being experienced at the hole edge; and its sole purpose is to determine whether the applied loads are expected to cause any yielding.
All six un-expanded specimens were loaded in fatigue until failure using the above-mentioned fatigue loading parameters. Out of the 17 cold-expanded specimens, a set of six specimens were loaded in fatigue until failure. For another set of three cold-expanded specimens, fatigue loading was stopped prior to failure for the purpose of performing residual stresses measurements on them. In two of the cold-expanded specimens, a single load cycle with maximum compressive loads of−21.2 and−28.6 kN was
applied, corresponding to the maximum remote nominal stresses of−92.7 and−125 MPa, respectively.
These compressive loads were chosen to represent the service loads on the wing pivot fitting of a fighter aircraft as reported by Pellet al. [29]. After examining these specimens in a synchrotron, they were also loaded in fatigue until failure. No monotonic or fatigue loads were applied on the remaining set of six cold-expanded specimens. They were examined in a synchrotron to determine the uncertainty in the measurements of residual stress. The details of the fatigue test programme described above are summarized intable 2.
3.2. Synchrotron X-ray difraction experiment procedures
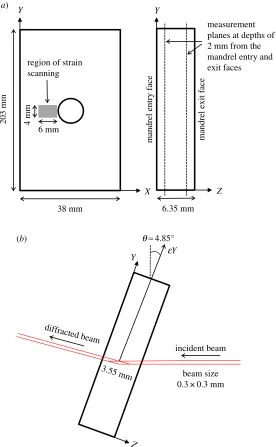
The residual strain scanning was performed on a high-resolution powder diffraction beamline, ID22 at the European Synchrotron Radiation Facility (ESRF). The key objectives were: (i) to determine the initial residual stress distribution developed from cold expansion, (ii) to evaluate the uncertainty in the residual stresses, and (iii) to measure the residual stresses in the specimens, which had been loaded in fatigue, for evidence of any significant residual stress relaxation or redistribution. The residual strains in the longitudinal (Y) and transverse (X) directions were measured in the region surrounding the
fatigue crack at the hole edge in specimens, C8 and C9. A rectangular matrix of 180 measurement points was defined in this region with a uniform spacing of 0.4 mm. The area was scanned twice over two measurement planes, which were defined at a depth of 2 mm from both the mandrel entry and exit faces of the specimen (figure 3a). For the purpose of quantitative comparison, the residual strains were
also measured in the same region in one of the un-cracked cold-expanded specimens, C12. In order to determine the uncertainty in the initial residual strains, scans along the transverse centre line were performed in specimens C13–C17 at a depth of 2 mm from the mandrel exit face. Similar line scans were also performed in specimens C7, C10 and C11 at a depth of 2 mm from both the mandrel entry and exit faces.
All measurements were performed in a transmission geometry using a monochromatic X-ray beam of 0.3×0.3 mm with a photon energy of 60 keV. At this energy, the diffraction from the (311) plane was
at 2θ≈9.7° approximately. The (311) plane was selected for residual strain measurements because it has
7
rsos
.ro
yalsociet
ypublishing
.or
g
R.
Soc
.open
sc
i.
4
:17
[image:8.522.55.471.83.580.2]1100
...
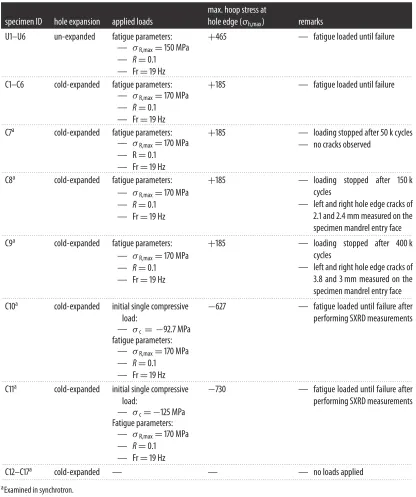
Table 2.Summary of fatigue tests performed in the experimental study.σh,maxis the maximum hoop stress at the hole edge which
was determined by linear superposition of the hoop stress resulting from the applied load (σh,app) and the compressive residual stress developed from cold expansion (σh,res).
specimen ID hole expansion applied loads
max. hoop stress at
hole edge (σh,max) remarks
U1–U6 un-expanded fatigue parameters: +465 — fatigue loaded until failure
— σR,max=150 MPa — R=0.1
— Fr=19 Hz
. . . . C1–C6 cold-expanded fatigue parameters: +185 — fatigue loaded until failure
— σR,max=170 MPa — R=0.1
— Fr=19 Hz
. . . . C7a cold-expanded fatigue parameters: +185 — loading stopped after 50 k cycles
— no cracks observed — σR,max=170 MPa
— R=0.1 — Fr=19 Hz
. . . .
C8a cold-expanded fatigue parameters: +185 — loading stopped after 150 k
cycles
— left and right hole edge cracks of 2.1 and 2.4 mm measured on the specimen mandrel entry face — σR,max=170 MPa
— R=0.1 — Fr=19 Hz
. . . .
C9a cold-expanded fatigue parameters: +185 — loading stopped after 400 k
cycles
— left and right hole edge cracks of 3.8 and 3 mm measured on the specimen mandrel entry face — σR,max=170 MPa
— R=0.1 — Fr=19 Hz
. . . . C10a cold-expanded initial single compressive
load:
−627 — fatigue loaded until failure after performing SXRD measurements — σc = −92.7 MPa
fatigue parameters: — σR,max=170 MPa — R=0.1 — Fr=19 Hz
. . . . C11a cold-expanded initial single compressive
load:
−730 — fatigue loaded until failure after performing SXRD measurements — σc= −125 MPa
Fatigue parameters: — σR,max=170 MPa — R=0.1 — Fr=19 Hz
. . . .
C12–C17a cold-expanded — — — no loads applied
. . . . aExamined in synchrotron.
material [30], and a majority of the investigations [15,31–35], which studied macroscopic residual strains in aluminium materials, have performed diffraction measurements by selecting this plane. Each specimen was mounted on a three-axis translation stage; and, for each measurement, the diffractometer was swept through a fixed 2θangular range from 9.6 to 9.85°, to measure the diffracted intensity peak. To
resolve the residual strain components along two orthogonal directions, the specimens were mounted in two different orientations. A schematic of the specimen orientation for measuring residual strain along theYdirection is shown infigure 3b. The measurement volume, commonly referred to as the gauge
8
rsos
.ro
yalsociet
ypublishing
.or
g
R.
Soc
.open
sc
i.
4
:17
[image:9.522.125.401.42.489.2]1100
...
Y
X
region of strain scanning
6 mm
4 mm
203 mm
38 mm 6.35 mm
mandrel entry face mandrel exit face
Y
Z
measurement planes at depths of 2 mm from the mandrel entry and exit faces
incident beam
beam size 0.3 × 0.3 mm
Z
diffracted beam
3.55 mm
Y eY
qª4.85° (a)
(b)
Figure 3.Schematic (a) represents the area and measurement planes over which the residual strain scanning was performed in
cold-expanded specimens, C8 with a 2.1 mm crack, C9 with a 3.8 mm crack and C12 to which no loads were applied and (b) represents the specimen orientation and difraction geometry for measuring residual strains alongYdirection (not to scale).
The strain-free (311) plane spacing, d0 for aluminium was measured using comb-teeth shaped
specimens, which were manufactured using EDM from the same plate as the fatigue specimens. The machining of the comb-teeth shaped structure using EDM relieved any macro-scale residual stresses along the teeth profile, which makes them suitable for thed0measurements [36]. The values ford0along
longitudinal and transverse directions were found to be 1.221679±0.000206 Å and 1.220445±0.000032 Å,
respectively. Measured residual strains were converted to stresses using the following form of Hooke’s Law assuming plane stress conditions and values of 72 GPa and 0.33 for Young’s modulus (E) and
Poisson’s ratio (v), respectively:
σx=1 E
−v2(εx+vεy) (3.1a)
and
σy=1 E
9
rsos
.ro
yalsociet
ypublishing
.or
g
R.
Soc
.open
sc
i.
4
:17
[image:10.522.56.476.55.295.2]1100
...
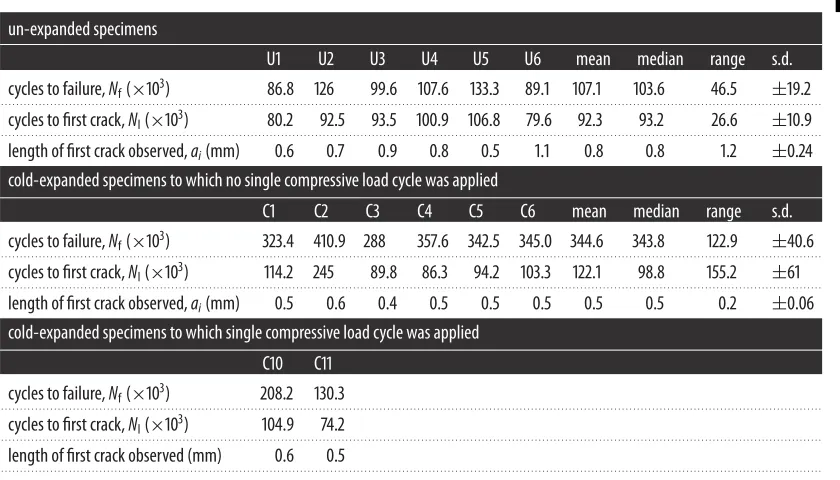
Table 3.Summary of fatigue test results for the un-expanded and the cold-expanded specimens.
un-expanded specimens
U1 U2 U3 U4 U5 U6 mean median range s.d. cycles to failure,Nf(×103) 86.8 126 99.6 107.6 133.3 89.1 107.1 103.6 46.5 ±19.2 . . . .
cycles to irst crack,NI(×103) 80.2 92.5 93.5 100.9 106.8 79.6 92.3 93.2 26.6 ±10.9 . . . .
length of irst crack observed,ai(mm) 0.6 0.7 0.9 0.8 0.5 1.1 0.8 0.8 1.2 ±0.24
cold-expanded specimens to which no single compressive load cycle was applied
. . . . C1 C2 C3 C4 C5 C6 mean median range s.d. cycles to failure,Nf(×103) 323.4 410.9 288 357.6 342.5 345.0 344.6 343.8 122.9 ±40.6 . . . .
cycles to irst crack,NI(×103) 114.2 245 89.8 86.3 94.2 103.3 122.1 98.8 155.2 ±61 . . . .
length of irst crack observed,ai(mm) 0.5 0.6 0.4 0.5 0.5 0.5 0.5 0.5 0.2 ±0.06
cold-expanded specimens to which single compressive load cycle was applied
. . . . C10 C11
cycles to failure,Nf(×103) 208.2 130.3
. . . . cycles to irst crack,NI(×103) 104.9 74.2
. . . . length of irst crack observed (mm) 0.6 0.5
. . . .
The standard deviations were obtained from a total of 18 measurements along each direction and correspond to an uncertainty of±169 and±27 µ-strain in the longitudinal and transverse residual strains,
respectively. Stefanescuet al. [15], who utilized SXRD in one of their studies, reported the uncertainty of ±74 µ-strain, resulting from variation ind0, in the residual strain measurements around cold-expanded
holes. The vertical and horizontal beam dimensions employed in their work ranged from 0.3 to 1 mm and from 0.6 to 2 mm respectively, giving a lower spatial resolution in comparison with the measurements performed in this work, where the beam size of 0.3×0.3 mm was used. However, the strain resolution
of±169 µ-strain for theYdirection residual strains was lower in this work compared with±74 µ-strain
in the study by Stefanesuet al. [15]. Nonetheless, the strain resolution was high enough to discern any
potential residual strain relaxation due to fatigue crack propagation, which was reported to be of the order of 2400 µ-strain close to the hole edge by Stefanescuet al. [15]. It is pertinent to mention here that a detailed uncertainty analysis, taking into account the residual stresses due to cold expansion process variability, has not been carried out in any of the previous investigations and is essential to identify any significant redistribution or relaxation of such stresses. Therefore, the propagated uncertainties were evaluated in this work considering the influence of both the variation in d0 and the cold expansion
process as discussed in the later section.
4. Results and discussion
A summary of fatigue lives is provided intable 3for the specimens tested. The average fatigue life of the six cold-expanded specimens is 3.2 times higher than that of the six un-expanded specimens. This improvement is evident despite the fact that the maximum remote stress during fatigue loading for the cold-expanded specimens was 170 MPa compared to 150 MPa for the un-expanded ones. The number of cycles to failure for specimens C10 and C11, to which a single compressive stress cycle of−92.7 and −125 MPa were applied, respectively, are substantially lower than the mean fatigue life of the standard
six cold-expanded specimens. The difference is greater than three standard deviations, which clearly indicates that the initial residual stress distribution was significantly relaxed by the applied compressive loads in these specimens.
4.1. Behaviour of fatigue crack propagation
10
rsos
.ro
yalsociet
ypublishing
.or
g
R.
Soc
.open
sc
i.
4
:17
[image:11.522.60.468.37.389.2]1100
...
0 4 8 12
0 100 200
primary crack on entry/front face
primary crack on exit/back face
secondary crack on entry/front face
secondary crack on exit/back face
300 400
U3 R U4 R U6 L C4 L C5 L C6 R C10 R C11 L
0 4 8 12
0 100 200 300 400
C10 L
C11 R 0
4 8 12
0 100 200 300 400
C4 R C5 R C6 L C10 L C11 R
no. cycles (×103) no. cycles (×103) 0
4 8 12
0 100 200 300 400
U3 R
U4 R
U6 L
C10 R
C11 L
crack length from hole edge (mm)
crack length from hole edge (mm)
(a) (b)
(c) (d)
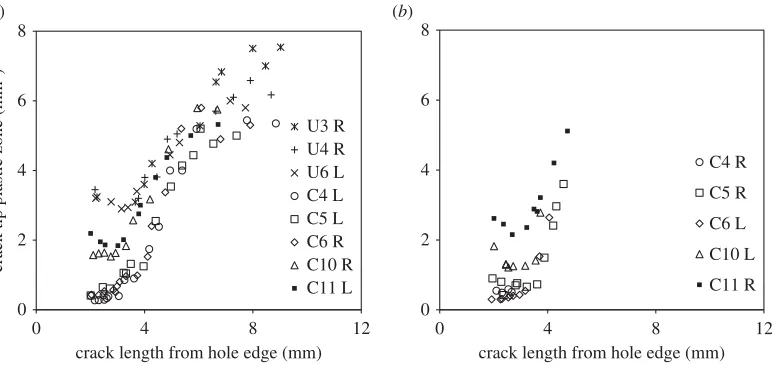
Figure 4.Crack growth plots for (a,c) the primary crack, that led to failure, observed on the mandrel entry/front and exit/back face
respectively; and (b,d) the secondary crack, initiated at the opposite end of the diameter, observed on the mandrel entry/front and exit/back face respectively. Letters, L and R in the plot legends refer to the cracks originating from either left or right side of the hole edge, respectively.
11
rsos
.ro
yalsociet
ypublishing
.or
g
R.
Soc
.open
sc
i.
4
:17
1100
... 10–6 10–5 10–4 10–3 10–20 4 8 12
U3 R U4 R U6 L C4 L C5 L C6 R C10 R C11 L
crack length from hole edge (mm)
10–6 10–5 10–4 10–3 10–2
0 4 8 12
C4 R C5 R C6 L C10 L C11 R
crack length from hole edge (mm)
1 10 100
0 4 8 12
C4 R C5 R C6 L C10 L C11 R 1 10 100
0 4 8 12
U3 R U4 R U6 L C4 L C5 L C6 R C10 R C11 L
crack length from hole edge (mm) crack length from hole edge (mm)
DKI(MPa m0.5)
D KI (MPa m 0.5 )
DKI(MPa m0.5)
10–6 10–5 10–4 10–3 10–2
1 10 100
U3 R U4 R U6 L C4 L C5 L C6 R C10 R C11 L
crack growth rate (mm
cycle –1) 10–6 10–5 10–4 10–3 10–2
1 10 100
C4 R C5 R
C6 L C10 L C11 L
crack growth rate (mm
cycle
–1)
(a) (b)
(c) (d)
(e) (f)
primary crack secondary crack
Figure 5.Plots of (a,b) crack growth rate obtained by diferentiating the growth plots inigure 4a,b, respectively; (c,d) efective stress
intensity factor range determined from TSA data; and (e,f) crack growth rate against the efective stress intensity factors. All the plots in this igure are for cracks observed on the mandrel entry/front face of the specimens. Letters, L and R in the plot legends refer to the cracks originating from either left or right side of the hole edge, respectively.
by retarding the crack growth rather than delaying the crack initiation, which is in agreement with the findings reported by Chandawanich & Sharpe [1]. The information about the number of cycles at which the first crack was observed (Ni) and its length (ai) is provided for all the specimens tested intable 3.
The crack growth profiles for the mandrel entry/front face infigure 4a,bwere differentiated by fitting a least-squares regression line to every five consecutive data points to obtain the growth rate plots shown infigure 5a,b. In cold-expanded specimens C4–C6, the cracks started off with a relatively higher crack growth rate of 0.03 µm cycle−1, which decreased to a minimum value of 0.007 µm cycle−1 before
12
rsos
.ro
yalsociet
ypublishing
.or
g
R.
Soc
.open
sc
i.
4
:17
[image:13.522.148.375.41.237.2]1100
...
–400 –200 0 200 400 600
0 2 4 6 8 10 12
superimposed residual applied
distance from hole edge (mm)
hoop stress (MPa)
Figure 6.Plot of superimposed hoop stress proile along the transverse centre line of the specimen which was determined by addition
of the tensile hoop stress proile resulting from the applied remote stress of 170 MPa and the compressive residual hoop stress proile developed by cold expansion.
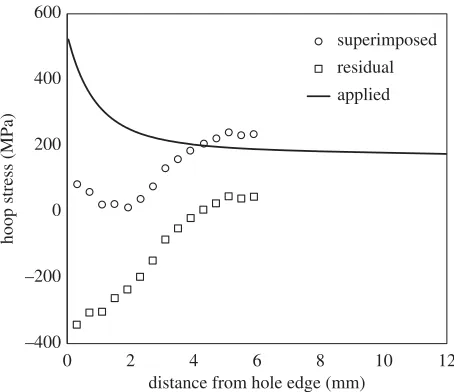
from both ends of the transverse diameter through the hole. The average distance from the hole edge of the turning points in the crack growth rate plots was found to be 2.7 mm for the primary cracks and 2.2 mm for the secondary cracks in the three specimens. This characteristic trend is believed to result from a combined effect of decreasing applied stresses due to the reduced influence of the stress concentration and the presence of a compressive residual stress distribution, which reduces to zero at 1 mm beyond the location of the turning point. To illustrate this, a superimposed hoop stress profile along the transverse centre line of the specimen is shown infigure 6, which was determined by superimposing the tensile hoop stress profile resulting from the remote stress of 170 MPa on the compressive residual stress profile determined from SXRD. As expected, the crack growth rate profiles infigure 5a,bare in
reasonable correlation with the superimposed hoop stress profile infigure 6. A similar trend could also be observed in specimens C10 and C11; but the turning points are progressively less pronounced, indicating increasing levels of residual stress relaxation or redistribution in the two specimens. By contrast, the crack growth rates are consistently very high, of the order of 1.4 µm cycle−1, for the three un-expanded
specimens in the absence of any compressive residual stresses.
Several researchers [1–7,18] attempted to determineKefffor cracks emanating from cold-expanded
holes. Almost all of them [1–7] used a theoretical approach, in whichKsolutions for the residual stress field and the applied stresses are superimposed to evaluateKeff. However, a few researchers [1–3] also
compared their theoretical predictions ofKeffwith experimental ones and found reasonable agreement.
The experimental values ofKeff were derived from the recorded crack growth rates using existing
da/dN−Kdatabases. In this work,Keffvalues were obtained directly from the thermoelastic data
using the methodology of Tomlinsonet al. [21] briefly described in an earlier section. This approach
requires thermoelastic data collection from the singularity-dominated region surrounding the crack tip, which makes it difficult to apply for small cracks close to the hole edge. For this reason,Keff was
evaluated when the cracks were at least 2 mm in length. The trends in theKeffplots for the primary
and the secondary cracks shown infigure 5c,dappear to be consistent with those of the crack growth rate
plots infigure 5a,b, respectively. The crack growth rates are plotted againstKeffinfigure 5e,fand it can
be seen the data for all of the specimens form a single curve.
4.2. Plastic zones associated with fatigue crack tip
13
rsos
.ro
yalsociet
ypublishing
.or
g
R.
Soc
.open
sc
i.
4
:17
[image:14.522.73.459.42.225.2]1100
...
crack length from hole edge (mm)
crack tip plastic zone (mm
2)
0 2 4 6 8
0 4 8 12
U3 R U4 R U6 L C4 L C5 L C6 R C10 R C11 L
0 2 4 6 8
0 4 8 12
C4 R
C5 R
C6 L
C10 L
C11 R
crack length from hole edge (mm)
(a) (b)
Figure 7.Plots of crack tip plastic zone area for (a) primary and (b) secondary cracks observed on the mandrel entry/front face of the
specimens, as inigure 4a,b, respectively.
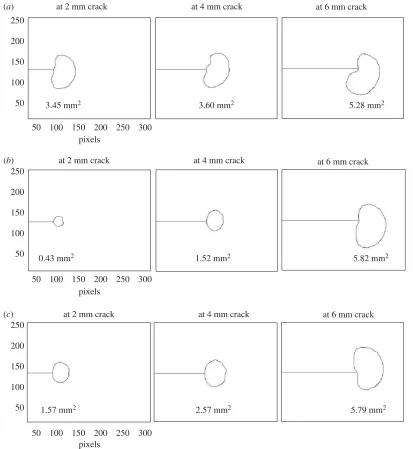
It was also utilized in this work to measure the shape and size of the crack tip plastic zones for cracks emanating from both the un-expanded and the cold-expanded holes. The plots representing the variation in plastic zone size with increasing crack length are given in figure 7. For cold-expanded specimens C4–C6, to which no initial compressive load cycle was applied, the plastic zones are consistently much smaller in size until the crack length reaches 4 mm, beyond which, the size of the plastic zone increases rapidly. This reduction of the plastic zone size is due to the presence of compressive residual stresses, which disappear at 4.2 mm from the hole edge (figure 6). To illustrate evolution of the crack tip plastic zone, its shape at three different crack lengths is shown infigure 8for three specimens: U3, C6 and C10.
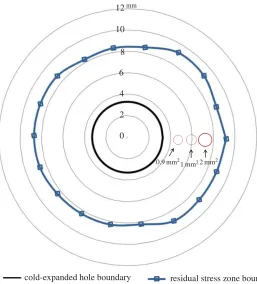
In a recent article by the current authors [45], the size and shape of the residual stress zone developed from split sleeve cold expansion was measured using the digital image correlation technique and its area, on the mandrel entry face, found to be approximately 220 mm2. The plastic zone associated with the crack tip for 4 mm crack was measured to be less than 2 mm2, while area of the plastic wake was of the order of
3 mm2, based on the size of the crack tip plastic zone at shorter crack lengths. The schematic infigure 9
shows a comparison of the two zones. The diameter of the crack tip plastic zone is 28% of the annular thickness of the residual stress zone and its size is about 1% of the overall area of the residual stress zone, which rises to 2.5% when the crack wake plastic zone is included. This demonstrates that, due to the large extent of the residual stress zone, the residual stresses induced by cold-working, which surround the crack geometrically, act as remote stresses; and the localized plastic zone associated with the crack tip is not sufficiently significant in size to cause the displacements required for relaxation of these residual stresses. To further investigate this hypothesis, which is based on results from TSA, residual stresses were measured in both the un-cracked and the cracked cold-expanded specimens using SXRD.
4.3. Efect of fatigue crack propagation on the residual stresses
Figure 10 shows maps of the residual stresses measured at a depth of 2 mm from both the faces in specimens C8, C9 and C12. Only the longitudinal (Y) component of the residual stresses is presented
14
rsos
.ro
yalsociet
ypublishing
.or
g
R.
Soc
.open
sc
i.
4
:17
[image:15.522.57.470.41.490.2]1100
...
at 2 mm crack at 4 mm crack at 6 mm crack
250
200
150
100
50 3.45 mm2 3.60 mm2 5.28 mm2
0.43 mm2 1.52 mm2 5.82 mm2
250
200
150
100
50
2.57 mm2
1.57 mm2 5.79 mm2
250
200
150
100
50
50 100 150 200 250 300
50 100 150 200 250 300
50 100 150 200 250 300 pixels
pixels pixels
at 2 mm crack at 4 mm crack at 6 mm crack
at 2 mm crack at 4 mm crack at 6 mm crack
(a)
(b)
(c)
Figure 8.Plastic zones associated with the crack tip at three diferent lengths of the crack that led to failure for (a) un-expanded
specimen, U3, (b) cold-expanded specimen, C6 to which no initial compressive stress cycle was applied and (c) cold-expanded specimen, C10 to which single compressive stress cycle of−92.7 MPa was applied prior to fatigue loading. The spatial dimensions of the maps represent the infrared camera sensor window of 256×320 pixels (1 pixel≈0.03 mm).
For a more quantitative comparison of the measured residual stresses in specimens C8, C9 and C12, their distributions are plotted infigure 12a,balong the crack line, which also coincides with the transverse
centre line of the specimen. The plot also includes the distribution for specimen, C7 to which 50 k cycles of fatigue loading was applied, with the purpose of determining whether fatigue loading on its own brings about any redistribution of residual stresses prior to initiation of a primary fatigue crack, as reported by Özdemir & Edwards [13]. The residual stress profiles for specimens C7–C9 were subtracted from those of the un-cracked specimen, C12 and the differences are plotted infigure 12c,d. All the values are within the
propagated uncertainty bounds, which were obtained from the uncertainty analysis of the measurements made in the six un-cracked specimens, C12–C17. This clearly shows that there is no significant relaxation of residual stresses resulting either from fatigue loading or due to propagation of a fatigue crack. This reinforces the conclusions drawn from the TSA results that there is negligible influence of crack tip plastic zone on the surrounding residual stresses. In contrast to the findings of Stefanescuet al.[15], the plots in
15
rsos
.ro
yalsociet
ypublishing
.or
g
R.
Soc
.open
sc
i.
4
:17
[image:16.522.124.381.42.326.2]1100
...
2 mm2
cold-expanded hole boundary residual stress zone boundary
1 mm2
0.9 mm2
0 2 4 6 8 10 12mm
Figure 9.Schematic diagram showing a comparison between the size of residual stress zone, developed on the mandrel entry face by
cold expansion, and the plastic zones associated with the crack tip for 2, 3 and 4 mm long cracks.
grown from an EDM notch, whereas in this work, the fatigue cracks were initiated naturally as a result of fatigue loading. This supports the argument that installing a notch involves material removal and associated plastic work together with the creation of a geometric discontinuity resulting in a relaxation of the residual stresses around the edge of the hole.
4.4. Efect of compressive loads on the residual stresses
For specimens, C10 and C11, the maximum hoop stress at the hole edge,σh,maxdue to the single applied
compressive load was calculated to be−627 and−730 MPa, respectively, which is substantially higher
than the ultimate tensile strength of the material i.e. 505 MPa. The 2024-T351 aluminium plate material used in this research is known to have slightly lower yield and ultimate strengths in compression in comparison to tension [47]. This implies that there will be large-scale plastic deformation causing a redistribution of the initial residual stresses. Figure 13shows the adversely affected residual stress profiles for specimens C10 and C11, which suggests an explanation for the higher crack growth rates; and consequently, higherKeffvalues and larger crack tip plastic zones in these specimens, as shown
in figures5and7. The stress relaxation at the hole edge was found to be 34% and 62% close to the mandrel entry face and 40 and 66% close to the exit face for specimens C10 and C11, respectively. It was expected that there would be a slightly higher relaxation on the exit face due to the higher magnitude of the compressive residual stresses on the exit face in comparison to the entry face.
4.5. Efect of residual stresses on fatigue crack initiation
16
rsos
.ro
yalsociet
ypublishing
.or
g
R.
Soc
.open
sc
i.
4
:17
1100
... 0 1.4 1.8 0 –2 –4 –5.4mandrel entry face mandrel exit face
100 50 0 –50 –100 –150 –200 –250 –300 –350 –400 split sleeve orientation hole centre X Y 1.8 0 –2 –4 –5.4
–9.4 –8 –6 –4 –2
0 1.4
–9.4 –8 –6 –4 –2
0 1.4
–9.4 –8 –6 –4 –2
split sleeve orientation hole centre X Y 1.8 0 –2 –4 –5.4 1.8 0 –2 –4 –5.4 split sleeve orientation hole centre X Y split sleeve orientation hole centre X Y MPa 1.8 0 –2 –4 –5.4 1.8 0 –2 –4 –5.4 split sleeve orientation hole centre X Y split sleeve orientation hole centre X Y 0 1.4
–9.4 –8 –6 –4 –2
0 1.4 mm
–9.4 –8 –6 –4 –2 0 1.4
mm
–9.4 –8 –6 –4 –2
(a) (b)
(c) (d)
(e) (f)
Figure 10.Maps ofYcomponent of residual stresses close to the mandrel entry (left) and exit (right) face for (a,b) cold-expanded
specimen, C12 to which no loads were applied; (c,d) cold-expanded specimen, C8 with a 2.1 mm crack; and (e,f) cold-expanded specimen, C9 with a 3.8 mm crack.
of the hole (figure 4) and the specimen fractured due to overload of the right-side ligament. The fatigue crack growth (FCG) region on the left side can be easily distinguished from a fast fracture region on the right by its surface roughness. The right-side surface is much rougher indicating significant plastic deformation due to overload. Focusing on the FCG region, it can be observed from SEM image 1 in
17
rsos
.ro
yalsociet
ypublishing
.or
g
R.
Soc
.open
sc
i.
4
:17
[image:18.522.131.397.42.252.2] [image:18.522.70.453.306.653.2]1100
...
–400 –300 –200 –100 0 100
0 1 2 3 4
distance from hole edge (mm)
residual hoop stress (MPa)
±31.6 ±32.4 ±30.2
±24.3 ±20.2
±36.1 ±35.0
±25.2 ±42.6
±27.6
Figure 11.Average residual stress proile, close to the mandrel exit face, for cold-expanded specimens, C12–C17 to which no loads were
applied.
mandrel entry face
residual hoop stress (MPa)
–400 –300 –200 –100 0 100
0 2 4 6 8
C12
C7
C8
C9
mandrel exit face
–400 –300 –200 –100 0 100
0 2 4 6 8
C12
C7
C8
C9
difference (MPa)
–100 –50 0 50 100
0 2 4 6 8
ABS(C12) – ABS(C7) ABS(C12) – ABS(C8) ABS(C12) – ABS(C9) 2 s.d.
distance from hole edge (mm) distance from hole edge (mm)
–100 –50 0 50 100
0 2 4 6 8
ABS(C12) – ABS(C7) ABS(C12) – ABS(C8) ABS(C12) – ABS(C9) 2 s.d.
(a) (b)
(c) (d)
Figure 12.Plots of (a,b) residual stress proiles along the transverse centre line of the specimen and (c,d) diference in their magnitudes
18
rsos
.ro
yalsociet
ypublishing
.or
g
R.
Soc
.open
sc
i.
4
:17
1100
...
–400 –300 –200 –100 0 100
0 2 4 6 8
C12
C10
C11
residual hoop stress (MPa)
residual hoop stress (MPa)
distance from hole edge (mm) –400
–300 –200 –100 0 100
0 2 4 6 8
C12
C10
C11
(a)
(b)
Figure 13.Plots of residual stress proiles close to (a) the mandrel entry face and (b) the mandrel exit face for cold-expanded specimens,
C10 to which single compressive stress cycle of−92.7 MPa was applied, C11 to which single compressive stress cycle of−125 MPa was applied and C12 to which no loads were applied.
3 (infigure 15) at the exit face corners, which are at different depths to the primary cracks. The fibrous features ahead of these secondary cracks represent rupture which occurred during specimen fracture.
With reference to open cold-expanded holes under uniaxial fatigue loading, many fractographic investigations [3,48–50] have reported the initiation of a fatigue crack from the corner of the mandrel entry face and the primary reason provided is the lower magnitude of the compressive residual stresses on the mandrel entry face in comparison with the exit face. These investigations involved specimens made of different materials and having different thicknesses, which suggest that the initiation of fatigue cracks from cold-expanded holes is not influenced by the microstructure or the specimen thickness, but is solely governed by the through-thickness distribution of the residual stresses. In a very recent article by Wanget al. [50], the fracture surface of a cold-expanded specimen was presented and shows
a localized fast fracture zone within the FCG region. The extent of this localized zone was from 0.5 to 2.5 mm from the hole edge and was reported to be bypassed by the fatigue crack due to the presence of tri-axial compressive stresses in this zone. Hence, the reduction in the FCG rate was attributed to this localized fast fracture zone. No evidence of any such localized zone was found from the fractographic analysis performed in this work, but the retardation in crack growth is still evident fromfigure 5a,b.
The proposed explanation for crack growth retardation, therefore, is the combined effect of applied stresses that decrease away from hole edge, due to the reduced effect of the stress concentration, and the presence of compressive residual stresses, which the superimposed residual hoop stress profile infigure 6
19
rsos
.ro
yalsociet
ypublishing
.or
g
R.
Soc
.open
sc
i.
4
:17
[image:20.522.100.444.39.490.2]1100
...
(2) (1)
(a)
(a)
(b)
front side back side
(1) (2)
(b)
0.5 mm 0.5 mm
0.25 mm
0.05 mm
Figure 14.Fracture surface morphology of the un-expanded specimen, U6. The optical micrograph at the top shows the whole fracture
surface. SEM images on the left show the origin of fatigue crack initiating from the left edge of the hole. SEM image on the right highlights the typical morphology which results from fast fracture.
fractograph show the crack initiation sites. It can be seen that cracks initiated from multiple sites along the hole edge and merged at a later stage to form a single fatigue crack. The resulting crack front appears to be much straighter in comparison to the one developed in the cold-expanded specimen with the unmodified residual stress distribution (specimen C6 infigure 15). This implies that the though-thickness variation in the modified residual stresses is significantly lower, which the SXRD measurements confirm. The difference between the residual hoop stresses close to the entry and exit faces at the hole edge was found to be 30 MPa for the initial, and 4 MPa for the modified, residual stress distribution.
20
rsos
.ro
yalsociet
ypublishing
.or
g
R.
Soc
.open
sc
i.
4
:17
[image:21.522.106.413.45.368.2]1100
...
(2)
mandrel exit side
mandrel entry side
(1)
(2) (3)
(4)
(4)
(1) (3)
0.5 mm
0.5 mm
1 mm
0.5 mm
Figure 15.Fracture surface morphology of the cold-expanded specimen, C6 with unmodiied residual stress distribution. The optical
micrograph at the top shows the whole fracture surface. SEM images 1 and 3 show the origin of secondary fatigue cracks initiating from left and right corners on the mandrel exit side, respectively. SEM images 2 and 4 show the origin of primary fatigue cracks initiating from left and right corners on the mandrel entry side, respectively.
zone of a growing crack with the surrounding residual stresses. They also clearly demonstrate that the behaviour of fatigue crack propagation is governed primarily by the three-dimensional distribution of residual stresses; which, as mentioned above, is similar for the commonly used aerospace materials. This implies that the conclusions drawn from TSA and SXRD results should not be restricted to the particular grade of aluminium alloy material investigated in this work. It was also established that the initial residual stress distribution developed from cold expansion undergoes redistribution when the applied loads are large enough to cause yielding at the edge of cold-expanded holes. A simple approach of linear superposition of hoop stress at the hole edge resulting from the applied load and the compressive residual stress can be used as an initial estimate to determine whether a given applied load is expected to cause yielding at the hole edge. In this work, uniaxial compressive loads have been used to demonstrate residual stress redistribution but this simple approach for determining the potential for a given load to cause residual stress redistribution can be extended to other loading scenarios. Nonetheless, the information provided in this article about the potential for and causes of any redistribution of beneficial compressive residual stresses developed from cold expansion is important in improving the theoretical models for fatigue life assessment of cold-expanded holes. It would also be useful for the engineers in the aerospace industry to realize the full potential of the cold-expansion process and to utilize it more effectively in the manufacturing of airframes leading to improved fatigue endurance under different loading conditions.
5. Conclusion
21
rsos
.ro
yalsociet
ypublishing
.or
g
R.
Soc
.open
sc
i.
4
:17
[image:22.522.108.417.45.478.2]1100
...
mandrel exit side
mandrel entry side
(1)
(2) (3)
(4)
(5)
(1)
(2)
(3)
(4)
(5) 0.5 mm
0.5 mm
0.5 mm
0.5 mm 0.5 mm
Figure 16.Fracture surface morphology of the cold-expanded specimen, C10 with modiied residual stress distribution after a single
compressive stress cycle of−92.7 MPa was applied prior to fatigue loading. The optical micrograph at the top shows the whole fracture surface. SEM images on the left and right highlight multiple crack initiation sites along the left and right edges of the hole, respectively.
22
rsos
.ro
yalsociet
ypublishing
.or
g
R.
Soc
.open
sc
i.
4
:17
1100
...redistribute as a result of fatigue loading or due to the propagation of fatigue cracks, as long as the applied loads are not high enough to cause large-scale plastic deformation at the hole edge.
An investigation was also conducted of the influence on the initial residual stress distribution of applied loads that were large enough to cause local yielding at the edge of the hole. As a consequence of the compressive nature of the residual stresses, only a relatively small applied single compressive load was required to cause yielding. The SXRD measurements revealed substantial relaxation of the initial residual stress distribution due to the application of a compressive load. These results clearly highlight the loading conditions under which the beneficial compressive residual stresses are expected to relax. This information is likely to be significant in improving the fatigue life prediction models for cold-expanded holes and for other scenarios where cold-working is used to induce beneficial residual stresses.
Data accessibility. The experimental data and the Matlab code for determining the shape and size of the crack tip plastic
zone can be found at the Dryad Digital Repository [51]:https://doi.org/10.5061/dryad.51256.
Authors’ contribution.K.A. performed all of the experimental work and wrote the first draft of the manuscript, D.A. and
C.M.S. conducted the synchrotron diffraction experiments and were involved in their planning, E.A.P. and W.C.W. conceived and supervised the project. All authors contributed to the final manuscript.
Competing interests. We declare we have no competing interests.
Funding. We received no funding for this study.
Acknowledgements. The authors gratefully acknowledge ESRF funding of experiments ME1378 and ME1402 and would
like to thank Dr Andy Fitch at beamline ID22 (ESRF) for his guidance in performing the synchrotron X-ray diffraction experiments. Khurram Amjad is supported by the National Tsing Hua University and University of Liverpool Dual PhD programme.
References
1. Chandawanich N, Sharpe WN. 1979 An experimental study of fatigue crack initiation and growth from coldworked holes.Eng. Fract. Mech.11, 609–620. (doi:10.1016/0013-7944(79)90122-X) 2. Cathey WH, Grandt AF. 1980 Fracture mechanics
consideration of residual stresses introduced by coldworking fastener holes.J. Eng. Mater. Technol.
102, 85–91. (doi:10.1115/1.3224790)
3. Su X, Gu M, Yan M. 1986 A simpliied residual stress model for predicting fatigue crack growth behaviour at coldworked fastener holes.Fatigue Fract. Eng. Mater. Struct.9, 57–64. (doi:10.1111/j.1460-2695.1986.tb01211.x) 4. Clark G. 1991 Modelling residual stresses and fatigue
crack growth at cold-expanded fastener holes. Fatigue Fract. Eng. Mater. Struct.14, 579–589. (doi:10.1111/j.1460-2695.1991.tb00684.x) 5. Arora PR, Dattaguru B, Hande HSS. 1992 The fatigue
crack growth rate in L-72 Al-alloy plate specimens with cold worked holes.Eng. Fract. Mech.42, 989–1000. (doi:10.1016/0013-7944(92) 90138-5)
6. Ball DL, Lowry DR. 1998 Experimental investigation on the efects of cold expansion of fastener holes. Fatigue Fract. Eng. Mater. Struct.21, 17–34. (doi:10.1046/j.1460-2695.1998.00430.x) 7. Stefanescu D. 2004 Measurement and prediction of
fatigue crack growth from cold expanded holes. Part 2: Prediction of fatigue crack growth from cold expanded holes.J. Strain Anal. Eng.39, 41–52. (doi:10.1177/030932470403900104) 8. Fitzpatrick ME, Edwards L. 1998 Fatigue
crack/residual stress ield interactions and their implications for damage-tolerant design.J. Mater. Eng. Perform.7, 190–198. (doi:10.1361/105994998 770347918)
9. Pavier MJ, Poussard CGC, Smith DJ. 1999 Efect of residual stress around cold worked holes on fracture under superimposed mechanical load.Eng. Fract.
Mech.63, 751–773. (doi:10.1016/S0013-7944(99) 00050-8)
10. Cannon D, Sinclair J, Sharpe K. 1986 Improving the fatigue performance of bolt holes in railway rails by cold expansion. InFatigue life: analysis and prediction: proceedings of the fatigue program and related papers presented at the Int. Conf. and Exp. on Fatigue, Corrosion Cracking, Fracture Mechanics and Failure Analysis, Salt Lake City, UT, 2–6 December (ed. V Goel), pp. 353–369. ASM.
11. Stefanescu D, Dutta M, Wang DQ, Edwards L, Fitzpatrick ME. 2003 The efect of high compressive loading on residual stresses and fatigue crack growth at cold expanded holes.J. Strain Anal. Eng.
38, 419–427. (doi:10.1243/03093240360713478) 12. Hermann R, Mofatt J. 1992 Experiments and
analysis of the fatigue life improvement in fastener holes of aluminium-lithium alloy 2091. In Aluminium-lithium: Proc. 6th Int. Aluminium-Lithium Conf.(ed. JW Peter). DGM Informationsgesellschaft Verlag.
13. Özdemir AT, Edwards L. 1997 Relaxation of residual stresses at cold-worked fastener holes due to fatigue loading.Fatigue Fract. Eng. Mater. Struct.20, 1443–1451. (doi:10.1111/j.1460-2695.1997.tb01501.x) 14. Stefanescu D. 2004 Measurement and prediction of fatigue crack growth from cold expanded holes. Part 1: The efect of fatigue crack growth on cold expansion residual stresses.J. Strain Anal. Eng.39, 25–38. (doi:10.1177/030932470403900103) 15. Stefanescu D, Steuwer A, Owen RA, Nadri B,
Edwards L, Fitzpatrick ME, Withers PJ. 2004 Elastic strains around cracked cold-expanded fastener holes measured using the synchrotron X-ray difraction technique.J. Strain Anal. Eng.39, 459–469. (doi:10.1243/0309324041896470) 16. Maximov JT, Duncheva GV, Mitev IN. 2009
Modelling of residual stress relaxation around cold expanded holes in carbon steel.J. Constr. Steel Res.
65, 909–917. (doi:10.1016/j.jcsr.2008. 07.020)
17. Chakherlou TN, Yaghoobi A. 2010 Numerical simulation of residual stress relaxation around a cold-expanded fastener hole under longitudinal cyclic loading using diferent kinematic hardening models. Fatigue Fract. Eng. Mater. Struct.33, 740–751. (doi:10.1111/j.1460-2695.2010. 01485.x)
18. Lacarac V, Smith D, Pavier M, Priest M. 2000 Fatigue crack growth from plain and cold expanded holes in aluminium alloys.Int. J. Fatigue22, 189–203. (doi:10.1016/S0142-1123(99)00126-7)
19. Backman D, Cowal C, Patterson EA. 2010 Analysis of the efects of cold expansion of holes using thermoelasticity and image correlation.Fatigue Fract. Eng. Mater. Struct.33, 859–870. (doi:10.1111/j.1460-2695.2010.01472.x) 20. Pitarresi G, Patterson EA. 2003 A review of the
general theory of thermoelastic stress analysis.J. Strain Anal. Eng.38, 405–417. (doi:10.1243/03093240 360713469)
21. Tomlinson RA, Nurse AD, Patterson EA. 1997 On determining stress intensity factors for mixed mode cracks from thermoelastic data.Fatigue Fract. Eng. Mater. Struct.20, 217–226. (doi:10.1111/j.1460-2695. 1997.tb00279.x)
22. Diaz FA, Patterson EA, Tomlinson RA, Yates JR. 2004 Measuring stress intensity factors during fatigue crack growth using thermoelasticity.Fatigue Fract. Eng. Mater. Struct.27, 571–583. ( doi:10.1111/j.1460-2695.2004.00782.x)
23. Muskhelishvili NI. 1977Some basic problems of the mathematical theory of elasticity. Dordrecht, The Netherlands: Springer Science+Business Media B.V.
23
rsos
.ro
yalsociet
ypublishing
.or
g
R.
Soc
.open
sc
i.
4
:17
1100
...25. ASTM Standard E8/E8M. 2011Standard test methods for tension testing of metallic materials. West Conshohocken, PA: ASTM International. Seehttp:// www.astm.org.
26. ASTM Standard E646-07. 2007Standard test method for tensile strain-hardening exponents(n-values)of metallic sheet materials. West Conshohocken, PA: ASTM International. Seehttp://www.astm.org. 27. FTI process speciication 8101 J. 2014Cold expansion
of holes using the standard split sleeve system and countersink cold expansion. Seattle, WA: Fatigue Technology Inc. Seehttp://www.fatiguetech.com. 28. Pilkey WD, Pilkey DF. 2008Peterson’s stress
concentration factors. New Jersey, NJ: John Wiley & Sons.
29. Pell RA, Beaver PW, Mann JY, Sparrow JG. 1989 Fatigue of thick-section cold expanded holes with and without cracks.Fatigue Fract. Eng. Mater. Struct.
12, 553–567. (doi:10.1111/j.1460-2695.1989. tb00563.x)
30. Clausen B, Lorentzen T, Lefers T. 1998 Self-consistent modelling of the plastic deformation of fcc polycrystals and its implications for difraction measurements of internal stresses. Acta Mater.46, 3087–3098. ( doi:10.1016/S1359-6454(98)00014-7)
31. Webster PJ, Oosterkamp LD, Browne PA, Hughes DJ, Kang WP, Withers PJ, Vaughan GBM. 2001 Synchrotron X-ray residual strain scanning of a friction stir weld. J. Strain Anal. Eng.36, 61–70. (doi:10.1243/0309324011512612) 32. Owen R, Preston R, Withers P, Sherclif H, Webster
P. 2003 Neutron and synchrotron measurements of residual strain in TIG welded aluminium alloy 2024. Mater. Sci. Eng. A.346, 159–167. ( doi:10.1016/S0921-5093(02)00547-6)
33. James MN, Hattingh DG, Hughes DJ, Wei L-W, Patterson EA, Da Fonseca JQ. 2004 Synchrotron difraction investigation of the distribution and inluence of residual stresses in fatigue. Fatigue Fract. Eng. M.27, 609–622. ( doi:10.1111/j.1460-2695.2004.00789.x)
34. Ganguly S, Fitzpatrick ME, Edwards L. 2006 Use of neutron and synchrotron X-ray difraction for evaluation of residual stresses in a 2024-T351 aluminum alloy variable-polarity plasma-arc weld. Metall. Mater. Trans. A.37, 411–420. (doi:10.1007/ s11661-006-0012-3)
35. Khan MK, Fitzpatrick ME, Hainsworth SV, Evans AD, Edwards L. 2011 Application of synchrotron X-ray difraction and nanoindentation for the determination of residual stress ields around scratches.Acta Mater.59, 7508–7520. (doi:10.1016/j.actamat.2011.08.034) 36. Hughes DJ, James MN, Hattingh DG, Webster PJ.
2003 The use of combs for evaluation of strain-free references for residual strain measurements by neutron and synchrotron X-ray difraction.J. Neutron Res.11, 289–293. (doi:10.1080/102381 60410001726765)
37. Özdemir A, Edwards L. 1996 Measurement of the three-dimensional residual stress distribution around split-sleeve cold-expanded holes.J. Strain Anal. Eng.31, 413–421. (doi:10.1243/03093247 V316413)
38. Lacarac VD, Smith DJ, Pavier MJ. 2001 The efect of cold expansion on fatigue crack growth from open holes at room and high temperature.Int. J. Fatigue
23, 161–170. (doi:10.1016/S0142-1123(01) 00125-6)
39. Stefanescu D. 2003 Experimental study of double cold expansion of holes.J. Strain Anal. Eng.38, 339–347. (doi:10.1243/03093240360692922) 40. Pina JCP, Dias AM, De Matos PFP, Moreira PMGP, De
Castro PMST. 2005 Residual stress analysis near a cold expanded hole in a textured alclad sheet using X-ray difraction.Exp. Mech.45, 83–88. (doi:10.1007/BF02428993)
41. Özdemir A, Edwards L. 2004 Through-thickness residual stress distribution after the cold expansion of fastener holes and its efect on fracturing.J. Eng. Mater. Technol.126,129–135. (doi:10.1115/1.1634278) 42. Lapalme M, Hoseini M, Bocher P, Colle AR, Lévesque
M. 2014 Realistic cold expansion inite element
model and experimental validations for aluminium alloys.Exp. Mech.54, 841–855. ( doi:10.1007/s11340-013-9844-0)
43. Patki AS, Patterson EA. 2010 Thermoelastic stress analysis of fatigue cracks subject to overloads. Fatigue Fract. Eng. Mater. Struct.33, 809–821. (doi:10.1111/j.1460-2695.2010.01471.x) 44. Yang Y, Crimp M, Tomlinson RA, Patterson EA. 2012
Quantitative measurement of plastic strain ield at a fatigue crack tip.Proc. R. Soc. A468, 2399–2415. (doi:10.1098/rspa.2011.0682)
45. Amjad K, Wang WC, Patterson EA. 2016 A comparison of split sleeve cold expansion in thick and thin plates.J. Strain Anal. Eng.51, 375–386. (doi:10.1177/0309324716642621)
46. JCGM 100: 2008. 2008Evaluation of measurement data: guide to the expression of uncertainty in measurement. Paris, France: Bureau International des Poids et Mesures. Seehttp://www.bipm.org. 47. Handbook-MIL-HDBK-5H. 1998Metallic materials and elements for aerospace vehicle structures. Fort Belvoir, VA: Defense Technical Information Center. 48. Chao L, Xiulin Z. 1992 Efects of cold expansion of a hole on fatigue crack initiation location and life of an LY12CZ alloy.Fatigue Fract. Eng. Mater. Struct.15, 241–247. (doi:10.1111/j.1460-2695.1992.tb01267.x) 49. Yuan X, Yue ZF, Wen SF, Li L, Feng T. 2015 Numerical
and experimental investigation of the cold expansion process with split sleeve in titanium alloy TC4.Int. J. Fatigue77, 78–85. (doi:10.1016/j. ijfatigue.2015.03.014)
50. Wang Y, Zhu Y, Hou S, Sun H, Zhou Y. 2017 Investigation on fatigue performance of cold expansion holes of 6061-T6 aluminum alloy.Int. J. Fatigue95, 216–228. (doi:10.1016/j.ijfatigue. 2016.10.030)