Maximal Strength Development: A Systematic Review
THOMPSON, Steve <http://orcid.org/0000-0001-7674-3685>, ROGERSON,
David <http://orcid.org/0000-0002-4799-9865>, RUDDOCK, Alan
<http://orcid.org/0000-0002-7001-9845> and BARNES, Andrew
<http://orcid.org/0000-0001-8262-5132>
Available from Sheffield Hallam University Research Archive (SHURA) at:
http://shura.shu.ac.uk/25548/
This document is the author deposited version. You are advised to consult the
publisher's version if you wish to cite from it.
Published version
THOMPSON, Steve, ROGERSON, David, RUDDOCK, Alan and BARNES, Andrew
(2019). The Effectiveness of Two Methods of Prescribing Load on Maximal Strength
Development: A Systematic Review. Sports Medicine.
Copyright and re-use policy
See http://shura.shu.ac.uk/information.html
Vol.:(0123456789) https://doi.org/10.1007/s40279-019-01241-3
SYSTEMATIC REVIEW
The Effectiveness of Two Methods of Prescribing Load on Maximal
Strength Development: A Systematic Review
Steve W. Thompson1 · David Rogerson1 · Alan Ruddock1 · Andrew Barnes1
© The Author(s) 2019
Abstract
Background Optimal prescription of resistance exercise load (kg) is essential for the development of maximal strength.
Two methods are commonly used in practice with no clear consensus on the most effective approach for the improvement of maximal strength.
Objective The primary aim of this review was to compare the effectiveness of percentage 1RM (% 1RM) and repetition
maximum targets (RM) as load prescription methods for the development of maximal strength.
Methods Electronic database searches of MEDLINE, SPORTDiscus, Scopus, and CINAHL Complete were conducted in
accordance with PRISMA guidelines. Studies were eligible for inclusion if a direct measure of maximal strength was used, a non-training control group was a comparator, the training intervention was > 4 weeks in duration and was replicable, and participants were defined as healthy and between the ages of 18–40. Methodological quality of the studies was evaluated using a modified Downs and Black checklist. Percentage change (%) and 95% confidence intervals (CI) for all strength-based training groups were calculated. Statistical significance (p < 0.05) was reported from each study.
Results Twenty-two studies comprising a total of 761 participants (585 males and 176 females) were found to meet the
inclu-sion criteria. 12 studies were returned for % 1RM, with 10 for RM. All studies showed statistically significant improvements in maximal strength in the training groups (31.3 ± 21.9%; 95% CI 33.1–29.5%). The mean quality rating for all studies was 17.7 ± 2.3. Four studies achieved a good methodological rating, with the remainder classified as moderate.
Conclusions Both % 1RM and RM are effective tools for improving maximal strength. % 1RM appears to be a better
prescrip-tive method than RM potentially due to a more sophisticated management of residual fatigue. However, large heterogeneity was present within this data. Lower body and multi-joint exercises appear to be more appropriate for developing maximal strength. Greater consensus is required in defining optimal training prescriptions, physiological adaptations, and training status.
Electronic supplementary material The online version of this article (https ://doi.org/10.1007/s4027 9-019-01241 -3) contains supplementary material, which is available to authorized users.
* Steve W. Thompson
1 Academy for Sport and Physical Activity, Sheffield Hallam
University, Sheffield, UK
1 Introduction
Resistance training is important for athletic development and is underpinned by 50 + years of peer-reviewed evidence [1–3]. Resistance training is employed to develop maximal strength, but can also be used to enhance speed, agility, rate of force development (RFD), hypertrophy, muscular endurance, motor control, balance, and coordination [1].
Sport-specific technical skills such as jumping, sprinting, and change of direction can also be improved following this type of training [2, 4]. Maximal strength can be defined as one’s ability to exert maximal force against an external resistance and requires a maximal voluntary contraction [3, 5], and is associated with many of the aforementioned physical qualities [4]. Optimising the prescription of resist-ance training is, therefore, an important consideration for the strength and conditioning practitioner.
maximal strength, specifically the manipulation of training volume and load [8–10].
Optimising load prescription is essential for the effec-tive development of maximal strength [9, 11, 12]. Load can be prescribed using a two-part method: 1) undertaking a dynamic maximal strength test [1 repetition maximum (1RM), for example] and 2) prescribing submaximal per-centage loads based upon the initial 1RM (e.g., 85% of 1RM) (% 1RM) or repetition maximum targets (e.g., 5RM) (RM) [6, 7]. Both these methods of load prescription are com-mon in practice and research; however, the most effective in developing maximal strength is still yet to bet determined.
Training programmes based on the % 1RM load pre-scription method use submaximal percentages based off the maximal load an individual can lift (1RM) [13, 14]. Pro-ponents of this method suggest that it is more favourable than using RM targets when implementing an undulated approach to training due to the ability to prescribe light and heavy days across a week, control for different proximities to failure, and provide a more objective programming strat-egy for individuals [15, 16]. Conversely, providing indi-viduals with RM targets allows for a more auto-regulatory approach in which the RM target dictates the load [14]. Sup-porters of this method suggest that due to daily fluctuations in strength based upon a number of factors such as sleep, residual fatigue, and nutritional status; RM targets can pro-vide a more flexible programming strategy than % 1RM and reduce the number of required direct or indirect strength assessments [14]. However, using RM targets, similar to that of more novel methods such as repetitions in reserve (RIR)—the quantification of training intensity by assigning the number of repetitions still able to perform immediately following a working set in accordance with a 1–10 scale of
effort (e.g., 1 = 1 rep, 0 = 0 reps etc.)—require the individual to subjectively adjust loads, potentially resulting in inaccu-rate or inappropriate prescriptions [17, 18].
Comparative charts and tables have previously been designed to provide an interchangeable approach between % 1RM and RM targets [6]. However, research has highlighted that the repetition–load continuum can vary dependent on the population (trained vs. untrained or strength vs. endur-ance, for example) [19–22]. Descorges et al. [20] highlighted differences in the number of repetitions performed when comparing four different types of athletes (handball vs. pow-erlifters vs. swimmers vs. rowers). The more strength-based athletes performed significantly lower repetitions across multiple percentages of 1RM compared to the endurance-based athletes. These results were similar to Richens et al. [21]. Repetition maximum targets and repetitions to failure have also been previously provided to predict 1RM [20, 23,
24]. Mayhew et al. [23] investigated 14 different predictive equations and observed differences of − 24.0% to 27.1% in some equations when compared to the direct assess-ment in bench press. Similarly, Garcia-Ramos et al. [24] compared two predictive equations when lifting to failure in the prone bench-pull, with the largest differences being − 3.6 ± 5.38 kg. The various RM targets associated with dif-ferent % 1RM values demonstrates that pre-defined rep-load continuums may not be appropriate and the two methods of prescribing training load are not interchangeable with one another, and therefore, their individual effectiveness needs to be assessed.
To date, only one study has directly compared the two aforementioned methods of load prescription [25]. 15 healthy male participants were split into two training groups (relative intensity vs. RM targets) and were asked to com-plete a volume-equated and exercise-matched 10 week block-periodised resistance training intervention (3 × days per week). The RM group worked to a maximum in each training session (the final set performed must be a true RM), whereas the relative intensity group worked to percentages of the maximum set/repetition combinations. This relative intensity method allowed for the perturbations in strength levels to be accounted for whilst still working to individual percentages of 1RM. Carroll et al. [25] observed greater improvements in vertical jump performance, RFD, and max-imal strength (peak force) during an isometric mid-thigh pull assessment in the relative intensity group compared to the RM group. These differences were attributed to a greater training stress in the RM group due to the consistent training to failure prescribed each week. Despite encouraging results in the favour of % 1RM prescriptions, more investigation is required to determine the efficacy of each method, and pro-vide more robust recommendations as to which is the best method to adopt in practice.
Key Points
Prescribing load via percentages of 1RM appears to be a better method for improving maximal strength than rep-etition maximum targets due to a more comprehensive management of residual fatigue.
Multi-joint, compound, lower body exercises elicited a greater improvement in maximal strength than single-joint, isolated, upper body exercises.
The purpose of this review is to assist practitioners’ understanding of methods used to prescribe load. There are a number of prescriptive approaches available to strength and conditioning (S&C) coaches, but to our knowledge, no study has assessed the most effective tool for developing maximal strength. Therefore, the aim of this systematic review was to compare the effectiveness of % 1RM vs. RM prescriptions as a means of improving maximal strength development. A secondary aim of the review was to investigate the quality of research in this area, to develop recommendations for S&C practitioners and researchers in terms of methodologi-cal approaches and research designs.
2 Methods
This review has been written in accordance with the PRISMA (Preferred Reporting Items for Systematic Reviews and Meta-analyse) statement [26].
2.1 Literature Search
Literature searches were originally performed on 11th Octo-ber 2017 and then updated on 30th August 2018, 14th March 2019, and 13th September 2019 using the electronic search engines SPORTDiscus, MEDLINE, Scopus, and CINAHL Complete. Searches were performed using titles, abstracts, and keywords, utilising Medical Subject Headings (MeSH), indexing terms, and Boolean operators (AND/OR/NOT). Terms were grouped into themes relating to resistance training, prescriptive methods, and age. For SPORTDiscus, the following search terms were used; ‘resistance exer* or resistance train* or resistance strength* or resistance load*’, ‘musc* strength or strength train*’, ‘Musc* power or power train*’, ‘rate of force development or RFD’, ‘weight lift* or weight train*’, ‘olympic lift*’ AND ‘1RM or rep* max*’, ‘rep* to fatigue or RTF or predict* equation or AMRAP’ NOT ‘senior or elder* or old’, ‘supplement*’, ‘obes* or overweight or blood flow restrict*’, ‘Injur*’. All searches were conducted by the lead author (ST) and developed in consultation with an information scientist. The search strat-egy was piloted and refined prior to being implemented.
Search results were collated using EndNote software (Thomson Reuters, New York) with duplicates removed automatically (EndNote) and manually (ST). The remaining titles and abstracts were screened for relevance by the lead author. Of those that were deemed potentially relevant, full texts were obtained and independently assessed for eligibil-ity by the lead author, with a random sample (10%) inde-pendently assessed by two of the research team (DR, AB). The included studies were then independently assessed by a second author (AR). If the inclusion of a study could not be agreed upon, a third author facilitated a discussion to reach
a consensus. Reference lists of each study were manually searched to identify potentially relevant studies (ST).
2.2 Inclusion and Exclusion Criteria
Studies were deemed eligible if they met the following criteria:
• A direct, practical measure of strength was employed (1RM).
• A non-resistance training, control group was used as a comparator.
• The control group continued normal daily activities with-out additional exercise that would influence strength.
• The training intervention was progressive.
• The methods section contained sufficient information for the training intervention to be fully replicable.
• The training intervention was strength-based, isotonic exercise lasting for a minimum of 4 weeks.
• No form of concurrent training was prescribed (plyomet-ric and/or endurance).
• Participants were aged 18–40.
• Full texts were available in English and were original, peer-reviewed, and primary research.
Studies were not excluded based on the sex of the par-ticipants or previous training history. This review did not control for volume matching. It was thought with the focus being prescribing load, only including studies that also matched training volumes would reduce the inclusivity of the search. In the event a study used multiple groups and only some conditions met the inclusion criteria, only the relevant data was extracted.
2.3 Data Extraction Process
2.4 Methodological Quality Assessment
Methodological quality was assessed using the Downs and Black [27] quality assessment tool, as modified by Davies et al. [28]. This quality assessment tool was deemed more appropriate than other tools (Cochrane and PEDro, for example) due to its greater suitability to a non-clinical inter-vention [29–32]. A detailed description of each criterion can be found elsewhere [27]. Briefly, of the 29 points available, 20 + was deemed as a ‘good’ methodology, 11–19 moderate, and < 11 as poor quality. This process was independently assessed by two authors (ST/AR). Any disputes were settled through discussion with a third author (DR).
3 Results
3.1 Description of Studies
Figure 1 details the PRISMA [30] flow chart. A total of 22 studies [33–54], totalling 761 participants (585 males and 176 females), were eligible for review. Sample sizes ranged from 17 to 120 participants, with numbers for experimental and control groups ranging from 5 to 47 participants. Mean ages ranged from 20.0 ± 1.8 to 31.6 ± 9.8 across all studies (see Table 1 for all participant characteristics). Of the two prescriptive methods (% 1RM, and RM), 12 studies utilised the % 1RM prescriptive approach and 10 employed the RM prescriptive approach.
15 studies assessed lower body strength (seated plantar-flexion, knee extension, knee plantar-flexion, leg press, back squat, half squat, Clean and Jerk, and hip thrust) three studies assessed upper body strength (bicep curl, triceps exten-sion and bench press) [35, 44, 50] and the remaining four assessed a combination of upper and lower body strength (bicep curl, leg press, back squat, latissimus-dorsi pull-down, ab-board, back extension, and upright row) [38,
42, 43, 48]. There was an 11.9% greater improvement in maximal strength when assessing upper body vs. lower body exercises (Table 4). All studies reported pre-and post-intervention data for experimental and control groups (see Table 2 for all training intervention details).
3.2 Improvements in Maximal Strength
A summary of the strength developments can be found in Table 3. All 22 studies documented statistically significant (P < 0.05) improvements in maximal strength for the training groups (31.3 ± 21.9%; 95% CI 33.1–29.5%) in comparison with their respective control groups (3.4 ± 4.3%; 95% CI 3.9–2.9%); 20 studies presented data in absolute values (kg), with two reporting relative (1RM/body mass) (Table 3).
The training groups utilising a percentage-based load prescription significantly improved maximal strength
by 28.8 ± 20.2% (95% CI 31.4–26.2%) compared to 34.5 ± 23.5% (95% CI 37.0–32.0%) for the training groups utilising a repetition maximum based load prescription (p < 0.05) (Table 4). When removing data derived from Cam-pos et al. [37], which were seemingly outliers and skewed the data, maximal strength increased by 24.2 ± 10.81% (95% CI 23.1–15.4%) for the repetition maximum-based load pre-scriptive method.
3.3 Periodised Approaches
Five studies employed a periodised approach to their pro-gramming (daily undulating, linear or block) [35, 36, 40,
45, 46]. Twelve studies adjusted load by an auto-regulatory increase when a target was met (RM or %) [33, 34, 36–38,
41, 43, 44, 47, 51–53]; 8 studies employed mid-point 1RM tests (ranging from every 2–6 weeks) [35, 39, 42, 45, 46,
49, 50, 54]; 1 study did not report how they adjusted load [48]; and 1 study increased the volume, but kept the load constant [40].
3.4 Training Variables
Training interventions ranged from 4 to 18 weeks across all studies, with 2–3 sessions per week being prescribed. Further analysis detailed a 4.9–5.5% greater improvement in maximal strength, measured via direct 1RM assess-ments in multiple moveassess-ments/exercises across all 22 stud-ies when prescribing an intervention over a longer duration (> 6 weeks). The magnitude of the improvements, however, decreased after 6 weeks (Table 4). Nine studies implemented an intervention containing only one exercise [33–35, 44,
45, 47, 49, 50, 53], with four of those employing a multi-joint exercise (e.g., back squat) [44, 45, 47, 53]. 11 studies employed between two and five exercises within the inter-vention [36–42, 46, 51, 52, 54], with two studies prescrib-ing more than five [43, 48]. Six studies employed single joint or isolated exercises only [33–35, 49–51], with the rest prescribing multi-joint or a combination of the two. Maxi-mal strength increased by 5.4% more in multi-joint, com-pound exercises compared to single-joint, isolation exercises (Table 4). Exercise specifics for the training groups were 1–6 sets of 3–28 reps, with 1–5 min rest periods. Training intensities ranged from 15 to 120% baseline 1RM-testing scores or 3–28RM. All studies either employed a ‘traditional or normal’ speed of movement (1–2 s for eccentric and 1 s for concentric) or did not control for tempo of movement.
3.5 Participants and Training Status
study did not provide a definition [35]. One study required a minimum 1RM in the bench press of 100 kg; however, due to recruitment issues, this was reduced to 60 kg [44]. The fourth study required the participants to be technically proficient in the back squat [45]. One study reported that the participants had previous strength training at recreational level, but underwent no strength training for 3 months lead-ing up to the study [40], and one study accepted participants who were training less than twice per week for 6 months leading up to the study [49].
The remaining studies recruited non-resistance trained participants ranging from 3 months to 5 years without any form of resistance training. 10 studies used Univer-sity or College students; seven described their participants
as ‘healthy’ and four described them as ‘untrained’. The remaining two studies recruited either University or team-sports athletes. The control group across all studies were reported to have ‘maintained normal daily activities’ or to have ‘undertaken no resistance or endurance training’ throughout the duration of the intervention period; however, no study reported how this was controlled for.
3.6 Methodological Quality
The mean ± SD methodological quality rating score was 17.7 ± 2.3 out of a possible 29, with a range of 14–23 (Table 5). Only four studies achieved a methodo-logical quality rating of good, which was categorised as a
Records idenfied through database searching
(n = 7851) MEDLINE (n = 2446)
Scopus (n = 2180) SPORTDiscus (n = 1848) CINAHL Complete (n = 1377)
Include
d
Idenficaon
Records aer duplicates removed (n = 5100)
Records remaining aer tle and abstract screenings
(n = 531)
Records excluded (n = 4569)
Full-text arcles assessed for eligibility
(n = 532) Full-text arcles excluded (n = 510)
No direct measure of strength (1RM) (n = 44) No control group (n = 212) Control group inappropriate (n = 59)
Training intervenon non-replicable/progressive (n = 19) Intervenon non-strength/Isotonic training (n = 33)
Training intervenon < 4 weeks (n = 27) Concurrent training (n = 25) Parcipants not aged 18-40 (n = 48)
Data not extractable (n = 1) Non-English (n = 9) Full text unavailable (n = 33) Studies included in
systemac review (n = 22) Systemac review
reference check “snowballing”
(n = 1)
Screenin
g
Eligibilit
y
[image:6.595.77.519.52.489.2]Table 1 Study c har acter istics Study Par ticipants ( n ) Gr oups (+ par tici
-pant numbers (
n )) Se x ( n ) Ag e (y ears ± SD)
Body mass (kg ±
SD) St atur e (cm ± SD) Resis tance tr aining exper ience Par ticipant c har ac -ter isation W eiss e t al. (1988) [ 33 ] 56
RT (28) C (28) M (28) F (28)
20.8 ± 1.8 NR NR NR T < 3 mont hs Healt hy Br ait h e t al. (1993) [ 34 ] 58
RT (47) C (11) M (33) F (25)
24.0 ± 4.0 70.1 ± 9.0 174.0 ± 6.3 NR T < 1 y ear Untr ained 25.0 ± 5.0 74.3 ± 14.5 172.6 ± 6.6 Moss e t al. (1997) [ 35 ] 31
RT—G90 (9) RT—G35 (11) RT—G15 (10)
M 22.7 ± 3.4 75.8 ± 5.6 179.0 ± 6.8 W ell-tr ained Univ ersity s tudents
(non-dominant arm
= contr ol gr oup) 24.0 ± 3.4 83.2 ± 8.8 185.7 ± 8.5 22.9 ± 2.8 78.1 ± 10.4 182.6 ± 6.7 Bell e t al. (2000) [ 36 ] 21
RT (11) C (10) M (12) F (9)
22.3 ± 3.3 73.4 ± 11.6 176.0 ± 9.3 N RT Univ ersity s tudents Cam pos e t al. (2002) [ 37 ] 31
RT—LR (9) RT—IR (7) RT—HR (7) C (5)
M 21.1 ± 1.5 80.1 ± 8.4 179.8 ± 6.5 NR T < 6 mont hs Healt hy 20.7 ± 2.9 79.5 ± 7.8 179.6 ± 7.4 20.4 ± 3.5 70.2 ± 9.5 174.3 ± 8.6 31.6 ± 9.8 80.8 ± 23.3 178.1 ± 5.5 McBr ide e t al. (2003) [ 38 ] 28
RT—S1 (9) RT—M6 (9) C (10) M (15) F (13)
22.1 ± 3.4 83.7 ± 29.4 172.8 ± 10.5 NR T (< 6 mont hs) Untr ained 20.0 ± 1.22 70.7 ± 23.0 169.4 ± 11.8 22.4 ± 1.89 70.6 ± 7.8 171.3 ± 7.2 W illoughb y (2004) [ 39 ] 22
RT (12) C (10)
M 20.9 ± 2.76 78.7 ± 6.2 176.5 ± 7.1 NR T < 6 mont hs Untr ained Tr icoli e t al. (2005) [ 40 ] 14
RT (7) C (7)
M 22.0 ± 1.5 73.4 ± 10.4 179.4 ± 8.8 NR T < 3 mont hs (tr ained pr ior) Colleg e s tudents Rana e t al. (2008) [ 41 ] 16
RT (9) C (7)
F 20.6 ± 1.9 64.1 ± 7.9 165.6 ± 4.9 N RT Untr ained 22.9 ± 2.4 72.5 ± 15.0 163.6 ± 4.5 Tanimo to e t al. (2008) [ 42 ] 24
RT (12) C (12)
M 19.5 ± 0.5 63.8 ± 4.0 174.8 ± 4.3 N RT Healt hy 19.8 ± 0.7 64.2 ± 4.0 174.3 ± 7.2 Ter zis e t al. (2008) [ 43 ] 17
RT (11) C (6)
M 22.0 ± 1.0 85.0 ± 4.0 184.0 ± 3.0 NR T < 1 y ear P.E s tudents Har tmann e t al. (2009) [ 44 ] 40
RT—SPP (13) RT—UP (14) C (13)
M 24.31 ± 3.2 84.7 ± 11.2 183.9 ± 7.2
RT in BP (mini
-mum 1RM of 100 k
g)
Spor
t science s
tu -dents 25.14 ± 4.0 79.4 ± 10.4 177.6 ± 7.5 24.77 ± 3.1 74.4 ± 12.1 180.5 ± 8.1 Cor mie e t al. (2010) [ 45 ] 16
RT (8) C (8)
M 23.9 ± 4.8 79.8 ± 12.0 180.0 ± 6.4 NR T (T ec hnicall y pr
oficient in BS)
Healt hy Cht our ou e t al. (2012) [ 46 ] 30 RT—MT G (10) RT—ET G (10) C (10) M 22.9 ± 1.3 72.0 ± 8.8 180.0 ± 5.0 NR T < 6 mont hs P.E s tudents W eier e t al. (2012) [ 47 ] 12
RT (6) C (6) M (6) F (6)
Mean ± SD st andar d de viation 1RM 1 r epe tition maximum, BG bilater al tr aining g roup, C contr ol, cm centime tres, BP benc h pr ess, BS bac k sq uat, ETG ev ening tr aining g roup, F female, G15
15% load g
roup, G35 35% load gr oup, G90
90% load g
roup, HR high-r epe tition g roup, HV high v olume, IR inter mediate-r epe tition g roup, kg kilog rams, LP leg pr ess g roup, LR lo w-r epe tition g roup, LV lo w v olume, M male, M6 six se t tr aining g roup, M TG mor ning tr aining g roup, MV moder ate v olume, n number , NP non-per iodised g roup, N RT no r esis tance tr aining, NR no t r epor ted, P. E Ph ysical Education, RT resis tance tr aining, S1 1 se t tr aining g roup, SPP str engt h-po wer per iodisation, SQ sq uat g roup, TP tr aditional per iodisation g roup, UG unilater al tr aining g roup, UP dail
y undulating per
iodised gr oup Table 1 (continued) Study Par ticipants ( n ) Gr oups (+ par tici
-pant numbers (
n )) Se x ( n ) Ag e (y ears ± SD)
Body mass (kg ±
SD) St atur e (cm ± SD) Resis tance tr aining exper ience Par ticipant c har ac -ter isation Nacler io e t al. (2013) [ 48 ] 32 RT—L V (6)
RT—MV (6) RT—HV (8) C (7) M (20) F (12)
23.3 ± 1.2 66.4 ± 11.0 169.9 ± 8.4 NR T < 5 y ears Team spor ts at hle tes
Soccer (20) (M) Volle
yball (12) (F)
23.3 ± 1.4 71.4 ± 8.5 173.3 ± 7.6 23.9 ± 2.0 69.4 ± 12.5 173.0 ± 9.8 22.1 ± 1.1 71.1 ± 14.2 169.7 ± 6.9 Aguiar e t al. (2015) [ 49 ] 18
RT (9) C (9)
M 20.9 ± 2.0 73.7 ± 9.4 173.8 ± 6.9 NR T < 6 mont hs Healt hy 20.0 ± 1.8 75.0 ± 8.8 176.4 ± 8.1 Ak agi e t al. (2016) [ 50 ] 23
RT (13) C (10)
M 22.1 ± 1.1 61.4 ± 5.8 170.6 ± 5.8 NR
T upper body (< 6 mont
hs) Healt hy Bo tton e t al. (2016) [ 51 ] 43
RT—UG (14) RT—BG (15) C (14)
F 24.8 ± 1.4 60.8 ± 6.4 163.0 ± 6.5 NR T < 3 mont hs Healt hy 24.3 ± 3.7 57.0 ± 4.8 160.2 ± 5.8 22.7 ± 2.8 58.0 ± 5.7 163.6 ± 6.2 W irt h e t al. (2016) [ 52 ] 120
RT—SQ (43) RT—LP (40) C (37)
M 23.7 ± 2.7 81.6 ± 9.8 181.7 ± 7.5 NR Students 23.8 ± 2.3 80.5 ± 8.1 180.1 ± 7.0 25.1 ± 2.1 78.2 ± 8.5 181.0 ± 5.7 Jar vis e t al. (2017) [ 53 ] 21
RT (11) C (10) M (15) F (6)
27.5 ± 3.2 72.7 ± 18.0 169.6 ± 10.3 RT > 1 y ear Collegiate at hle tes 27.2 ± 3.4 76.4 ± 11.5 176.2 ± 7.9 Souza e t al. (2018) [ 54 ] 33
RT—NP (8) RT—TP (9) RT—UP (8) C (8)
Table 2 Tr aining par ame ters Study Dur ation (w eek s) Fr eq uency (session × w eek) Ex er cise(s) Se ts ( n ) Reps ( n ) Res t (min)
Load (% 1 RM or RM t
ar ge t) Load adjus tment W eiss e
t al. (1988) [
33 ] 8 3 Seated plant ar fle xion 4 9–13 2–3 9–13 RM
> When RM t
ar ge t ex ceeded Br ait h e
t al. (1993) [
34 ] 18 2–3 Knee e xtension 1 7–10 NR 7–10 RM
> 5% when RM t
ar ge t ex ceeded Moss e
t al. (1997) [
35 ] 9 3 Elbo w fle xion 3–5
10 (G15) 7 (G35) 2 (G90)
NR
G15 (15%) G35 (35%) G90 (90%)
1RM @ 4 w
eek
s
Bell e
t al. (2000) [
36
]
12
3
Bl leg pr
ess, UL knee fle
xion,
UL knee e
xtension, bl calf
raises 2–6 4–12 NR 72–84% > Appr
ox. 4% e
ver y 3 w eek s Cam pos e
t al. (2002) [
37
]
8
2 × w
eek 1–4
3 × w
eek 5–8 Leg pr ess, bac k sq uat, knee extension
LR (4) IR (3) HR (2) 3–5 9–11 20–28 3 2 1 3–5 RM 9–11 RM 20–28 RM
> When RM t
ar ge t ex ceeded McBr ide e
t al. (2003) [
38
]
12
2
Bicep cur
l, leg pr
ess, c
hes
t
fly
e, sit ups, bac
k e xtension 1–6 1–3 6–10 15 2–3 6–10 RM
> when RM t
ar ge t ex ceeded W illoughb
y (2004) [
39
]
12
3
Leg pr
ess, knee e
xtension, knee fle xion 3 6–8 1.5 85–90%
1RM @ W
eek
s 3, 6, 9, 12
Tr
icoli e
t al. (2005) [
40
]
8
3
High pull, po
wer clean, clean
and jer k, half–sq uat 3–6 4–6 NR 4–6 RM Volume incr eased af ter 4 w eek s Rana e
t al. (2008) [
41
]
6
2 × w
eek 1
3 × w
eek
s 2–6
Leg pr
ess, knee e
xtension, bac k sq uat 3 6–10 2 80–85%
> When RM t
ar ge t ex ceeded Tanimo to e
t al. (2008) [
42 ] 13 2 Bac k sq uat, benc h pr ess,
latissimus-dorsi pull do
wn,
abdominal bend, bac
k
extension
3 (+
1 WU se
t)
8
1
80–90%
1RM @ 7 w
eek
s
Ter
zis e
t al. (2008) [
43
]
14
2 × w
eek 1–2
3 × w
eek 3–14
Leg pr
ess (45° inclination),
semi-sq
uat (knees 90°),
benc h pr ess, ar m cur l, o ver -head pr ess, elbo w e xtension (pulle
y), seated r
ow
, sit ups,
bac k e xtension 2–3 6–20 NR
8–10 RM 6 RM
Dail
y >
to mee
t RM t
ar
ge
t
Har
tmann e
t al. (2009) [
44 ] 14 3 Benc h pr ess 5 3–25 1.5–5
3–5 RM 8–12 RM 20–25 RM
> 2–10 k
g when RM
tar ge t e xceeded Cor mie e
t al. (2010) [
45 ] 10 3 Bac k sq uat 3–7 3–6 3–5 75–90%
1RM @ W
eek 5
Cht
our
ou e
t al. (2012) [
46
]
8
3
Knee e
xtension, knee fle
xion, bac k sq uat 3–6 3–6 2–9 60–120%
1RM @ W
eek 4
W
eier e
t al. (2012) [
47 ] 4 3 Bac k sq uat 6–9 6–8 3 80%
> 2–5% when t
ar
ge
t
ex
1RM
1 r
epe
tition maximum, BL bilater
al,
G15
15% load g
roup,
G35
35% load g
roup,
G90
90% load g
roup,
HR
high–r
epe
tition g
roup,
IR
inter
mediate–r
epe
tition g
roup,
kg
kilog
rams
LR
lo
w-repe
tition g
roup,
min
minutes,
n
number
,
NR
no
t r
epor
ted,
RM
repe
tition maximum,
UL
unilater
al,
SA
sing
le ar
m,
WU
w
ar
m up
Table
2
(continued)
Study
Dur
ation
(w
eek
s)
Fr
eq
uency (session
× w
eek)
Ex
er
cise(s)
Se
ts (
n
)
Reps (
n
)
Res
t (min)
Load (% 1 RM or RM t
ar
ge
t)
Load adjus
tment
Nacler
io e
t al. (2013) [
48
]
6
3
Tp 1: Benc
h pr
ess, incline benc
h
pr
ess, dumbbell fly
, upr
ight
ro
w, later
al r
aise,
Pos
ter
ior later
al r
aise, barbell
bicep cur
l
Dumbbell bicep cur
l,
mac
hine bicep cur
l
Tp 2: Smit
h mac
hine par
allel sq
uat,
leg pr
ess, knee e
xtension,
latissimus dorsi pull do
wn,
seated r
ow
, sa dumbbell
ro
w, mac
hine tr
iceps e
xten
-sion, s
tanding tr
iceps push
-do
wn, sa tr
iceps e
xtension
1–3
8
3
75%
NR
Aguiar e
t al. (2015) [
49
]
8
2
Knee e
xtension
3
8–12
1
75%
1RM @ 15 da
y inter
vals
Ak
agi e
t al. (2016) [
50
]
6
3
Tr
iceps e
xtension
5
8
1.5
80%
1RM e
ver
y 2 w
eek
s
Bo
tton e
t al. (2016) [
51
]
8
2
Ul knee e
xtension
Bl knee e
xtension
2–4
5–15
1–3
12–15 RM 9–12 RM 7–10 RM 5–8 RM
1–5 k
g when RM t
ar
ge
t
ex
ceeded
W
irt
h e
t al. (2016) [
52
]
8
2
Bac
k sq
uat, leg pr
ess
5
4–10
5
8–10 RM 6–8 RM 4–6 RM
> 2.5–10 k
g when RM
tar
ge
t e
xceeded
Jar
vis e
t al. (2017) [
53
]
8
3
Hip t
hr
us
t
5
5
3
85%
> 2.5% when RM t
ar
ge
t
ex
ceeded
Souza e
t al. (2018) [
54
]
12
2
Bac
k sq
uat
Knee e
xtension
2–4
4–12
2–3
4–12 RM
1RM @ w
eek
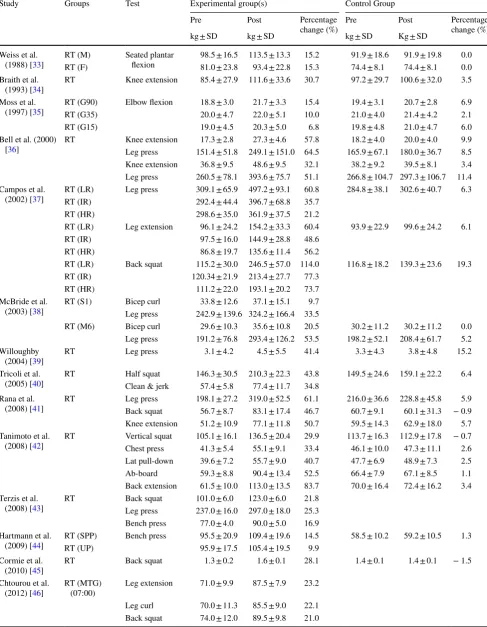
Table 3 Summary of the changes in maximal strength following an intervention compared to a non-training control
Study Groups Test Experimental group(s) Control Group Pre Post Percentage
change (%) Pre Post Percentage change (%) kg ± SD kg ± SD kg ± SD Kg ± SD
Weiss et al.
(1988) [33] RT (M)RT (F) Seated plantar flexion 98.5 ± 16.5 113.5 ± 13.381.0 ± 23.8 93.4 ± 22.8 15.215.3 91.9 ± 18.674.4 ± 8.1 91.9 ± 19.874.4 ± 8.1 0.00.0 Braith et al.
(1993) [34] RT Knee extension 85.4 ± 27.9 111.6 ± 33.6 30.7 97.2 ± 29.7 100.6 ± 32.0 3.5 Moss et al.
(1997) [35] RT (G90)RT (G35) Elbow flexion 18.8 ± 3.020.0 ± 4.7 21.7 ± 3.322.0 ± 5.1 15.410.0 19.4 ± 3.121.0 ± 4.0 20.7 ± 2.821.4 ± 4.2 6.92.1 RT (G15) 19.0 ± 4.5 20.3 ± 5.0 6.8 19.8 ± 4.8 21.0 ± 4.7 6.0 Bell et al. (2000)
[36] RT Knee extensionLeg press 151.4 ± 51.8 249.1 ± 151.0 64.517.3 ± 2.8 27.3 ± 4.6 57.8 165.9 ± 67.1 180.0 ± 36.718.2 ± 4.0 20.0 ± 4.0 9.98.5 Knee extension 36.8 ± 9.5 48.6 ± 9.5 32.1 38.2 ± 9.2 39.5 ± 8.1 3.4 Leg press 260.5 ± 78.1 393.6 ± 75.7 51.1 266.8 ± 104.7 297.3 ± 106.7 11.4 Campos et al.
(2002) [37] RT (LR)RT (IR) Leg press 309.1 ± 65.9 497.2 ± 93.1292.4 ± 44.4 396.7 ± 68.8 60.835.7 284.8 ± 38.1 302.6 ± 40.7 6.3 RT (HR) 298.6 ± 35.0 361.9 ± 37.5 21.2
RT (LR) Leg extension 96.1 ± 24.2 154.2 ± 33.3 60.4 93.9 ± 22.9 99.6 ± 24.2 6.1 RT (IR) 97.5 ± 16.0 144.9 ± 28.8 48.6
RT (HR) 86.8 ± 19.7 135.6 ± 11.4 56.2
RT (LR) Back squat 115.2 ± 30.0 246.5 ± 57.0 114.0 116.8 ± 18.2 139.3 ± 23.6 19.3 RT (IR) 120.34 ± 21.9 213.4 ± 27.7 77.3
RT (HR) 111.2 ± 22.0 193.1 ± 20.2 73.7 McBride et al.
(2003) [38] RT (S1) Bicep curlLeg press 242.9 ± 139.6 324.2 ± 166.4 33.533.8 ± 12.6 37.1 ± 15.1 9.7
RT (M6) Bicep curl 29.6 ± 10.3 35.6 ± 10.8 20.5 30.2 ± 11.2 30.2 ± 11.2 0.0 Leg press 191.2 ± 76.8 293.4 ± 126.2 53.5 198.2 ± 52.1 208.4 ± 61.7 5.2 Willoughby
(2004) [39] RT Leg press 3.1 ± 4.2 4.5 ± 5.5 41.4 3.3 ± 4.3 3.8 ± 4.8 15.2 Tricoli et al.
(2005) [40] RT Half squatClean & jerk 146.3 ± 30.5 210.3 ± 22.357.4 ± 5.8 77.4 ± 11.7 43.834.8 149.5 ± 24.6 159.1 ± 22.2 6.4 Rana et al.
(2008) [41] RT Leg pressBack squat 198.1 ± 27.2 319.0 ± 52.556.7 ± 8.7 83.1 ± 17.4 61.146.7 216.0 ± 36.6 228.8 ± 45.860.7 ± 9.1 60.1 ± 31.3 − 0.95.9 Knee extension 51.2 ± 10.9 77.1 ± 11.8 50.7 59.5 ± 14.3 62.9 ± 18.0 5.7 Tanimoto et al.
(2008) [42] RT Vertical squatChest press 105.1 ± 16.1 136.5 ± 20.441.3 ± 5.4 55.1 ± 9.1 29.933.4 113.7 ± 16.3 112.9 ± 17.8 − 0.746.1 ± 10.0 47.3 ± 11.1 2.6 Lat pull-down 39.6 ± 7.2 55.7 ± 9.0 40.7 47.7 ± 6.9 48.9 ± 7.3 2.5 Ab-board 59.3 ± 8.8 90.4 ± 13.4 52.5 66.4 ± 7.9 67.1 ± 8.5 1.1 Back extension 61.5 ± 10.0 113.0 ± 13.5 83.7 70.0 ± 16.4 72.4 ± 16.2 3.4 Terzis et al.
(2008) [43] RT Back squatLeg press 101.0 ± 6.0237.0 ± 16.0 297.0 ± 18.0123.0 ± 6.0 21.825.3 Bench press 77.0 ± 4.0 90.0 ± 5.0 16.9 Hartmann et al.
(2009) [44] RT (SPP)RT (UP) Bench press 95.5 ± 20.9 109.4 ± 19.695.9 ± 17.5 105.4 ± 19.5 14.59.9 58.5 ± 10.2 59.2 ± 10.5 1.3 Cormie et al.
(2010) [45] RT Back squat 1.3 ± 0.2 1.6 ± 0.1 28.1 1.4 ± 0.1 1.4 ± 0.1 − 1.5 Chtourou et al.
[image:11.595.52.540.75.703.2]score of 20 or above [39, 48, 53, 54]. Other studies scored a ‘moderate’ rating. All studies scored 0 for attempting to blind participants from the intervention and its outcomes.
It was not possible to determine whether participants were recruited over the same time period and whether the inter-vention was concealed from participants and administrators
Mean ± SD
BG bilateral training group, BL bilateral, ETG evening training group, F female, G15 15% load group, G35 35% load group, G90 90% load group, HR high-repetition group, HV high volume, IR intermediate-repetition group, kg kilograms, LP leg press group, LR low-repetition group,
LV low volume, M male, M6 six set training group, MTG morning training group, MV moderate volume, NP non-periodised group,, RT resist-ance training, S1 1 set training group, SD standard deviation, SPP strength-power periodisation, SQ squat group, TP traditional periodisation group, UG unilateral training group, UP daily undulating periodised group
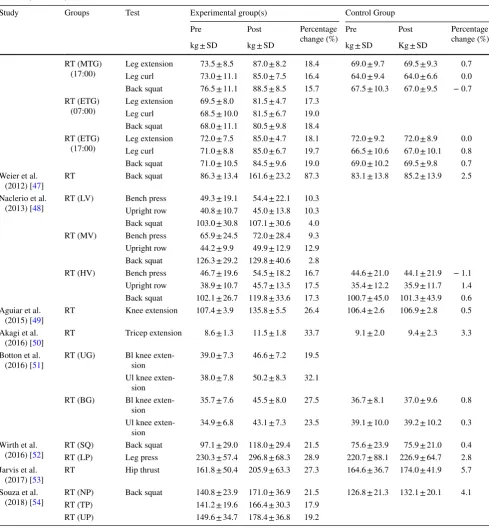
Table 3 (continued)
Study Groups Test Experimental group(s) Control Group Pre Post Percentage
change (%) Pre Post Percentage change (%) kg ± SD kg ± SD kg ± SD Kg ± SD
RT (MTG)
(17:00) Leg extensionLeg curl 73.5 ± 8.573.0 ± 11.1 87.0 ± 8.285.0 ± 7.5 18.416.4 69.0 ± 9.764.0 ± 9.4 69.5 ± 9.364.0 ± 6.6 0.70.0 Back squat 76.5 ± 11.1 88.5 ± 8.5 15.7 67.5 ± 10.3 67.0 ± 9.5 − 0.7 RT (ETG)
(07:00) Leg extensionLeg curl 69.5 ± 8.068.5 ± 10.0 81.5 ± 4.781.5 ± 6.7 17.319.0 Back squat 68.0 ± 11.1 80.5 ± 9.8 18.4 RT (ETG)
(17:00) Leg extensionLeg curl 72.0 ± 7.571.0 ± 8.8 85.0 ± 4.785.0 ± 6.7 19.718.1 72.0 ± 9.266.5 ± 10.6 72.0 ± 8.967.0 ± 10.1 0.00.8 Back squat 71.0 ± 10.5 84.5 ± 9.6 19.0 69.0 ± 10.2 69.5 ± 9.8 0.7 Weier et al.
(2012) [47] RT Back squat 86.3 ± 13.4 161.6 ± 23.2 87.3 83.1 ± 13.8 85.2 ± 13.9 2.5 Naclerio et al.
(2013) [48] RT (LV) Bench pressUpright row 49.3 ± 19.140.8 ± 10.7 54.4 ± 22.145.0 ± 13.8 10.310.3 Back squat 103.0 ± 30.8 107.1 ± 30.6 4.0 RT (MV) Bench press 65.9 ± 24.5 72.0 ± 28.4 9.3 Upright row 44.2 ± 9.9 49.9 ± 12.9 12.9 Back squat 126.3 ± 29.2 129.8 ± 40.6 2.8
RT (HV) Bench press 46.7 ± 19.6 54.5 ± 18.2 16.7 44.6 ± 21.0 44.1 ± 21.9 − 1.1 Upright row 38.9 ± 10.7 45.7 ± 13.5 17.5 35.4 ± 12.2 35.9 ± 11.7 1.4 Back squat 102.1 ± 26.7 119.8 ± 33.6 17.3 100.7 ± 45.0 101.3 ± 43.9 0.6 Aguiar et al.
(2015) [49] RT Knee extension 107.4 ± 3.9 135.8 ± 5.5 26.4 106.4 ± 2.6 106.9 ± 2.8 0.5 Akagi et al.
(2016) [50] RT Tricep extension 8.6 ± 1.3 11.5 ± 1.8 33.7 9.1 ± 2.0 9.4 ± 2.3 3.3 Botton et al.
(2016) [51] RT (UG) Bl knee exten-sion 39.0 ± 7.3 46.6 ± 7.2 19.5 Ul knee
exten-sion 38.0 ± 7.8 50.2 ± 8.3 32.1 RT (BG) Bl knee
exten-sion 35.7 ± 7.6 45.5 ± 8.0 27.5 36.7 ± 8.1 37.0 ± 9.6 0.8 Ul knee
exten-sion 34.9 ± 6.8 43.1 ± 7.3 23.5 39.1 ± 10.0 39.2 ± 10.2 0.3 Wirth et al.
(2016) [52] RT (SQ)RT (LP) Back squatLeg press 230.3 ± 57.4 296.8 ± 68.397.1 ± 29.0 118.0 ± 29.4 21.528.9 220.7 ± 88.1 226.9 ± 64.775.6 ± 23.9 75.9 ± 21.0 0.42.8 Jarvis et al.
(2017) [53] RT Hip thrust 161.8 ± 50.4 205.9 ± 63.3 27.3 164.6 ± 36.7 174.0 ± 41.9 5.7 Souza et al.
[image:12.595.52.542.65.596.2]across all studies. All studies reported the aims and/or hypotheses; the main outcome measures; the intervention employed; the point estimates of random variability; and employed appropriate statistical analysis. Four studies did not report full participant characteristics [33, 35, 36, 47] and four different studies failed to clearly describe their main findings [37, 39, 47, 49]. It was not possible to determine whether the sample represented the population in one study [34]; however, all studies did recruit both experimental and control groups from the same population. No retrospective unplanned subgroup analyses were reported in any of the studies. Six studies reported adherence or compliance to the intervention [43, 44, 47–49, 53], which was ≥ 92%, whilst 11 studies incorporated supervised training sessions into their interventions.
4 Discussion
The aim of this review was to compare the effectiveness of two load prescriptive methods on maximal strength devel-opment. Through a robust systematic search strategy and quality assessment, 22 research articles met the inclusion criteria, with 12 employing a % 1RM prescriptive approach, and the remaining 10 utilising the RM method for prescrib-ing load (Tables 1, 4). The aforementioned strategies of load prescription are widely used across S&C practices, with a large number of resistance training intervention studies also utilising these methods. Nevertheless, this is the first review to compare the two methods against one another to inform practitioners as to the most effective method for developing maximal strength.
The main finding of this review was that both % 1RM and RM prescriptive methods were effective in improving maxi-mal strength. Collectively, all training groups across the 22 included studies improved maximal strength following their interventions (31.3 ± 21.9%; 95% CI 33.1–29.5%; P < 0.05) in comparison with their non-training control groups (3.4 ± 4.3%; 95% CI 3.9–2.9%). When comparing maximal strength improvements from the two different methods, the RM target training groups collectively improved by 5.7% more than the relative training groups (Table 3).
However, on closer inspection, the greater increases in strength following the RM method of prescription might be attributed to the 73–114% increase in back squat strength following an 8 week intervention in healthy, untrained males with a mean body mass of 77.8 kg observed in one study (Campos et al. [37]). The post-testing absolute 1RM val-ues for one group equated to 246.5 kg, indicating a relative strength ratio of > 3 × body mass. When comparing to the current powerlifting rankings for the back squat, this level of lower body strength would enable these participants to fin-ish approximately 27th in the 2019 world championships if
Table
4
Sensitivity anal
ysis com
par
ing maximal s
trengt
h de
velopment acr
oss f
our me
thodological appr
oac
hes
*Dat
a f
or RM g
roup and subseq
uent sub-anal
yses does no
t include dat
a pr
esented in Cam
pos e
t al. [
37
]
1RM
1 r
epe
tition maximum,
CI
Confidence Inter
vals,
RM
R
epe
tition Maximum,
SD
st
andar
d de
viation
Pr
escr
ip
tiv
e me
thod
Ex
er
cise type
Ex
er
cise f
ocus
Tr
aining dur
ation (w
eek
s)
% 1RM
*RM
Com
pound
Isolation
Upper body
Lo
wer body
6
12
18
Sam
ple size (
n
)
313
448
523
450
207
667
101
509
151
Mean incr
ease in
str
engt
h (%)
28.8
24.2
33.8
28.4
22.4
34.3
27.2
32.1
32.7
SD (%)
20.2
10.8
24.4
18.0
19.3
21.6
25.2
21.2
20.8
CI upper (%)
31.4
25.4
35.9
30.0
25.0
36.0
32.1
34.0
36.0
CI lo
wer (%)
26.2
23.1
31.7
26.7
19.7
32.7
22.3
30.3
Table 5 Me thodological q uality e
valuation using t
he modified Do
wns and Blac
k q
uality assessment t
ool
Items 1–10 ar
e r
elated t
o r
epor
ting, items 11–13 ar
e r elated t o e xter nal v alidity
, items 14–20 ar
e r
elated t
o inter
nal v
alidity (bias), items 21–26 ar
e r elated t o inter nal v alidity (conf ounding), item
27 is r
elated t
o s
tatis
tical po
wer
, item 28 is r
elated t
o e
xer
cise adher
ence and item 29 is r
elated t o e xer cise super vision 1 cr iter ia me t, 0 cr iter ia no t me t, 0° Item w
as unable t
o be de
ter
mined or scor
ed Study Repor ting Exter nal v alid -ity Inter nal V alidity To ta l Bias Conf ounding 1 2 3 4 5 6 7 8 9 10 11 12 13 14 15 16 17 18 19 20 21 22 23 24 25 26 27 28 29 W eiss e
t al. (1988) [
33 ] 1 1 0 1 1 1 1 0 1 1 1 1 1 0 0 1 1 1 0° 1 1 0° 1 0° 0° 1 1 0 0° 19 Br ait h e
t al. (1993) [
34 ] 1 1 1 1 1 1 1 0 0 0 0° 0° 0° 0 0 1 1 1 0° 1 1 0° 1 0° 0° 0° 1 0 0° 14 Moss e
t al. (1997) [
35 ] 1 1 0 1 1 1 1 0 1 0 1 1 0° 0 0 1 1 1 0° 0 1 0° 0° 0° 0° 1 1 0 1 16 Bell e
t al. (2000) [
36 ] 1 1 0 1 1 1 1 0 0 0 1 1 0° 0 0 1 1 1 0° 1 1 0° 1 0° 0° 0 1 0 0° 15 Cam pos e
t al. (2002) [
37 ] 1 1 1 1 1 0 1 1 1 0 1 1 0° 0 0 1 1 1 0° 1 1 0° 1 0° 0° 1 0 0 0° 17 McBr ide e
t al. (2003) [
38 ] 1 1 1 1 1 1 1 0 0 0 1 1 0° 0 0 1 1 1 0° 1 1 0° 0° 0° 0° 0 1 0 0 15 W illoughb
y (2004) [
39 ] 1 1 1 1 1 0 1 0 1 1 1 1 0° 0 0 1 1 1 1 1 1 0° 1 0° 0° 1 1 0° 1 20 Tr icoli e
t al. (2005) [
40 ] 1 1 1 1 1 1 1 0 1 0 1 1 0° 0 0 1 1 1 1 1 1 0° 1 0° 0° 1 1 0 0° 19 Rana e
t al. (2008) [
41 ] 1 1 1 1 1 1 1 0 0 1 1 1 0° 0 0 1 1 1 1 1 1 0° 1 0° 0° 0 1 0 1 19 Tanimo to e
t al. (2008) [
42 ] 1 1 1 1 1 1 1 0 0 0 1 1 0° 0 0 1 1 1 0° 1 1 0° 1 0° 0° 0 1 0 0 16 Ter zis e
t al. (2008) [
43 ] 1 1 1 1 1 1 1 0 1 0 1 1 0° 0 0 1 1 1 0° 1 1 0° 0 0° 0° 0 0 1 0 16 Har tmann e t al. (2009) [ 44 ] 1 1 1 1 1 1 1 0 0 0 1 1 0° 0 0 1 1 1 0° 1 1 0° 0 0° 0° 0 1 1 1 17 Cor mie e
t al. (2010) [
45 ] 1 1 1 1 1 1 1 0 0 0 1 1 0° 0 0 1 1 1 0° 1 1 0° 1 0° 0° 0 1 0 1 17 Cht our ou e
t al. (2012) [
46 ] 1 1 1 1 1 1 1 0 0 1 1 1 0° 0 0 1 1 1 0° 1 1 0° 1 0° 0° 0 0 0 1 17 W eier e
t al. (2012) [
47 ] 1 1 0 1 1 0 1 0 0 1 1 1 1 0 0 1 1 1 0° 1 1 0° 1 0° 0° 0 0 1 1 17 Nacler io e
t al. (2013) [
48 ] 1 1 1 1 1 1 1 0 1 1 1 1 1 0 0 1 1 1 1 1 1 0° 1 0° 1 1 0 1 0° 22 Aguiar e
t al. (2015) [
49 ] 1 1 1 1 1 0 1 0 1 0 1 1 0° 0 0 1 1 1 0° 1 1 0° 1 0° 0° 1 1 1 1 19 Ak agi e
t al. (2016) [
50 ] 1 1 1 1 1 1 1 0 1 1 1 1 0° 0 0 1 1 1 0° 1 1 0° 1 0° 0° 0 1 0 0° 18 Bo tton e
t al. (2016) [
51 ] 1 1 1 1 1 1 1 0 0 0 1 1 0° 0 0 1 1 1 0° 1 1 0° 1 0° 0° 0 1 0 1 17 W irt h e
t al. (2016) [
52 ] 1 1 1 1 1 1 1 0 0 0 1 1 0° 0 0 1 1 1 0° 1 1 0° 0 0° 0° 0 1 0 1 16 Jar vis e
t al. (2017) [
53 ] 1 1 1 1 1 1 1 0 1 1 1 1 1 0 0 1 1 1 1 1 1 0° 1 0° 0° 1 1 1 1 23 Souza e
t al. (2018) [
competing in the back squat alone [55]. Therefore, it is likely that this study is skewing the RM data. Furthermore, no standardisation of technique has been provided for the back squat, thus indicating that a full depth squat might not have been implemented given the loads lifted. This information is vital for readers to fully understand the methods employed, and standardisation within and across research studies needs to be agreed upon.
When removing this particular research article, and then reanalysing the RM results, the mean percentage improve-ment from pre- to post-testing across the 11 studies remain-ing fell to 24.2 ± 10.81% (95% CI 23.1–25.3%) (Table 4). This is in agreement with Carroll et al. [25] who directly compared relative prescriptive methods against RM tar-gets and found that a relative daily maximum group was more effective in improving vertical jump, RFD and maxi-mal strength in comparison with the RM group (p < 0.05, Hedge’s g = 0.69–1.26). Carroll et al. [25] suggested that a potential build-up of residual neuromuscular fatigue from training to failure and reduction in rapid force production in the RM group might explain the lesser improvements. This idea has been presented on an acute level, in which the time course for recovery has been prolonged following a bout of resistance training to muscular failure [56]. A recent review by Davies et al. [28] observed that no statistically signifi-cant differences were evident when comparing training to failure vs. non-failure training. Similarly, Sundstrup et al. [57] highlighted that no greater motor unit recruitment was evident when training to failure vs. heavy loading training. Whilst training to failure may not affect improvements in maximal strength, the prolonged recovery time may be a negative contributing factor. Further investigation is required directly comparing these two methods of load prescription to determine the most appropriate approach across multiple athletic populations and training phases.
The present review highlighted important heterogene-ity (such as demographics, testing procedures, and training prescriptions) within the included studies, making infer-ences about the efficacy of these methods challenging and elucidating consensus difficult. Large variation in the par-ticipants recruited (age and training status); training pre-scriptions employed (sets, reps, load, and rest), exercises prescribed, and the tools used to measure maximal strength (various 1RM procedures, etc.) were evident in the literature. Despite agreement with Carroll et al. [25], such disparity in methodological approaches made comparisons across the 22 included studies difficult and we, therefore, recom-mend that this initial finding be viewed with caution. More research is perhaps required to evaluate these approaches to load prescription.
Training prescriptions that exceeded 6 weeks in dura-tion appeared to improve maximal strength greater than shorter interventions (32.1–32.7% vs. 27.2%); however, the
magnitude of these improvements decreased notably when exceeding this duration (Table 4). For example, McBride [38] found that larger improvements in the leg press exercise across the first 6 weeks compared to the second 6 weeks of training, irrespective of volume (1RM improvements 0–6 weeks: 26.6–27.7% across groups; and 1RM improve-ments 6–12 weeks across groups: 10.7–18.0%), whilst Cormie [45] found much larger improvements in the back squat at mid-test stage compared to post-test (22.7% vs. 4.5%]. Despite progressive training prescriptions being employed, these data suggest that utilising the same train-ing intervention (e.g., exercises, periodisation approach etc. with small progressions in load prescription) for greater than 6 weeks could result in a plateau in maximal strength development, necessitating variation in training stimuli to elicit further improvement [1–5]. It is also possible that the initial 6 weeks of training would facilitate a rapid increase in neuromuscular adaptations, with hypertrophy becoming more dominant once these have run their course [38]. How-ever, given the interaction between volume and hypertrophic responses to training [30, 32], it would be difficult to make these assumptions when the training frequency prescribed in the included articles in this review did not exceed 3 × week.
Improvements in maximal strength appeared to be influenced by exercise mode (Table 4). When comparing multi-joint, compound exercises (e.g., back squat or clean and jerk) with single-joint, isolation exercises (e.g., seated plantar-flexion or knee extension) greater improvement in maximal strength were evident. Multi-joint, compound exer-cises require greater neuromuscular recruitment, inter-and-intra-muscle coordination and better utilisation of muscle stabilisers and synergists than smaller, single-joint exercises [2, 6]. It is pertinent to note that the transference of single-joint exercises to sport-specific actions such as jumping and sprinting is limited and that these exercises, therefore, have limited application when training for sport performance [2]. Similarly, our findings highlighted that greater relative improvements in maximal strength were observed in lower body vs. upper body exercises (Table 4), perhaps due to the recruitment of larger muscle groups and exposure to greater loads typical of these exercises.
improvements can be observed with multiple approaches. Researchers should seek to develop a greater consensus on the more appropriate methods for developing maximal strength within different demographics.
Training recommendations are linked to important under-pinning physiological adaptations [1–7] and that the manipu-lation of loads and volumes can elicit different adaptations [2, 4]. This review, however, indicates that there might be poor agreement about the physiological mechanisms under-pinning maximal strength training. Adaptations to the neu-ral system, such as the recruitment of additional or higher threshold motor units [34, 35], the recruitment of more fast twitch muscle fibres (type IIx), greater synchronisa-tion of discharge of motor units [38, 44], greater efferent drive [44], increases in corticospinal excitability coincid-ing with reductions in short-interval intracortical inhibition [47] or enhanced neural coordination [52, 53], have all been suggested to underpin improvements in maximal strength. In contrast, increases in muscle cross-sectional area, the conversion of muscle fibre types from type IIa to type IIx, changes in pennation angle, and the secretion of growth-promoting hormones [37, 43, 45, 48, 51] have also been suggested to explain maximal strength improvements fol-lowing training. Whilst disparity in explanations might exist in the literature, this does, however, highlight that maximal strength is a complex quality that can be influenced by both neurological and morphological adaptations. Heterogeneity in physiological measurements (EMG, corticospinal excit-ability, DEXA scanner, BOD POD, muscle biopsies, blood sampling, or force plate data), the training status and abili-ties of the participants recruited, and the prescriptions of the training interventions, were noted during our analyses. Such variety in assessment methods, samples, and prescrip-tions might explain this disparity in physiological explana-tions offered by the studies included in this review. Fur-ther research might be needed to understand and isolate the physiologic mechanisms underpinning the prescriptions of maximal strength.
The majority of studies included in this review (18 arti-cles; Table 1) recruited untrained or detrained participants, most of which ranged from 3 months to 5 years without consistent strength training. Despite this heterogeneity, all studies observed increases in maximal strength in their train-ing groups. Those that recruited resistance-trained athletes (Table 1) observed notable increases in strength, ranging from 6.8 to 27.3%; studies using non-trained participants observed improvements ranging from 2.8 to 114.0% (87.3% when omitting [37]) in magnitude. This supports the sugges-tion that untrained individuals improve strength to a greater extent and at a faster rate than trained individuals [58]. It is important to note, therefore, that data from untrained individuals might not reflect that of trained individuals and that research findings from one group should not be
extrapolated to the other. Trained and untrained individu-als respond to training stimuli differently, which can vary based upon their training history and current status [2]. It is thought that untrained individuals will benefit from basic resistance training approaches, whereas trained individuals require more sophisticated methods due to a more developed neuromuscular system [2, 4]. Furthermore, there is growing consensus that a baseline of maximal strength underpins a number of important performance parameters and that cer-tain strength levels might be required prior to undertak-ing more advanced trainundertak-ing methods [1, 2, 4]. Therefore, researchers and practitioners should be cognisant of training status when designing training programmes, and ensure that the methods employed match the training status of the ath-letes that they are prescribing for. Further research should investigate the use of prescriptive methods on trained and elite individuals specifically.
Often, methods used in practice precede empirical under-pinning, and S&C practitioners sometimes utilise strategies before research has validated their efficacy [59]. The avail-ability of other prescriptive methods to S&C coaches and practitioners is apparent in practice; however, the research does not necessarily reflect this. Similarly, recent criticisms of current methods of prescription (% 1RM and RM tar-gets) such as the inflexibility and inaccuracies in training prescriptions following rapid increases in strength or the build-up of residual fatigue [60–63] and the development of new technologies have allowed practitioners to utilise other means for load prescription [64–66]. Subjective methods of autoregulation such as Repetitions in Reserve (RIR) or Rat-ings of Perceived Exertion (RPE) have been suggested as an alternative strategy to prescribe load [17, 67–70]. Likewise, the utilisation of the measurement of barbell velocity is also evident in practice. Given the strong relationship between load and velocity, individuals are profiled and then associ-ated velocities can be used to manipulate the absolute load lifted each session or each working set [71–76]. Despite these two methods being prevalent in practice, the amount of investigation into their efficacy is limited and warrants significant research in the future.
4.1 Quality Assessment
The quality of the studies included in this review, as assessed by the modified Downs and Black checklist [2, 3], had a mean score of 17.68 ± 2.28, suggesting a moderate rating of methodological quality (Table 5). Four out of the 22 stud-ies were classed as having a good methodology (≥ 20) [39,
accordance with Davies et al. [28], no study reported any adverse effects as a result of the programme intervention prescribed. When researching an intervention, any adverse effects or confounding variables should be reported [30]. This lack of transparency could conceal important biases that affect the quality of this data.
A number of the internal validity criteria were not met by any study. These were: attempting to blind participants, and attempting to blind those measuring the main outcome variables from the intervention. Although, in some cases, this might have improved the quality of the research, blinding participants from a training-programme intervention are dif-ficult, and this might not have affected the overall methodo-logical quality of the evidence [28, 29]. Such issues need to be considered by researchers who use similar checklists when evaluating intervention studies such as these, as the meth-odological limitations of these tools might lead to erroneous conclusions being drawn about the evidence. Two other cri-teria not explicitly met or reported by any of the studies were whether participants across multiple intervention or control groups were recruited over the same time period, and whether assignment of groups were concealed from participants and staff until after the intervention was complete. Failure to meet both of these criteria may have increased the risk of selection bias or participants not being placed in appropriate groups [28], and is an important risk of bias in the evidence. This could increase the possibility that a population was sampled until the desired conclusion was reached [28–30].
Only 11 studies reported that the interventions were supervised, and only seven studies reported any exercise adherence data. This is important, as poor adherence could have affected the successful completion of the interven-tions and impacted the data reported. Full supervision of a training intervention is, therefore, necessary for health and safety purposes, but to also ensure that data are accu-rate. Indeed, adherence should be recorded to ensure that outliers or suspect results are not due to partial completion and alterations in training frequency between groups [31]. Despite the aforementioned concerns, it should be noted that quality assessment tools that can evaluate strength training interventions are scarce. With a large bias towards clinical trials, a lot of the tools available (Cochrane, PEDro, Downs and Black) do not suit intervention studies in which blind-ing may be difficult, for example. Therefore, if researchers are to reliably assess methodological quality in the future, a more appropriate and robust tool might be needed if accurate assessments of the evidence are to be made using quality-assessment metrics in applied research such as this.
4.2 Strength and Limitations
The strengths of this review include the systematic nature of the search strategy, which rigorously followed the
PRISMA guidelines [26]. The data extraction process and the quality assessment tools employed were all in accord-ance with previous literature and guidaccord-ance [26, 28–31]. Despite stringent inclusion criteria, the search terms were inclusive, evidenced by the number of original articles returned (Fig. 1). This inclusive search strategy was pur-poseful, to draw out as much evidence as possible. How-ever, due to this, the ability to control for things such as programme design, participant characterisation, training status (etc.) became challenging, and might explain the heterogeneous sample, making direct comparisons between some studies challenging. However, this is perhaps also reflective of the wide range of programming tools and methods employed within research (and practice). The heterogeneity of the studies included in this review also prevented any form of meta-analysis to be undertaken, reducing the statistical impact of the findings.
Volume was not controlled for within this review. Previ-ous research has demonstrated a strong dose–response rela-tionship for physical adaptations such as maximal strength [3, 10]. It is possible that without establishing inclusion cri-teria that controlled for training volume, the application of data presented in this review could be limited. However, the aim of this review was to evaluate methods to prescribe load specifically and that the inclusion criteria of this review were developed to be sensitive to a breadth of literature.
Some studies failed to report all or relevant strength data [e.g., 37, 39, 47], whilst two studies only reported relative (1RM/BM) values [39, 45]. Requests were sent to all authors to provide additional data, with only one providing the nec-essary information. In some cases, a graph digitizer was, therefore, required to extract the data, potentially reducing the accuracy of some of the values presented in Table 3. Despite this potential limitation, this approach highlights the robust and meticulous methods employed to extract and analyse relevant data.
4.3 Practical Recommendations
Practitioners should be confident in employing either % 1RM or RM targets as a method of load prescription to improve maximal strength. The two methods, however, have different nuances in strategy and, therefore, are not inter-changeable. S&C coaches may favour the % 1RM method, given the greater improvement in maximal strength over the course of progressive intervention (> 4 weeks) evident from this review. If practitioners would prefer a more auto-regulatory method of load prescription, RM targets may be appropriate; however, careful fatigue management would be necessary due to the element of training to failure within this method [22, 56, 57]. In fact, potentially prescribing via % 1RM can allow coaches to better manage the build-up of residual fatigue and prevent a state of unplanned over-reach-ing. Moreover, practitioners must ensure that the training interventions they prescribe are appropriate for the individu-als they work with, utilising quality research as a frame of reference.
The assumption that the % 1RM target method elicits greater strength gains based on the results of this review should also be taken with caution. Whilst a recent study [25] showed that relative prescriptions was more effective at improving jump performance, RFD and maximal strength than RM targets, more research is required in this area, par-ticularly directly comparing these two methods against one another. Practitioners should evaluate the necessity of train-ing to failure and assess the intervention, and subsequently the method of load prescription, on a case-by-case basis dependent on age, training status, periodised approach, and time of season [1, 2, 25].
Despite the effectiveness of the two aforementioned methods, practitioners should still be aware of the potential logistical and physiological flaws when using this method. To administer comprehensive and safe, 1RM assessments with trained or untrained individuals can be difficult due to the proficiency needed in training at high loads, as well as the challenges logistically when employing it with a team of athletes [19, 60]. Practitioners should also take into account the daily fluctuations in force output, strength levels, and residual fatigue that may affect an individual’s daily maxi-mal intensity capabilities [61, 62]. Therefore, considering alternative or additional methods such as velocity or RIR may help maximise load prescription and maximal strength adaptations.
4.4 Future Research
Future research should seek to investigate a direct compari-son between % 1RM and RM targets to determine the most effective method of load prescription. Despite being used widely within practice and utilised in isolation across S&C
research, the efficacy of these methods has not been inves-tigated and thus requires further attention to evaluate their ability to improve maximal strength. Future research should also examine other common methods of load prescrip-tion such as velocity or RIR to provide practiprescrip-tioners with the most effective strategy to improve maximal strength. Researchers should seek to develop research informed guide-lines based around training variables related to the develop-ment of maximal strength. Guidance on definitions of what constitutes a trained individual is imperative to further the application of research to practice. Importantly, researchers should employ more robust methodologies when investi-gating the efficacy of training interventions. Furthermore, if methodological quality is to be assessed within the field of S&C, the development of a more appropriate and spe-cific measurement tool may be necessary to ensure valid judgements can be made. Based on the research returned from this review, and the methodological quality assessment we employed, the following guidelines should be followed wherever possible:
Research design recommendations:
• Ensure the testing methods are appropriate for your hypothesis (e.g., if investigating maximal strength, employ a practical and reliable strength assessment).
• Always try to employ a non-training control.
• All groups must be matched in terms of n.
• Any resistance training intervention must be progressive in terms of load, volume, and complexity.
• Resistance training interventions must be clearly described and easy to replicate.
• Data must be clearly displayed with absolute and relative values easily extractable.
• Where possible, create as ‘real world’ a training and test-ing environment as possible whilst not compromistest-ing levels of control.
• Standardise and report testing procedures in full (proto-cols, movement technique, equipment etc.)
• Recruit participants from the same population across the same time points for multiple experimental or control groups.
• Report exercise adherence and intervention supervision.