configurations in supersonic and subsonic flight regimes
RUFFELS, William and DAKKA, Sam <http://orcid.org/0000-0001-9225-761X>
Available from Sheffield Hallam University Research Archive (SHURA) at:
http://shura.shu.ac.uk/14249/
This document is the author deposited version. You are advised to consult the
publisher's version if you wish to cite from it.
Published version
RUFFELS, William and DAKKA, Sam (2016). Aerodynamic flow characteristics of
utilizing delta wing configurations in supersonic and subsonic flight regimes. Journal
of Communictaion and Computer, 13 (6), 299-318.
Copyright and re-use policy
See
http://shura.shu.ac.uk/information.html
Sheffield Hallam University Research Archive
Journal of Communication and Computer 13 (2016) 299-318 doi:10.17265/1548-7709/2016.06.004
Aerodynamic Flow Characteristics of Utilizing Delta
Wing Configurations in Supersonic and Subsonic Flight
Regimes
William Ruffles and Sam M. Dakka
Department of Engineering and Math, Sheffield Hallam University, Howard Street, Sheffield S1 1WB, United Kingdom
Abstract: Computational fluid dynamic tests are performed on delta wing models at different heights and speeds in order to achieve
lift and drag coefficient values. Primarily, testing was done at supersonic speeds to reveal the advantages of these wing configurations at supersonic flight regimes at a cruise speed and altitude. The low speed characteristics are also examined, important for take-off and landing regimes where the distinctive vortices become prominent. Throughout the two flight conditions tested, a simple delta wing model (with a straight swept wing) is compared to a delta wing model that exhibited an LERX (leading edge root extension). Provided literature describes how the performance of delta wings can be improved through this inclusion. Results obtained from the tests show that the model with the LERX has a small, but significant, performance improvement over the simple delta model, in respect to the maximum achievable lift coefficient and maximum stall angle. Lift to drag ratio is not improved however, due to the large vortices creating pressure drag. Generally, the delta wing models produce relatively small amounts of drag, and slightly less lower lift, when at low angles of attack. This is primarily due to the geometry of the models that have thin leading edges and also low thickness to chord ratios.
Key words: LERX, vortex breakdown, vortex burst, buffeting, maximum lift coefficient, maximum stall angle.
1. Introduction
The introduction of CFD (computational fluid dynamic) in the 1960s brought a third approach to the
study and development of fluid dynamics. Experimental, and then gradually theoretical, fluid dynamics were only available prior. The combination
of high speed digital computers and high accuracy numerical algorithms resulted in this third dimension
of study, accordingly titled, computational fluid dynamics. Although supersonic aircraft and delta wing configurations were introduced long before
satisfactory CFD technologies become prominent, efforts at improving and enhancing the performance
and efficiency of such designs were still rigorously endeavored, at attempt to reduce unwanted consequential aerodynamic effects. CFD techniques
offer: quantitative and qualitative results, and
Corresponding author: Sam M. Dakka, Ph.D., senior lecturer, research field: combustion and aerodynamics.
visualization, of flow regimes surrounding a subjected model; redesigning of the model, with quick
reanalysis; fast and effective approach to researching, and solving problems related to fluid dynamics [1].
The development and designs of modern aircraft are
therefore largely dependent on thorough CFD testing to improve and enhance the design, rather than
conventional methods of wind tunnel testing and theoretical calculations. This mostly applies for supersonic and hypersonic aircraft, as it is extremely
difficult to effectively replicate these flight regimes, theoretically or experimentally. Supersonic flight
regimes vary significantly to subsonic, thus the two accommodating wing configurations do also. Supersonic wing configurations are designed
differently to allow the aircraft to perform sufficiently at these speeds, and at subsonic speeds, for take-off
and landing [2].
Aircrafts that cruise at relatively high speeds
D
usually always exhibit a noticeable sweep angle (usually rearward, and rarely forward sweep). For
structural reasons, as well as aerodynamic, variations of delta wings are found in almost every
supersonically-capable aircraft. The main aerodynamic benefit of having delta wings is to reduce the onset of shock waves, caused by variations in the
fluid compressibility at high speeds, which ultimately leads to wave drag acting on the aircraft. As with any
type of drag, wave drag is highly undesirable as it will reduce the aircraft’s performance and efficiency. Serious cases of shock wave production can lead to a
phenomenon called shock stall to occur, where the flow is separated from the surface. Compressibility
variations can also cause the control of the aircraft to reduce significantly. Adapting the design of the aircraft to the demands of the flow is therefore crucial
to achieving suitable efficiency in several aspects [3]. Delta wings therefore also include this swept concept
in their geometrical design. Another advantage of using delta wings is their unique method of generating lift through the production of vortices across the
wings.
Aircraft design of modern combat fighters had
evolved around maneuverability at high angle of attack which extended the flight envelope to the stall and post stall region [4]. This was accomplished
through design of slender delta wings that leverage leading edge planform vortices to generate large
magnitude of lift at high angle of attack by keeping the vortices to the extent possible attached to the wing surface. However, it was found that the lift and the
maximum angle of attack can be further enhanced by incorporating high swept leading edge root extensions.
It is worth noting that time scales [5] associated with vortex wing separation are larger than time scales associated with shear layer instabilities, wake
instabilities and vortex breakdown instabilities which are considered unsteady flow phenomena that are
responsible for the dynamics of aero-elasticity effects. At the extremes, angle of attack the phenomenon of
vortex bursting on the surface of the planform was and still subject of great interest, as a transition from
stable core vortex to unstable vortex breakdown is associated with large turbulence intensities that are
further enhanced downstream of the vortex breakdown. This type of highly unsteady flow can cause fatigue effects through buffeting due to natural resonances
that are exciting the wing, and fin tail structures. The buffeting effects were encountered in modern combat
aircraft maneuverability at higher angle of attack and many military programs were developed to devise a design to lessen these effects [6, 7]. This was
accomplished through alteration of the vortices trajectories and bursting flow path, active and passive
control flow control to mitigate the vibration thus reducing the dynamic loads on the wing. Buffeting was a major problem encountered during the
development program of fighters jets especially those equipped with twin vertical tails. The root leading
edge extension vortices bursts immersed the vertical twin tails which caused large dynamic loads on the structures. Also it was found [8] the burst phenomena
location at medium angle of attack was downstream of the wing trailing edge longitudinal root location,
however with increase of the angle of attack the burst longitudinal location moved upstream towards the wing leading edge, the advanced burst expansion area
caused full impact of the wake on the twin tail structures and therefore generated buffeting effects.
Aerodynamic fencing (trapezoidal plate perpendicular to LERX longitudinal axis) was applied in order to reduce the buffeting effects, these although lessened
the effects of buffeting but could not eradicate the problem completely, so active and passive control
were implemented in addition to fencing, such as active actuators and strengthening the tail structures at the root. The current paper will examine the generic
vortex flow behavior around simple and LERX delta wing and the surface pressure contours associated
Supersonic and Subsonic Flight Regimes
been effectively used to demonstrate these.
2. CFD Analysis
The following is the entire process utilized to
analyze the delta wing models on CFD. Two delta wing models have been produced, one representing a simple delta planform, the other exhibiting an LERX
(leading edge root extensions), this is to provide analogies on how this inclusion improves the
performance.
2.1 Model Geometry Dimensions
2.1.1 Simple Delta
The initial delta wing model parameters were
obtained from the report “Aerodynamic Characteristics
of Delta Wings at High Angles of Attack” [9]. This
report is conducted to test the characteristics of delta
wings at high angles of attack, using CFD testing methods. Fig. 1 of appendix1, shows the parameters
used, for the wing planform and aerofoil. This model only provided the basic geometric parameter for which the model can be replicated from.
A second report, “Aerodynamic Characteristics
Including Effects of Wing Fixes of a 1/20th Scale
Model of the Convair F-102 Airplane at Transonic
Speeds” [10], is used to validate the dimensions of the
model further. The dimensions of the aircraft are
representative as they are of the F-102 aircraft, known as the “Delta Dart”; a supersonic, delta wing aircraft.
The model dimensions shown in Fig. 2 of appendix1, here are shown in one-twentieth of their full scale size, and in inches. These are converted to inches and full
scale. With these dimensions, those for the model can be found.
Leading edge wing sweep is the same as that for the F-102, 60°. The values for first model geometry are independent of the sweep angle. Entire length of the
wing is given 20.634 inches, giving the length as 10.48 meters. Fig. 1 of appendix1 gives the aerofoil
maximum thickness chord position as 0.9 of 1, or 90% the length, thus 10.48 � × 0.9 = 9.43 � .
Similarly, maximum thickness of the aerofoil, is then
given as 10.48 × 0.02 = 0.21 � . Wingspan is then taken from the value for the F-102 model, which is 22.68 inches (11.52 metres), or 5.76 meters for a
single wing. The aerofoil section formed from the values provided represents that of a “wedge” aerofoil section, which are commonly used for high speed
flight, due to their highly sharped leading and trailing edges [11]. The same aerofoil section is used for the
center and wing tip sections, although scaled down to 0.5 m in length at the wingtip. Please see appendix 1 for the remaining calculated parameters of the wing.
Table 1, shows all of the major dimensions of the simple delta wing model. Dimension sketches
produced on Solid Works are provided in Fig. 3 of
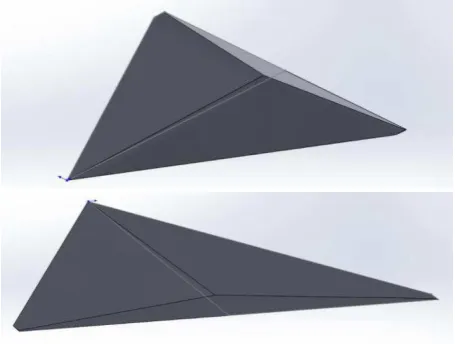
Fig. 1 Front and rear views of the simple delta model.
[image:4.595.310.538.328.500.2] [image:4.595.310.537.528.706.2]Appendix 1, while Figs. 4-6, showing the wing plan form from above and the separate aerofoil sections.
2.1.2 LERX Delta Wing
To ensure the CFD results are representative and
comparative, the second model dimensions, which have the leading edge root extension inclusion, must
also be accurate and combinable with the first model’s
dimensions. Thus, the LERX model must not be based off an entirely different model, but rather the initial
model with the LERX included. The aerofoil shape and wing span are maintained. The same wedge aerofoil section as the previous model will be used. The leading
section will be extended to simulate the wing joining the fuselage further up the body, hence, leading edge
root extension with a greater sweep angle.
Dimensions shown in Fig. 7 of Appendix 1, of an LERX delta wing, will give the model validation. An
initial wing sweep of 76° (for vortex encouragement) with the secondary sweep angle being 60° (same as the
first model), giving a -16° change in sweep angle. The size of the LERX configuration was selected from the ratio of the length of the entire wing, to the length of the
LERX section. From the dimensions this is 758:417, or 1.8177:1. Using this ratio on Solid Works when
dimensioning, the entire length of the aircraft is calculated to be 15.22 m, with the length of the LERX section being 8.36 m. Fig. 8 of appendix 1, shows the
diagram of the dimensions, created on Solid Works; Table 2 shows the entire dimensions of the LERX
model.
2.1.3 Creating the Models
Solid Works was used to create the models from the dimension sketches. The simple delta model lofted
together the centre body aerofoil and the wingtip aerofoil sections. For the LERX delta model however, the centre body aerofoil was lofted to the end of the
LERX section, then lofted again to the wingtip. The
“mirror” tool, was used to replicate the wing section on the opposite side of the plane that the first aerofoil section was drawn on. To replicate the common
“double wedge” aerofoil, the entire geometry was then mirrored again off the upper surface. The models were now symmetrical lengthways and height.
For creating the angling down of the LERX section,
Table 1 Shows all of the major dimensions of the simple delta wing model.
[image:5.595.59.555.560.723.2]Supersonic and Subsonic Flight Regimes
the entire extended section was angled down at 3°
relative to the main wing section. This was done on Solid Works by removing the existing extension section,
creating a point 0.4381 meter below the initial origin point, in the y direction. This is due to the length of the extension being 8.36 meters and the desired droop
angle being 3 degrees. The wing section was then lofted to this point, creating the “drooped” extension.
Views of the final model exteriors can be seen below. The simple delta model is seen in Fig. 1. LERX delta model is seen in Fig. 2.
2.2 CFD Methodology
2.2.1 Design Modeller
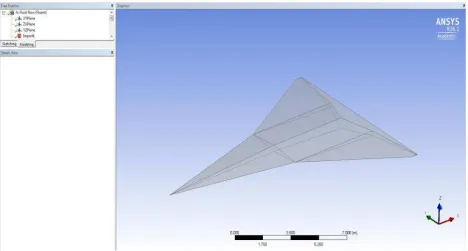
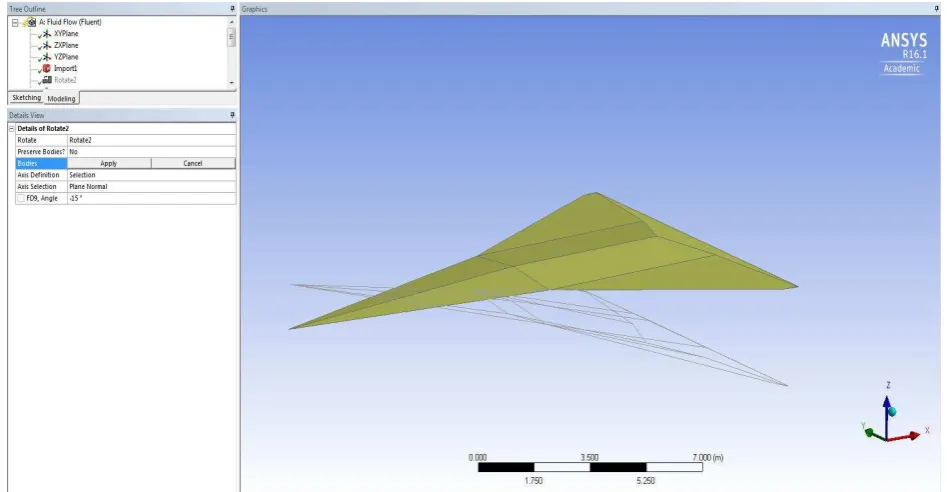
Initially, this is illustrated on Fig. 3, the models were imported into ANSYS as a Solid Works file,
then opened in Design Modeler for editing. Setting the angle of attack of the model was done through
applying a rotation body transformation, illustrated on Fig. 4. The entire model was selected as the body, and the axis selection was the ZX plane. The desired angle
of attack is then inputted; this would be altered for each test.
Applying an enclosure to the model was the next
stage. The size of the enclosure is of great importance
as one too small will cause pressure built up at the wall limits, which will affect the results. Enough
space is needed downstream (X) to allow for flow to develop freely; this should be at least three times the length of the body, as a rule of thumb. Either Z size
should be large enough to allow shockwaves to develop, whilst the distance from the front of the
enclosure to the body need not be too large, due to the nature of supersonic flow not interfering with upstream flow. The enclosure Y direction is large
enough to house the vortices and span wise flow. Fig. 5 shows the enclosure around the wing body and
the dimensions of the enclosure.
When applying the box enclosure, the number of planes was selected as one, and the ZX plane was
selected for this. This created symmetry through the enclosure, slicing it in half. Halving the geometry
means that the simulations will be quicker and simpler, with less to computation time.
After this, the named selections were applied to the
geometry. These informed FLUENT of the section’s desired responsibilities, and can be selected later on
for post processing. The front of the enclosure is titled
[image:6.595.65.534.471.722.2]Fig. 4 Setting angle of attack through the rotate feature.
Fig. 5 Enclosure applied to the model, with the dimensions shown in the details box.
INLET, and the back being the OUTLET; these being where the flow will enter and leave the domain, respectively. The wall which the wing is attached to is
titled SYMMETRY, with the remaining three walls being titled FLUID-WALL.
A Boolean operation provided 1 part and 1 body, rather than the wing body being separate from the
domain. A “subtract” Boolean operation was performed; target body was selected as the SOLID, and the tool bodies were selected as the wing.
2.2.2 Meshing
Several meshing techniques were attempted in order
[image:7.595.61.535.84.330.2] [image:7.595.65.534.351.590.2]Supersonic and Subsonic Flight Regimes
and achieving accurate results. Mesh quality depends on maximum skewness and orthogonal quality values.
Skewness values will be between 0 and 1, where close to 1 represents low quality. For orthogonal quality,
values close to 0 represent low quality.
The mesh was created though the details of “Mesh” box. Under sizing, advanced size function was
selected as on curvature, with the relevance center being medium (reducing elements). Five layers of
inflation were then added to the mesh; important for aerodynamic investigations as they will capture the flow and boundary layer precisely. Adding
inflation layers however, increased skewness. Advancing front was then selected under patch
conforming methods.
A histogram can indicate the amount of elements that represented a certain skewness value. Clicking on
the bar of the highest skewness showed the areas of the domain that had poor skewness values. Highest
skewness elements were found at the sharp leading edge of the wing. This awkward geometry over constrained the mesh and caused high skewness in
these configurations, when the inflation layers were added. By applying local sizing to the mesh, skewness
in these areas has been reduced. A face sizing was applied to all the wing surfaces, with an element size
of 0.156 meters. Skewness has been reduced from 0.99977 to 0.97316; an acceptable value. This
however, increased the amount of elements to 176, 215, meaning time to converge would be slightly
longer. The initial mesh created and the refinement mesh are illustrated in Figs. 6 and 7.
2.2.3 Ansys Fluent
2.2.3.1 Setup
Fig. 8 shows the mesh domain FLUENT. From here,
the setup and solutions will be applied, before the results can be obtained. Upon entering FLUENT, double precision was selected. Typing in the
commands “mesh”, “repair-improve”,
“improve-quality”, made FLUENT improve poor quality mesh areas. Minimum orthogonal quality is now 2.77266e-02, and maximum skewness is 9.64004e-01.
Under models in setup, the viscous model was changed from laminar to k-epsilon, selecting
realizable for the model, and standard wall functions. K-epsilon was selected as it is appropriate for simulating supersonic flow and aerodynamics. The
other models are kept as their default selection. K epsilon is the most common mathematical CFD model
and is best used to simulate turbulent flow characteristics [1].
[image:8.595.65.534.500.724.2]Fig. 7 Mesh after refinment mesh sizing.
Fig. 8 Mesh imported into FLUENT.
3. Results and Discussion
The CFD results for the lift, drag and lift to drag ratio are listed in Tables 3 and 4 for both simple and
LERX delta wing for flight Mach numbers of 1.5 and 0.25 respectively. Figs. 9-14 are highlighting the flight performance data. As expected, the delta wing model
that exhibited the leading edge root extensions achieved a better overall performance, at both speed
regimes, than the simple delta wing model. Lift coefficient is increased by the inclusion of the leading
[image:9.595.59.537.83.597.2]Supersonic and Subsonic Flight Regimes
Table 3 Lift and drag variations with angle of attack for both delta wing model at 1.5 Mach at 15,000 feet.
[image:10.595.62.539.107.442.2] [image:10.595.65.536.464.729.2]Fig. 9 Lift coefficient against angle attack for both models at 1.5 Mach.
Fig. 10 Drag coefficient against angle of attack for both models at 1.5 Mach.
[image:11.595.64.512.59.727.2]Supersonic and Subsonic Flight Regimes
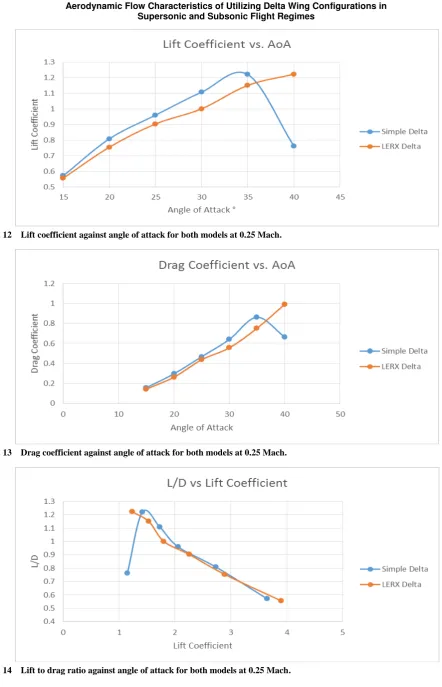
Fig. 12 Lift coefficient against angle of attack for both models at 0.25 Mach.
Fig. 13 Drag coefficient against angle of attack for both models at 0.25 Mach.
[image:12.595.71.514.56.744.2] [image:12.595.87.517.77.274.2]additional vortex suction lift. As stated, the vortices
produced have very low static pressure when compared to the pressure on the lower side of the wing.
It produces the drag force similar to how lift is produced. To prove that the results shown illustrated by Figs. 9-14 are accurate, similar results have been
obtained from another experiment [12]. The case for these results is different to both of the cases tested in
this paper, but is for delta wings. The speed is 13 m/s with a Reynolds number of 2.67×10⁵. The results are seen in Figs. 1 and 2 (appendix 2). The values are
found to be very similar to the values obtained from CFD in this study for low to medium angle of attack
up to 20 degrees.
As seen from the graphs produced, the LERX does not have much affect at supersonic speed when
compared to its subsonic performance; however, it does provide a small, but significant increase in
maximum lift coefficient, a slight reduction in drag coefficient (until high angles), whilst stall angle is mostly the same for both models.
As discussed previously, the LERX model has its greatest effect at subsonic speeds; achieving a greater
maximum lift coefficient, and maintaining flow attachment (through the vortices energizing the boundary), and thus a greater stall angle. Because of
this, drag coefficient increases, therefore lift to drag ratio reduces. Delta wings are required to fly at
relatively high speeds whilst in landing and take-off
approaches with high angles of attack deployed also.
This is due to delta wings being incapable of producing lift in the conventional manner, but rather
relies on the vortex lift method for low speed regimes. Using the leading edge root extension as deployable device, and therefore an active flow control method,
would be the most suitable application for the device. The LERX model produces far more drag at 0° angle
of attack due to downward angling of the section causing disturbances in the flow. It also produces negative lift values whilst a 0°, whereas the simple
model produces zero lift and very little drag. Using the LERX as a deployable mechanism (targeted for use at
low speeds) the stall angle is increased and thus also the maximum lift, whilst also reducing the take-off and landing distances and thus the required runway
length. With common aerofoils, drag coefficient rises dramatically once stall occussssrs, however, the delta
wing model’s respective drag coefficients fall. This is due to vortex breakdown occurring which reduced the already large, overall drag coefficient.
Shown in Figs. 15 and 16 are the pressure contours on the upper surface of the wings as the angle
increased. The contour plots clearly showing the area of the vortices formation on the wing, through the low pressure areas. For the simple delta wing, the vortex
begins to breakdown at a low angle but still maintains its presence until it gradually falls of and the wing
stalls. For the LERX model, the vortex is formed at a
[image:13.595.66.534.552.701.2]Supersonic and Subsonic Flight Regimes
Fig. 16 Pressure contours on the upper surface of the LERX delta wing model at 1.5 Mach through angles 0°, 10°, 20°, 25° and 35°.
Fig. 17 Pressure contours on the upper surface of the simple delta wing model at 0.25 Mach through angles 15°, 20°, 25°, 30° and 40°.
[image:14.595.66.534.85.249.2] [image:14.595.65.532.285.449.2] [image:14.595.65.536.482.699.2]slightly greater angle but remains attached for a
greater angle, giving the high maximum lift seen from
the results. The vortex core region is primarily centered at the aft section of the wing, but as the angle
of attack rises this moves forward, due to the LERX section of the wing being angled downwards, which
maintains the vortex, which in turn energizes the
upper surface and delays stall. The behavior observed of the wings is almost identical for the Mach 0.25
regime (Figs. 17 and 18). However, the vortex region is far smaller for the simple delta, whereas the LERX
delta produces larger, lower pressured (and therefore
highly energized) vortices. The respective leading and trailing edge pressure for each angle do not vary too
much.
It is worth noting, the LERX section produces a
separate vortex to the main wing one. The main wing
section vortex produces the majority of the lift, due to it being stronger. The vortex produced by the LERX
not only energizes the upper surface boundary layer, but energizes and stabilizes the main wing vortices
throughout increasing angles.
4. Conclusions
Throughout the study, aerodynamics of delta wings
in the range of low to high angle of attack at altitude of 15,000 feet and Mach 1.5 and at sea level and Mach
0.25 was tested. Throughout the two flight conditions tested, a simple delta wing model (with a straight swept wing) is compared to a delta wing model that
exhibited a LERX. Results obtained from the tests show that the model with the LERX has a small, but
significant, performance improvement over the simple delta model, in respect to the maximum achievable lift coefficient and maximum stall angle. Lift to drag ratio
is not improved however, due to the large vortices creating pressure drag. Also the general behavior of
the vortex formation was examined, vortex formation moved forward upstream as the angle of attack increased consistent with experimental results. While
the general flow behavior, vortex formation and flight
performance with regards to lift, drag and lift to drag
ratio was satisfactory up to medium angle of attack of 20 degrees, at very high angle of attack the
performance data under predicted the experimental data available in the public domain. Higher accuracy CFD turbulence modeling, higher numbers of cells,
and smaller time step are required, but given the modest computing resources under our disposal
tailored for undergraduate students, the general flow behavior trends are consistent with what has been reported in the literature.
Acknowledgements
The research is part of a dissertation submitted by William Ruffles in partial fulfilment of the requirements of the degree of Bachelor of Engineering
at Sheffield Hallam University
References
[1] Anderson, J. D. 1995. Computational Fluid Dynamics: The Basics with Applications. McGraw Hill.
[2] Anderson, J. D. 2007. Fundamental of Aerodynamics (Vol. 4th). McGraw Hill .
[3] Crook, M. V. 2013. Flight Dynamics Principles: A Linear Systems Approach to Aircraft Stability and Control (Vol. 3rd). Butterworth-Heinemann.
[4] Herbst, W. B. 1980. “Future Fighter Technologies.”AIAA J Aircraft 17 (8): 561-6.
[5] Breitsamter, C. 2008. “Unsteady Flow Phenomena Associated with Leading-Edge Vortices.” Progress in Aerospace Sciences 44: 48-65.
[6] Luber, W., Becker, J., and Sensburg, O. 1996. “The Impact of Dynamic Loads on the Design of Military Aircraft.” Loads and Requirements for Military Aircraft, AGARD-R-815, AGARD, Neuilly Sur Seine, France, 8-1-27.
[7] Lee, B. H. K., Brown, D., Zgela, M., and Poirel, D. 1990.
“Wind Tunnel Investigations and Flight Tests of Tail Buffet on the CF-18 Aircraft.” Aircraft Dynamic Loads due to Flow SeparationAGARD–CP-483, Sorrento, Italy, April 1-6, 1-1-26.
[8] Thompson, D. H. 1997. “Effect of the Leading-Edge Extension (LEX) Fence on the Vortex Structure over the F/A-18.” DSTO-TR-0489, Defence Science and Technology Organisation, Melbourne Victoria.
[9] Oyama, A., Imai, G., Ogawa, A., and Fujii, K. 2008.
Supersonic and Subsonic Flight Regimes
Angles of Attack.” Presented at the 15th AIAA International Space Planes and Hypersonic Systems and Technologies Conference, Dayton, Ohio: AIAA.
[10] Osborne, R. S., and Wornom, D. E. 1954. “Aerodynamic Characteristics Including Effects of Wing Fixes of a 1/20th Scale Model of the Convair F-102 Airplane at Transonic Speeds.” U.S. Air Force. Langely Field, Va: National Advisory Committee for Aeronautics .
[11] Kolluru, R., and Gopal, V. 2012. “Numerical Study of Navier-Stokes Equations in Supersonic Flow over a
Double Wedge Airfoil Using Adaptive Grids.” Retrieved from 1BMS College of Engineering, Bangalore,
Karnataka, India:
https://www.comsol.com/paper/download/152729/gopal_ presentation.pdf.
Appendix 1
Fig. 1 Model geometry. (Oyama, Imai, Ogawa, & Fujii, 2008)[9].
[image:17.595.165.425.115.318.2] [image:17.595.105.504.355.682.2]Supersonic and Subsonic Flight Regimes
Fig. 3 Aerofoil geometry dimensions.
Using simple trigonometry, the remaining parameters can be calculated. The wing leading edge length can be found from:
(10.48−0.5)2+ 5.762= 11.52 � .
The aerofoil section geometry is found from the following trigonometry;
= 0.022+ 0.12 = 0.10198 = 10.48−0.5 = 9.98� = 0.5
= (0.92= 0.022) = 0.90022�
= sin�=���
� =
0.22
0.90022= 0.02222 sin
−10.02222 = 1.2730°
= 180− 1.2730 + 90 = 88.727°
= 0.1
0.10198= 0.98058 sin
−10.98058 = 78.6899°
= 180− 78.6899 + 90 = 11.3101°
Fig. 4 Wing planform dimensions.
[image:18.595.85.512.75.146.2] [image:18.595.77.512.289.721.2]Fig. 6 Rootaerofoil dimensions.
[image:19.595.84.511.88.210.2] [image:19.595.101.505.214.579.2]Supersonic and Subsonic Flight Regimes
Fig. 8 LERX delta model dimensions. Appendix 2
[image:20.595.87.511.80.366.2] [image:20.595.104.493.413.612.2]