accessing intellectual disability services
PAINTER, Jon <http://orcid.org/0000-0003-1589-4054>, INGHAM, Barry, TREVITHICK, Liam, HASTINGS, R. P. and ROY, Ashok
Available from Sheffield Hallam University Research Archive (SHURA) at: http://shura.shu.ac.uk/17547/
This document is the author deposited version. You are advised to consult the publisher's version if you wish to cite from it.
Published version
PAINTER, Jon, INGHAM, Barry, TREVITHICK, Liam, HASTINGS, R. P. and ROY, Ashok (2018). Identifying needs-based groupings among people accessing
intellectual disability services. American Journal on Intellectual and Developmental Disabilities, 123 (5), 426-442.
Copyright and re-use policy
See http://shura.shu.ac.uk/information.html
2
Identifying needs-based groupings among people accessing
intellectual disability services.
Abstract
There is increasing emphasis on needs-led service-provision for people with
intellectual disability (ID). This study outlines the statistical cluster analysis of clinical data
from 1692 individuals accessing UK secondary care ID services. Using objective needs
assessment data from a newly developed ID assessment tool, six clusters were identified.
These had clinical face validity and were validated using six concurrently (but independently)
rated tools. In keeping with previous studies, the clusters varied in terms of overall level of
need as well as specific clinical features (autism spectrum disorder, mental health problems,
challenging behaviors and physical health conditions). More work is now needed to further
develop these clusters and explore their utility for planning, commissioning and optimizing
needs-led services.
Keywords
3
Introduction
In the field of specialist intellectual disability (ID) services, there has been a great
deal of rhetoric concerning a shift towards needs-led service provision (Schalock &
Luckasson, 2013). However, the plurality of ways that people with ID present to secondary
healthcare ID services is diverse and hence, to design, deliver and optimize needs-led
services it is necessary to have a way to both conceptualize and to organize these needs.
Whilst Bradshaw's (1972) taxonomy includes four types of need, our focus is normative need.
Bradshaw describes normative needs as a professional's assessment/judgement against a
notional standard which, at an individual level, Marosszeky, Rix, and Owen (2006) suggest is
typically aided by standardized assessment tools. For the needs assessment tool utilized in
the current research, that notional standard can be thought of as an individual with no
discernible healthcare needs (see fuller description of the measure below). Classification is
an instinctive human activity (Clatworthy, Buick, Hankins, Weinman, & Horne, 2005) and a
fundamental scientific approach (Speece, 1994) which aids our understanding of the world. It
involves the division/organisation of heterogeneous groups into subsets that are similar in
some way. The American Association of Intellectual and Developmental Disabilities
(AAIDD), for example, published their first attempt to categorize ID into various subsets in
1910 and, since then, these have gone through a number of iterations in line with the evolving
knowledge-base. The latest international ID taxonomy (DSM-5: American Psychiatric
Association, 2013) includes four ID diagnostic categories (mild, moderate, severe, and
profound), however these levels are not empirically derived (Shogren et al., 2017).
Consequently, in the same year that DSM-5 was published, the case was also being made for
fundamental alterations to ID classification such as the combining of severe and profound
diagnoses in children with ID (Tassé, Luckasson, & Nygren, 2013). This suggests that the
4
The ongoing development of thinking about a social construct like intellectual
disability is clearly appropriate, but does create practical problems for people with ID, such
as poor access to appropriate, evidence-based healthcare (Salvador-Carulla et al., 2011).
Additionally, service providers may feel they are constantly responding to a 'moving target'.
Thus, these conceptual developments do not merely pose theoretical difficulties for
researchers, academics, and clinicians.
Despite a range of proposed improvements to the current ID diagnostic categories
(Salvador-Carulla et al., 2011; Tassé et al., 2013), diagnoses alone are poor predictors of
service response (Mason & Goddard, 2009; The Sainsbury Centre for Mental Health, 2004).
Also, the process of diagnosis is unlikely to improve an individual’s functioning without an
accompanying holistic assessment of need to inform interventions (Salvador-Carulla et al.,
2011; Snell et al., 2009). Consequently, research into alternative/more multi-dimensional,
data-driven approaches to classifying ID and associated needs have been advocated
(Salvador-Carulla et al., 2011; Vieta & Phillips, 2007). In this regard, the methodology of
cluster analysis has much to offer as it can yield empirically derived groups that help
conceptualize the complexities of secondary healthcare for people with ID (Clatworthy et al.,
2005).
Cluster analysis is an umbrella term for a group of descriptive statistical techniques
which seek to divide heterogeneous groups into more homogenous subsets (Speece, 1994). It
can provide a way to identify multivariate groupings of individuals that are relatively similar
(Speece, 1994) without the need for completely discrete categories. With the shift towards
needs-led service provision for people with ID, the ability to categorize individuals into
relatively homogenous groups according to their needs (rather than diagnosis) has obvious
5
In the field of intellectual and developmental disabilities, the majority of published
accounts of empirical categorizations via cluster analysis have concerned children with
autism (ASD). Whilst these studies have merit, they are predicated on the validity of
diagnoses which are unlikely to fully capture the profile of needs for an individual (Beglinger
& Smith, 2001). That said, Beglinger and Smith's (2001) review of 16 earlier studies of
children with ASD and differing levels of ID, did find a level of consistency in research
findings. Participants tended to be grouped according to either: social interaction/behavior;
intellectual/adaptive functioning; medical condition, or some combination of these. Three or
four subtypes of children with autism were typically identified and these could usually be
readily distinguished from those with other/no diagnoses. There was an emergent view that
subtyping autism by intellectual impairment could explain the majority of variance in
presentation, and that a dimensional (rather than categorical) conceptualization of autism was
preferable.
More recently, Witwer and Lecavalier (2008) examined the validity of ASD subtypes
and concluded that the distinction between Autism and Asperger's syndrome was not
supported by the 22 studies of children (with differing levels of ID) that they reviewed.
Witwer and Lecavalier did however agree with the conclusions of the Beglinger and Smith
(2001) review in that categorizing groups by cognitive ability produced the most salient
inter-group differences and the plurality of methods, terms and tools made comparisons between
studies challenging. Since the Witwer and Lecavalier (2008) review, Bitsika, Sharpley, and
Orapeleng (2008) developed a three autism-cluster solution from data on 53 children, again
with intellectual impairment found to be an important dimension. Finally Ji, Capone, and
Kaufmann (2011) identified 4 autism subtypes in individuals from birth-21, this time
6
Beglinger and Smith (2001) suggested that, in addition to diagnostic challenges, the
wide age range (and hence developmental stage) of child participants made comparisons
between studies difficult. Soenen, Van Berckelaer-Onnes, and Scholte's (2009) 4-cluster
solution mitigated these limitations to some degree by including a reasonably equal balance
of children and adults as well as a wide range of diagnoses. However, the Soenen et al. study
was a small scale pilot, limited to individuals assessed as having a mild cognitive impairment
thus limiting the generalizability of the findings. In contrast, Shogren et al. (2017) have
recently analyzed the support needs of over 2000 children (5-16yrs) with ASD and the full
range of ID. Interestingly (given the different needs construct used) they also found 4 distinct
clusters that varied both in terms of intensity and type of need.
Moving from ASD with a range of intellectual ability to focus exclusively on ID,
Goldstein, Katz, Slomka, and Kelly (1993) derived three clusters from 102 sequential adult
referrals for ID assessment/treatment (mean age 24.6 years). Referrals were all made for
some form of employment support which, in conjunction with a mean IQ of 88 in the sample,
again suggests relatively high functioning and a likely lack of generalizability. In contrast,
Smith et al's. (1996) sample of 2202 adults (mean age 37.7) was drawn from a much broader
spectrum of ID services but were, none-the-less, biased, this time towards severe and
profound ID. Also, the Smith et al. (1996) cluster analysis was undertaken solely on ratings
of behavior problems rather than the full spectrum of needs that people with ID experience,
perhaps explaining why 54% of the sample fitted into one of their six clusters which
exhibited very few behavior problems, autistic symptoms, and less severe intellectual
impairment.
A similarly low needs or "quiet" group was identified by Crocker, Mercier, Allaire,
and Roy (2007) whose statistical analysis of data from 296 adults (mean age 40.67) with
7
little/no aggression. Interestingly, whilst Crocker et al. presented information on the
correlates of these aggressive behavior profiles, these data were not used to generate clusters,
but rather to contextualize the results of the cluster analysis.
From this brief review of the literature it is clear that existing research supports the
feasibility of empirically deriving homogenous groups from various samples of individuals
with intellectual and developmental disabilities using a variety of dimensions. Prior to using
cluster analysis, however, most researchers narrowed the range of participants (e.g., by
diagnosis, IQ level) or the range of problems considered (e.g., focussing solely on aggression
or other problem behavior(s)). Additionally, not all cluster analyses validated their models
with independent data, as strongly advocated by Clatworthy, Buick, Hankins, Weinman and
Horne (2005) .
Without such an empirically derived taxonomy, the development of Healthcare
Related Groups (HRGs) and hence needs-led service provision for people with ID risks, at
worst, being predicated on subjective judgement and, at best, on variable data-driven
approaches. There are examples of countries or regions, including Australia, Canada, New
Zealand and the Netherlands, where needs groupings inform service planning or provision
(Mason & Goddard, 2009). However, as these groupings have not been derived empirically
they tend to be subject to a disruptive annual cycle of refinement (Appleby, Harrieson,
Hawkins, & Dixon, 2013). In the USA, a recent state by state survey of funding mechanisms
for ID healthcare found a range of different needs assessment tools being utilized to inform
resource allocation, including the Inventory for Client and Agency Planning (ICAP), the
Developmental Disabilities Profile (DDP) and the Supports Intensity Scale. Most states had
found it necessary to adapt, or augment these scales and almost half were so dissatisfied that
they were planning to change tools completely (Engquist & Johnson, Courtland Johnson,
8
resource allocation groupings, we could find no existing study using cluster analysis to
develop needs-based groupings of adults with ID across a wide spectrum of ability, and using
a wide range of dimensions of normative needs.
Therefore, the main aim of the current study was to apply cluster analysis methods to identify
normative needs-based groupings of adults with ID referred to ID services in the UK National
Health Service (NHS) which, subject to replication, may be of use to those who commission
services (strategically plan what services may be needed for a population), providers of
services, and policy makers to inform future ID service provision at a local, regional, and
national level. Although our focus was limited to adults, we assessed a wide range of needs to
9
Method
Participants
The normative needs of 1,692 individuals with ID were recorded by specialist ID
professionals from a range of disciplines across six large, diverse and geographically
disparate NHS healthcare provider organizations. 992 (54.5%) of these were male and their
mean age was 41.7 years (range 18-90 years). Treatment setting information was available
for 1,466 cases, of which 84 (5.7%) were being treated in specialist residential ID assessment
and treatment units (ATUs) with the remainder being seen in the community. The ethnicity of
1631 individuals was recorded, 1540 (94.4%) of whom were White British. Accommodation
status was recorded for 1170 (69.1%) of individuals. Of these, 231 (19.7%) were living
independently in mainstream housing whilst 147 (12.6%) were living with family/friends. A
further 491 (42.0%) were living in some form of supported accommodation (i.e. placements
with varying levels of paid staff input). By virtue of acceptance into specialist ID services all
individuals were deemed to have ID, however recording rates of ID diagnoses were generally
low with just 595 (35.2%) receiving either a formal primary or secondary ID diagnosis. Of
these diagnoses, 273 (45.8%) were for mild ID, 214 (36.0%) moderate, 78 (13.1%) severe
and 30 (5.0%) profound. Individuals were referred into ID health services for a variety of
primary reasons. Of the 696 cases where this information had been included in the dataset,
the most frequent reasons for referral to health services were: 180 for challenging behavior;
110 for mental health problems; 67 for general vulnerability; 62 for ASD; 55 for mobility and
posture, 34 for epilepsy; 30 for social emotional functioning issues; 26 for communication
problems; 24 for offending behavior, and 23 for support in accessing mainstream primary
10
Measures
In addition to the collection of routine demographic and other relevant clinical
information, all individuals' health and social needs were rated using the Learning Disability
Needs Assessment Tool (LDNAT) (Painter, Trevithick, Hastings, Ingham, & Roy, 2016).
Note that the UK terminology of “Learning Disability” in the LDNAT's title is synonymous
with the term Intellectual Disability used throughout this article. The LDNAT is a brief, but
holistic normative needs assessment tool developed from the Health of the Nation Outcome
Scales (HoNOS) (Wing et al 1993) and the Mental Health Clustering Tool (MHCT) (Self et
al, 2008). The LDNAT consists of twenty three 0-4 scales. Whilst each has scale-specific
anchor point descriptors, they all adhere to a common underlying set of response options (i.e.
0 (no problem); 1 (minor problem requiring no action) through to 4 (severe problem)), to
capture the severity of each specific need. In this regard the LDNAT, like DSM-5, treats need
as the inverse of the individual's limitations (Shogren et al., 2017). These needs include the
12 original HoNOS scales which are primarily (but not exclusively) associated with mental
health, together with additional scales developed by multi-disciplinary groups of specialist ID
clinicians.
The final list of needs was then reviewed by a large (n=75) group of ID practitioners to
confirm the extended tool captured the full range of needs they encountered on a daily basis
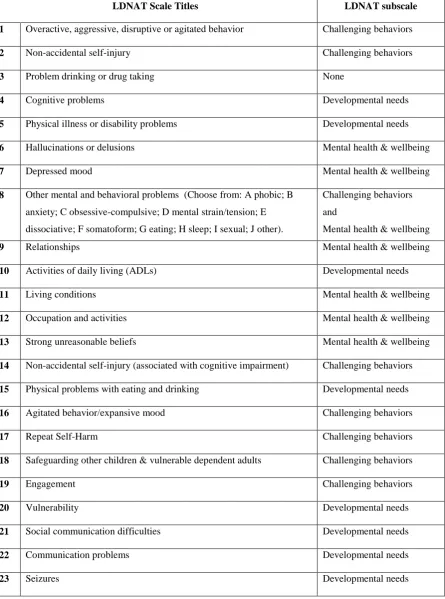
(see table 1 for a list of these scales and Painter et al., 2016). Developed and validated on
data from 1,692 adults with a broad range of conditions, the LDNAT was found to have good
internal consistency (Cronbach's alpha = 0.80), excellent test-retest reliability (ICC=0.91)
and, (on a subset of 160 cases), clinically and statistically meaningful correlations with a
number of validated independent measures of normative needs. In addition to an overall
severity total score, principal component analysis identified three LDNAT components which
11
challenging behavior (CB) (comprising 8 scales), and mental health and wellbeing
(comprising 7 scales) (see Table 1 and Painter et al., 2016).
Table 1 location
A subset of individuals from 4 of the services were also rated with six additional
assessment tools each focusing on one of six domains (emboldened below) that both match
the range of normative needs captured in the LDNAT and the reasons for referral to health
services typical in the UK (see earlier). Data from these measures on a sub-set of the sample
provided the opportunity to undertake preliminary validation of the clusters derived solely
from LDNAT data. Candidate measures were identified from a brief literature review. The
final choice for each domain was made by a multidisciplinary group of ID practitioners,
based on criteria including brevity, simplicity, psychometric quality, and cost. The first two
of these criteria were deemed particularly important given the tools would be completed
independently by informants who would receive no training.The final choices were: the
Waisman Activities of Daily Living Scale (W-ADL) (Maenner et al., 2013) - to assess
general ability/severity of disability; the Threshold Assessment Grid (TAG) (Slade, Powell,
Rosen, & Strathdee, 2000) - to provide an overall risk rating; the Psychiatric Assessment
Schedules for Adults with Developmental Disabilities Checklist (PAS-ADD checklist) (Moss
et al., 1998) - to rate the overall severity of mental health problems; the Behavior Problems
Inventory for Individuals with Intellectual Disabilities-Short Form (BPI-S) (Mascitelli et al.,
2015; Rojahn et al., 2012a, 2012b) - to rate challenging behaviors; the Social Communication
Questionnaire (SCQ), (Rutter, Bailey, & Lord, 2003) - to rate the severity of ASD symptoms;
and a bespoke physical health questionnaire created by the authors, based on the POMONA
study (Haverman et al., 2011) which, although yet to be fully validated, yielded acceptable
12
Procedure
Six NHS services in England used the LDNAT to rate the normative needs of their
service recipients following routine assessment. Qualified healthcare professionals from a
range of disciplines attended a one-day training event before cascading training to other
front-line qualified staff in their own organizations using standard training materials. These
included case studies which allowed trainers to compare ratings to the 'correct' scores to help
ensure competence. LDNAT ratings were then recorded as part of these healthcare
professionals' routine assessments of referrals accepted between July 2014 and August 2015.
The participating NHS services from across England sourced the required data from their
individual service recipient record systems before submission via a standardized, encrypted
dataset to the lead NHS service for collation and central analysis. This naturalistic study of
routinely collected clinical data received governance approval for the purposes of NHS
service evaluation.
In the four services that considered the nature of their services users in more detail the
LDNAT assessor for each routine referral to these services was also asked to identify an
independent rater who knew the person with ID well enough to complete the six additional
measures (for preliminary validation of the clusters). These referrers (typically General
Practitioners, family members or caregivers) were telephoned and asked to provide this more
detailed level of referral information. Those that agreed were sent the six questionnaires for
completion within 2 weeks. This resulted in 160 cases which had six independently rated
questionnaires to complement their LDNAT ratings. This convenience sample did not
significantly differ from the full dataset in terms of their demographics other than including a
higher proportion of individuals treated in specialist ID residential assessment and treatment
units (ATUs) (21% vs. 5.7% in the main dataset). These additional independent ratings were
13
validation of the clusters derived from the LDNAT data.
Statistical analysis
All data were entered into SPSS version 22. The cleansing of these 2102 cases
resulted in 36 cases being removed which were subsequent repeat assessments of an
individual who had already been assessed, and 374 cases being removed where one or more
LDNAT scale ratings was missing, or had been recorded as unknown. Therefore,
hierarchical agglomerative cluster analysis was undertaken on the LDNAT ratings of the
1692 unique and sufficiently complete records (i.e. containing all 23 LDNAT scale ratings
required for the cluster analysis).
The first step was the evaluation of a dendrogram showing squared Euclidean
distances following cluster analysis using Ward’s method. A range of cluster solutions were
identified and subsequently examined using a series of k-means cluster analyses. K-means
cluster analysis has the advantage of allowing some movement of cases between clusters
whilst they are built to ensure groupings are generated which maximize within-cluster
homogeneity and between-cluster heterogeneity.
For each candidate set of cluster solutions, data regarding a number of factors were
reviewed by a small multi-disciplinary group of ID clinicians and academics. The cluster
solution which, on balance, 'performed' most favorably across a range factors was then
explored in more depth to better understand the nature of each identified group. From this,
working titles were devised describing each cluster.
Analyses of variance (ANOVA) with post-hoc Tukey HSD tests were performed on
LDNAT data (individual scales, components, and total scores) to explore variation between
the clusters in the favored solution. A range of additional demographic and clinical data were
14
the working titles. Finally, to validate the clusters, ANOVAs were performed on the scoring
data from the 6 additional measures of normative needs that a subset of individuals had been
15
Results
Initial generation of clusters
The dendrogram derived from Ward's method cluster analysis initially indicated that
4, 5, 6 and 7 cluster solutions were all potentially viable. Consequently, k-means cluster
analysis solutions were produced for 4-7 clusters. The multi-disciplinary group of clinicians
and academics reviewed each solution's 'performance' across a range of factors including:
relative size of clusters; specificity of clusters versus parsimony in each solution; clinical face
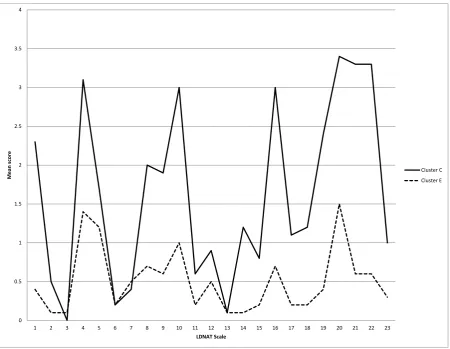
validity of clusters, based on relatively high and low scoring LDNAT scales (Figure 1).
From this process the 6-cluster solution was favored and short working descriptions were
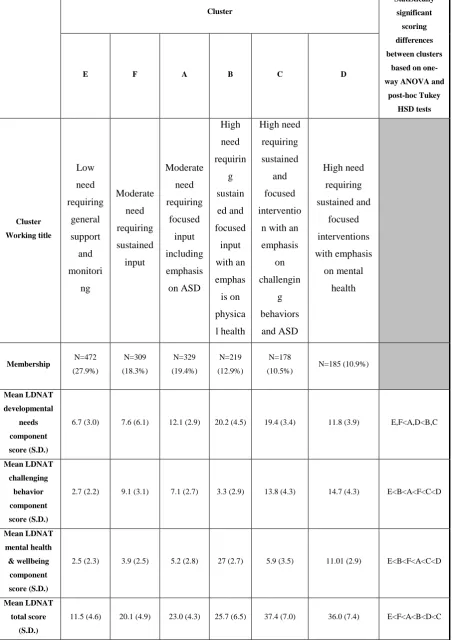
produced for each grouping (see Table 2).
Analysis of variance
For each cluster, the mean LDNAT scale scores were examined to confirm
consistency with the working descriptions and to better understand the cluster differences.
Primarily this was undertaken by considering the similarities, differences, general patterns
and clinical implications of each cluster's scoring profile (as per Figure 1).
Figure 1 location
One way ANOVAs with post hoc Tukey HSD tests were performed on the LDNAT
subscales and total scoring data for the six clusters (Table 2). These analyses revealed that
cluster E had consistently lower needs than the remaining clusters whilst cluster C had the
highest total LDNAT score. The ranking of clusters (summarized in Table 2) varied
somewhat, according to the subscale in question but continued to retain clinical face validity.
16
Associations with additional clinical and demographic variables
The process of clinical 'sense checking' was continued with the introduction of a range
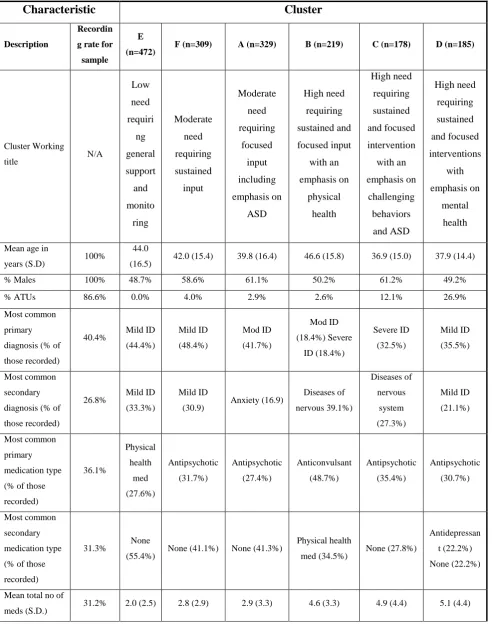
of additional items from the data set (Table 3). Whilst completion rates varied notably, these
data continued to support the emergent nature of, and relationship between the clusters. These
data were presented descriptively purely to inform clinical understanding of the nature of
each cluster grouping.
Table 3 location
Cluster descriptions
The results from the analyses thus far were synthesized to create a richer picture of
the membership of each of the six clusters. These clinical characteristics are summarized
below.
Cluster E, "low need requiring general support and monitoring" was the largest,
constituting 27.9% of cases. It had the lowest proportion of males (48.7%) and of individuals
treated in ATUs (0.0%) together with a high proportion of individuals with a diagnosis of
mild ID (77.7%). The most common interventions being provided were physical
health-related. Similarly, the most frequently prescribed medication was for physical health needs
and the mean number of medications was 2.0. This cluster had the lowest LDNAT total score
and subtotals. On average, 9 LDNAT individual scales scored significantly lower than the
norm and there were no higher scoring scales. The clinicians' average ratings of normative
needs were that there were 20 LDNAT scales with "no problems" and 3 with "minor
problems that required no action".
Cluster F, "moderate need requiring sustained input" (18.3% of the sample) had more
males (58.6%) and individuals in ATUs (4.0%) than cluster E. Most (79.3%) had a
17
interventions and 31.7% were primarily prescribed an antipsychotic. The mean total LDNAT
score was the second lowest (20.1) and the mean LDNAT challenging behavior subtotal is
notably higher than cluster E (9.1 vs 2.7). The majority of LDNAT individual scales mean
scores were close to the sample norm whilst activities of daily living (ADL), and
communication needs were less prominent. Only historical aggression and self-harm scored
relatively highly. 15 of the average normative ratings were clinically rated as presenting "no
problem", 6 as "minor problems but requiring no action" and just 2 rated as "mild but
definitely present" (i.e. requiring low intensity, but focused intervention).
Cluster A, "moderate need requiring focused input including emphasis on ASD"
comprised 19.4% of cases, making it the second largest grouping. It had one of the highest
proportions of males (61.1%). 41.7% had a primary diagnosis of moderate ID and 16.9%)
had a co-morbid anxiety disorder. Over a quarter (27.4%) were primarily prescribed
antipsychotics and 31.6% were receiving coping strategy enhancement interventions. The
mean LDNAT total score was 23.0 (higher than clusters E and F but lower than B, C and D).
The only outlying individual scale was 21 (social communication needs) which was relatively
high compared to clusters E and F where it was relatively low. Here, on average 13 scales
were rated by professionals as "no problem", 5 as a "minor, problem but requiring no action"
and 5 as "mild but definitely present" (i.e. requiring low level, but focused intervention).
Cluster B, "high need requiring sustained and focused input with an emphasis on
physical health" was one of three that were labeled as high need in some way. Containing
12.9% of the sample, half (50.2%) were male and just 3% were being treated in ATUs, it was
also the oldest group (mean age 46.6 years). In total 36.8% were diagnosed as
moderate/severe ID and 39.1% had a secondary ICD-10 diagnosis of G00-G99 (diseases of
the nervous system). Almost half (48.7%) were primarily prescribed anticonvulsants and
18
were prescribed 4.6 different medications (higher than E, F and A, but similar to C and D).
Their mean LDNAT total score is 23.0 (akin to cluster A) but the developmental needs
subtotal was much higher whilst the challenging behavior total was markedly lower. LDNAT
individual aggression scales were relatively low whilst others, including cognitive problems,
communication problems, vulnerability and physical health problems (including those
concerned with eating and drinking) were all significantly higher than the other clusters.
Although on average 15 scales still rated as "no problem", 3 were deemed to be "minor
problems, requiring no action" and 1 as "mild but definitely present"; importantly 4 were now
termed as being "moderately problematic" (i.e. requiring a higher intensity of focused
intervention).
Cluster C, "high need requiring sustained and focused intervention with an emphasis
on challenging behaviors and ASD", with 10.5% of the sample was the smallest group. It
was also the youngest (mean age 36.9 years) and, similar to cluster A, it contained a high
proportion of males (61.2%). A third (32.5%) had a primary diagnosis of severe ID and
27.3% a secondary ICD-10 diagnosis of G00-G99 (diseases of the nervous system). On
average, they were prescribed 4.91 different medications and, for 35.4% this was primarily an
antipsychotic. The most common interventions were coping strategy enhancement and
physical health-related (both 30.8%). This cluster had the highest mean LDNAT total score
(37.4) and the second highest challenging behavior subscale score (13.8). The developmental
needs subtotal was marginally lower than cluster B (19.4). No individual LDNAT scale
scored significantly lower than the norm but 12 of the 23 scored relatively high. These
included the cognitive impairment, relationships and ADL scales as well as historical
aggression, engagement, vulnerability and social communication needs. In cluster C on
19
no action". However, 3 scales presented "mild problems" and 6 were "moderately
problematic" (i.e. requiring lower / higher intensities of focused intervention respectively).
Cluster D, "high need requiring sustained and focused interventions with emphasis on
mental health", was again relatively small (10.9% of the sample), relatively young (mean age
37.9 years) and had a fairly even gender split (49.2% male). In total, 56.6% of the group had
a primary or secondary diagnosis of mild ID and 27% were treated in ATUs (by far the
highest proportion of the 6 clusters). Individuals in this cluster were prescribed more
medications than any other (mean 5.07). In 30.7% of cases the primary drug's action was
antipsychotic and in 22.2% of cases a secondary anti-depressant was included. This group
had the second highest mean LDNAT total score (36.0) and by far the highest mental health
and wellbeing component score (11.1). The mean challenging behavior component score was
also the highest (14.7) though the difference between clusters D and C was less pronounced.
As with cluster C, there were no unusually low scoring scales but a large number (13) of
relatively high scoring scales, all of which were from the original mental health version of the
LDNAT (Self et al., 2008). In this final cluster the mean normative ratings for 5 scales were
"no problem", for 10 scales were "minor but requiring no action" and 8 were "mild" (i.e.
requiring low level but focused interventions).
Preliminary cluster validation
The mean scores for each of the independently-rated questionnaires were generated
for all cases where these data were available (Table 4). These scores were compared across
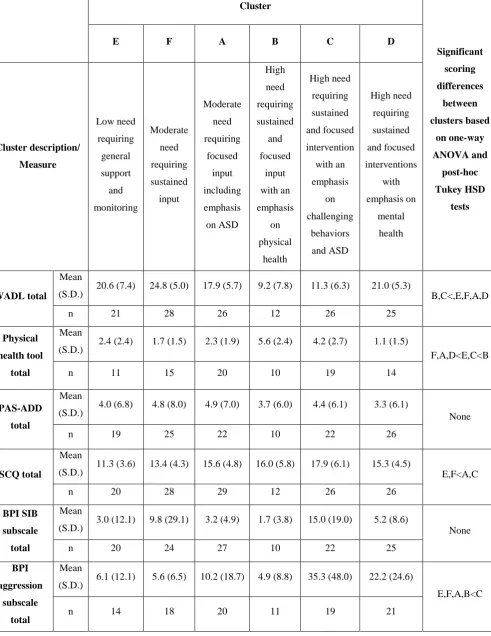
the six clusters using a series of one-way ANOVAs. These confirmed the clusters to be
statistically different across nine of the 11 measures' total/subscales, together with a marginal
group difference for BPI-S self-injury scores (p = .08). There were no significant cluster
differences overall for the PAS-ADD checklist scores. Finally, the post hoc Tukey HSD tests
20
difference between the clusters was apparent from the ANOVA. Upon review, this detailed
statistical exploration again yielded results that had clinical face validity. The clusters were
therefore deemed to be measurably different not only in the severity but also the nature of
needs. These preliminary validation results are also summarized in Table 4.
21
Discussion
Triggered by a pressing need for more cost-effective services, this study stemmed
from a desire by specialist ID clinicians across a number of NHS healthcare provider
organizations to better understand the type and level of demand for their services prior to
planning service improvements.
There has been a marked shift towards needs-led services internationally. However,
there is an ongoing state of flux surrounding the classification of people with ID and
significant dissatisfaction with current approaches to Healthcare Related Groupings
(HRGs)/needs-led resource allocation. Against this backdrop, the application of statistical
cluster analysis techniques to data from a newly developed tool (the LDNAT) provided an
exciting opportunity to explore and conceptualize the normative needs of a significant
number of people accessing a diverse range of secondary care ID services across the UK.
The fact that the LDNAT measures normative need rather than directly assessing support
needs may seem counter-intuitive. However, two of the most popular measures used in the
USA to inform resource allocation (the ICAP and the DDP) have a similar focus and, parallel
work in the UK's mainstream mental health services (see Trevithick, Painter, & Keown,
2015) has found considerable utility from this approach. Additionally, our multi-site project
would have almost certainly encountered the geographical variation in current service
provision that may lead to distorted clinician-ratings of support needs (Acheson, 1978).
There are no definitive guidelines regarding the specific method of cluster analysis to
employ in any given field of study, nor exactly how to apply them in any set of given
circumstances (Speece, 1994). Cluster analysis will, by its very nature almost always
produce groupings. However, these groupings will not always be meaningful/ valuable to the
22
exploratory technique, rather than an approach with which to ‘force’ an answer from the data
(Clatworthy et al., 2005; Speece, 1994).
The clusters identified through this analysis had significantly different LDNAT total
scores which logically increased in terms of overall intensity of normative need as follows:
low - cluster E (minor needs requiring general support and monitoring); moderate - clusters A
and F (requiring focused interventions with more or less emphasis on ASD respectively) and
high - clusters B, D and C (requiring sustained, intensive interventions focusing on physical
health/ mental health / challenging behaviors and ASD respectively). At a macro level,
information about HRGs (i.e. groups of individuals with similar intensities of healthcare
needs) provide the means to objectively compare casemixes and hence could be used by
commissioners/strategic planners when distributing ID healthcare budgets across multiple
providers. Additionally commissioners could more confidently make the case for redirecting
funds into more tailored primary care interventions (e.g. coping skills enhancement), for the
significant number of individuals with generally low needs (cluster E) currently receiving
secondary ID services in the UK NHS.
At a more granular level, each of the three LDNAT subscales provided a slightly
different ranking of need but the nature of these patterns of normative needs continued to
resonate with clinical experience and correlated well with other assessment tools concurrently
(but independently) rated. Cluster E, for example scored lowest on the LDNAT
developmental needs subscale as well as being the lowest need group according to the
WADL, the TAG needs and disabilities subscale and the SCQ. Logically, therefore, this
cluster will require relatively little active involvement from professionals. Conversely,
cluster C scored highest on these three tools as well as the BPI stereotyped behavior subscale
suggesting a much higher level of support will be required. As the LDNAT developmental
23
cluster B also ranking highly, as well as on the WADL and the bespoke physical health tool.
For service providers, this highlights the need for integrated (physical and psychological)
services.
Turning to the LDNAT challenging behaviors subscale, cluster E was again the lowest
need, contrasted by clusters C and D which were the highest. This clinical 'picture'
corresponded well with the BPI aggression subscale and the TAG total and subscale scores.
Lastly, the LDNAT's mental health and wellbeing subscale logically placed cluster D as the
highest need and cluster E as the lowest. Interestingly, there were no statistically significant
differences between these clusters on the PASS-ADD checklist, none-the-less this again
highlights the need for joined- up services (on this occasion ID and mental health). This
richer picture, created by understanding the type, as well as the intensity of need could then
be of value to service providers seeking to match supply with demand; developing
services/service pathways to more efficiently and effectively meet the needs of their service
users. It could also highlight the proportion of individuals accessing their services that
exhibit challenging behavior, mental health problems and/or ASD. With UK clinical
guidance for these problems now available (e.g. NICE, 2012, 2015, 2016), these data would
allow staff training programmes to be developed, ensuring the knowledge and skills of ID
staff match the type and level of demand for their services in NHS contexts.
At the most detailed, individual level (and if repeated periodically), the standardized
assessment of need could be used by ID clinicians to gauge the success of their care/treatment
plans as good outcomes would be indicated by reductions in objective need over time and,
potentially, allocation to a less resource intense cluster. This could helpfully augment ID
diagnoses which tend to be more static and have other known limitations in this field.
24
cluster showed sufficient homogeneity it would also be possible to create 'menus' of service
entitlements that would provide more informed choices for people with ID.
The findings of this study add to the existing evidence base regarding ID subgroups as
our project focused on adults rather than children and included a broader range of presenting
needs than most previously published accounts of cluster analysis in the field of ID.
Additionally, as well as covering the full breadth of normative needs identified by a large
multi-disciplinary group of specialist ID professionals, the LDNAT is quick and easy to use,
meaning the required data could be realistically produced as part of routine practice rather
than requiring 'gold standard' research conditions (an important consideration for service
providers).
The characteristics of the six clusters generated by this project (derived from LDNAT
and with preliminary validation by other measures) still resonated with previous research
findings in that social interaction/behavior, intellectual/adaptive functioning and medical
conditions (physical health and disability needs) were all found to be key dimensions. More
specifically, severity of ASD differentiated between otherwise similar levels of overall need
(e.g. clusters F and A) and this supported the findings of previous research (Beglinger &
Smith, 2001). Conversely, ASD could be subdivided by intellectual impairment and/or level
of challenging behavior (e.g. clusters F, A and C), again confirming previous research (e.g.
(Bitsika et al., 2008; Ji et al., 2011; Witwer & Lecavalier, 2008). Finally, cluster E (low
need) accounted for 28% of the cases. This is lower than the 34-54% of 'quiet' cases found in
previous studies who required a service none-the-less (Crocker et al., 2007; Smith et al.,
1996) but is likely to be the result of the current study's participants' broader range of
presenting need. Again, in the current economic climate, the identification of a sizeable
proportion of people with low needs being treated in specialist ID services has significant
25
The size, diversity and naturalistic nature of this study make these findings
noteworthy. Inevitably, however, some potential limitations need to be born in mind. For
example, the delivery of the standard training materials may have varied between
organizations; also staff will subsequently have had different levels of opportunity to use the
tool, both leading to potential data quality issues. Additionally there were relatively low
levels of data completeness for some contextual data items, and the proportion of individuals
with ID being treated in ATUs varied between the whole sample and the subset with ratings
for the six additional measures. All participants had been referred for support to adult NHS
services, thus the cluster groupings may not apply to people with ID with primarily social
care needs, to children and young people, and to adults with ID who rarely come into contact
with services. Finally, although data were gathered from a diverse range of secondary care
healthcare providers it is possible that our sample was not representative of all users of such
services.
That said, the increasing emphasis on needs-led (and mainstream service provision,
for people with ID in the UK at least), means these clusters (representing different severities
and profiles of need) may have utility in the transformation of both mainstream mental
health, and specialist ID services. Understanding service demand using this needs-led
taxonomy could also have other tangible benefits for practice. As a result, this cluster
analysis project now requires replication and extension to confirm these groupings and
understand more about the typical services received by each cluster group (a recommendation
also made by Shogren et al., 2017). From this it will be possible to more fully evaluate the
utility of the groupings in helping to plan and deliver services for individuals with ID that are
26
References
Acheson, R. M. (1978). The definition and identification of need for health care. Journal of Epidemiology and Community Health, 32(1), 10–5. https://doi.org/10.1136/jech.32.1.10
American Psychiatric Association. (2013). American Psychiatric Association: Diagnostic and Statistical Manual of Mental Disorders (5th ed.). Arlington VA: American Psychiatric Publishing. https://doi.org/10.1176/appi.books.9780890425596.744053
Appleby, J., Harrieson, T., Hawkins, L., & Dixon, A. (2013). How can payment systems help to deliver better care ? Authors Payment by Results.
Beglinger, L. J., & Smith, T. H. (2001). A Review of Subtyping in Autism and Proposed Dimensional Classification Model. Journal of Autism and Developmental Disorders,
31(4), 411–422. https://doi.org/10.1023/A:1010616719877
Bitsika, V., Sharpley, C. F., & Orapeleng, S. (2008). An exploratory analysis of the use of cognitive, adaptive and behavioural indices for cluster analysis of ASD subgroups.
Journal of Intellectual Disability Research, 52(11), 973–985.
https://doi.org/10.1111/j.1365-2788.2008.01123.x
Bradshaw, J. (1972). The taxonomy of social need. In G. McLachlan (Ed.), Problems and progress in medical care. Oxford: Oxford University Press.
Clatworthy, J., Buick, D., Hankins, M., Weinman, J., & Horne, R. (2005). The use and reporting of cluster analysis in health psychology: a review. British Journal of Health Psychology, 10(Pt 3), 329–358. https://doi.org/10.1348/135910705X25697
Crocker, A. G., Mercier, C., Allaire, J. F., & Roy, M. E. (2007). Profiles and correlates of aggressive behaviour among adults with intellectual disabilities. Journal of Intellectual Disability Research, 51(10), 786–801.
https://doi.org/10.1111/j.1365-2788.2007.00953.x
27
with Intellectual and Developmental Disabilities: A Survey of States. New Jersey. Retrieved from
http://www.chcs.org/media/IDD_State_Priorities_and_Barriers_Snapshot_082812.pdf Goldstein, G., Katz, L., Slomka, G., & Kelly, M. A. (1993). Relationships among academic, neuropsychological, and intellectual status in subtypes of adults with learning disability.
Archives of Clinical Neuropsychology, 8(1), 41–53.
https://doi.org/10.1016/0887-6177(93)90042-Y
Haverman, M., Perry, J., Salvador–Carulla, L., Noonan Walsh, P., Kerr, M., Van
Schrojenstein Lantman-de Valk, H., … Weber, G. (2011). Ageing and health status in adults with intellectual disabilities: Results of the European POMONA II study. Journal of Intellectual Disability, 3(1), 49–60. https://doi.org/10.3109/13668250.2010.549464
Ji, N. Y., Capone, G. T., & Kaufmann, W. E. (2011). Autism spectrum disorder in Down syndrome: Cluster analysis of Aberrant Behaviour Checklist data supports diagnosis.
Journal of Intellectual Disability Research, 55(11), 1064–1077.
https://doi.org/10.1111/j.1365-2788.2011.01465.x
Maenner, M. J., Smith, L. E., Hong, J., Makuch, R., Greenberg, J. S., & Mailick, M. R. (2013). Evaluation of an activities of daily living scale for adolescents and adults with developmental disabilities. Disability and Health Journal, 6(1), 8–17.
https://doi.org/10.1016/j.dhjo.2012.08.005
Marosszeky, N., Rix, M. D., & Owen, A. G. (2006). Knowing what you need to know about needs assessment. In National Health Outcomes Conference Wollongong, Australia: Australian Health Outcomes Collaboration. Woolongong: University of Woolongong. Retrieved from
http://ro.uow.edu.au/cgi/viewcontent.cgi?article=1088&context=gsbpapers
28
Validity in Adults with Intellectual Disabilities. Journal of Applied Research in Intellectual Disabilities : JARID, 28(6), 561–71. https://doi.org/10.1111/jar.12152
Mason, A., & Goddard, M. (2009). Payment by Results in Mental Health : a review of the
international literature and economic assessment of the Integrated Packages Approach
to Care ( InPAC ).
Moss, S., Prosser, H., Costello, H., Simpson, N., Patel, P., Rowe, S., … Hatton, C. (1998). Reliability and validity of the PAS-ADD Checklist for detecting psychiatric disorders in adults with intellectual disability. Journal of Intellectual Disability Research, 42(2), 173–
183. Retrieved from http://onlinelibrary.wiley.com/doi/10.1046/j.1365-2788.1998.00116.x/pdf
NICE. (2012). Autism spectrum disorder in adults: Diagnosis and management. London: National Institute of clinical Excellence. Retrieved from
https://www.nice.org.uk/guidance/cg142/chapter/1-guidance
NICE. (2015). Challengingbehaviour and learning disabilities : prevvention and interventions for people with learning disabilities whose behaviour challenges. London: National Institute of clinical Excellence. Retrieved from
https://www.nice.org.uk/guidance/ng11/resources/challenging-behaviour-and-learning- disabilities-prevention-and-interventions-for-people-with-learning-disabilities-whose-behaviour-challenges-1837266392005
Painter, J., Trevithick, L., Hastings, R. P., Ingham, B., & Roy, A. (2016). Development and validation of the Learning Disabilities Needs Assessment Tool (LDNAT), a HoNOS-based needs assessment tool for use with people with intellectual disability. Journal of Intellectual Disability Research, 60(12), 1178–1188. https://doi.org/10.1111/jir.12340
29
Journal of Intellectual Disability Research, 56(5), 527–545.
https://doi.org/10.1111/j.1365-2788.2011.01507.x
Rojahn, J., Rowe, E. W., Sharber, A. C., Hastings, R., Matson, J. L., Didden, R., … Dumont, E. L. M. (2012b). The Behavior Problems Inventory-Short Form for individuals with intellectual disabilities: Part II: Reliability and validity. Journal of Intellectual Disability Research, 56(5), 546–565. https://doi.org/10.1111/j.1365-2788.2011.01506.x
Rutter, M., Bailey, A., & Lord, C. (2003). The Social Communication Questionnaire: Manual. Western Psychological Services. Retrieved from
http://www.wpspublish.com/store/p/2954/social-communication-questionnaire-scq Salvador-Carulla, L., Reed, G. M., Vaez-Azizi, L. M., Cooper, S.-A., Martinez-Leal, R.,
Bertelli, M., … Saxena, S. (2011). Intellectual developmental disorders: towards a new name, definition and framework for “mental retardation/intellectual disability” in ICD-11.
World Psychiatry : Official Journal of the World Psychiatric Association (WPA), 10(3), 175–80. https://doi.org/10.1002/j.2051-5545.2011.tb00045.x
Schalock, R. L., & Luckasson, R. (2013). What’s at stake in the lives of people with intellectual disability? Part I: The power of naming, defining, diagnosing, classifying, and planning supports. Intellectual and Developmental Disabilities, 51(2), 86–93.
https://doi.org/10.1352/1934-9556-51.2.086
Shogren, K. A., Shaw, L. A., Wehmeyer, M. L., Thompson, J. R., Lang, K. M., Tassé, M. J., & Schalock, R. L. (2017). The Support Needs of Children with Intellectual Disability and Autism: Implications for Supports Planning and Subgroup Classification. Journal of Autism and Developmental Disorders, 47(3), 865–877.
https://doi.org/10.1007/s10803-016-2995-y
Slade, M., Powell, R., Rosen, a, & Strathdee, G. (2000). Threshold Assessment Grid (TAG): the development of a valid and brief scale to assess the severity of mental illness.
30
https://doi.org/10.1007/s001270050011
Smith, S., Branford, D., Collacott, R. A., Cooper, S. A., & McGrother, C. (1996). Prevalence and cluster typology of maladaptive behaviours in a geographically defined population of adults with learning disabilities. British Journal of Psychiatry, 169(2), 219–227.
https://doi.org/10.1192/bjp.169.2.219
Snell, M., Luckasson, R., Borthwick-Duffy, S., Bradley, V., Buntix, W., Coulter, D., … Yeager, M. (2009). Characteristics and needs of people with intellectual disability who have higher IQs. Intelle, 47(3), 220–233.
Soenen, S., Van Berckelaer-Onnes, I., & Scholte, E. (2009). Patterns of intellectual, adaptive and behavioral functioning in individuals with mild mental retardation. Research in Developmental Disabilities, 30(3), 433–444. https://doi.org/10.1016/j.ridd.2008.04.003
Speece, D. (1994). Cluster analysis in perspective. Exceptionality, 5(1), 19–30.
https://doi.org/10.1207/s15327035ex0501
Tassé, M. J., Luckasson, R., & Nygren, M. (2013). Aaidd proposed recommendations for ICD-11 and the condition previously known as mental retardation. Intellectual and Developmental Disabilities, 51(2), 127–131.
https://doi.org/10.1352/1934-9556-51.2.127
The Sainsbury Centre for Mental Health. (2004). Payment by Results : what does it mean for
mental health ?
Trevithick, L., Painter, J., & Keown, P. (2015). Mental health clustering and diagnosis in psychiatric in-patients. BJPsych Bulletin, 39(3), 119–23.
https://doi.org/10.1192/pb.bp.114.047043
31
Witwer, A. N., & Lecavalier, L. (2008). Examining the validity of autism spectrum disorder subtypes. Journal of Autism and Developmental Disorders, 38(9), 1611–1624.
32
Table 1: LDNAT Scales and subscales.
LDNAT Scale Titles LDNAT subscale
1 Overactive, aggressive, disruptive or agitated behavior Challenging behaviors
2 Non-accidental self-injury Challenging behaviors
3 Problem drinking or drug taking None
4 Cognitive problems Developmental needs
5 Physical illness or disability problems Developmental needs
6 Hallucinations or delusions Mental health & wellbeing
7 Depressed mood Mental health & wellbeing
8 Other mental and behavioral problems (Choose from: A phobic; B
anxiety; C obsessive-compulsive; D mental strain/tension; E
dissociative; F somatoform; G eating; H sleep; I sexual; J other).
Challenging behaviors
and
Mental health & wellbeing
9 Relationships Mental health & wellbeing
10 Activities of daily living (ADLs) Developmental needs
11 Living conditions Mental health & wellbeing
12 Occupation and activities Mental health & wellbeing
13 Strong unreasonable beliefs Mental health & wellbeing
14 Non-accidental self-injury (associated with cognitive impairment) Challenging behaviors
15 Physical problems with eating and drinking Developmental needs
16 Agitated behavior/expansive mood Challenging behaviors
17 Repeat Self-Harm Challenging behaviors
18 Safeguarding other children & vulnerable dependent adults Challenging behaviors
19 Engagement Challenging behaviors
20 Vulnerability Developmental needs
21 Social communication difficulties Developmental needs
22 Communication problems Developmental needs
33
Table 2: Cluster sizes, LDNAT characteristics and working titles.
Cluster Statistically significant scoring differences between clusters
based on
one-way ANOVA and post-hoc Tukey
HSD tests
E F A B C D
Cluster Working title Low need requiring general support and monitori ng Moderate need requiring sustained input Moderate need requiring focused input including emphasis on ASD High need requirin g sustain ed and focused input with an emphas is on physica l health High need requiring sustained and focused interventio
n with an
emphasis on challengin g behaviors and ASD High need requiring sustained and focused interventions with emphasis on mental health
Membership N=472 (27.9%) N=309 (18.3%) N=329 (19.4%) N=219 (12.9%) N=178
(10.5%) N=185 (10.9%)
Mean LDNAT
developmental
needs component
score (S.D.)
6.7 (3.0) 7.6 (6.1) 12.1 (2.9) 20.2 (4.5) 19.4 (3.4) 11.8 (3.9) E,F<A,D<B,C
Mean LDNAT
challenging
behavior
component score (S.D.)
2.7 (2.2) 9.1 (3.1) 7.1 (2.7) 3.3 (2.9) 13.8 (4.3) 14.7 (4.3) E<B<A<F<C<D
Mean LDNAT mental health
& wellbeing
component score (S.D.)
2.5 (2.3) 3.9 (2.5) 5.2 (2.8) 27 (2.7) 5.9 (3.5) 11.01 (2.9) E<B<F<A<C<D
Mean LDNAT
total score (S.D.)
34
Relatively low
needs*
1,4,9,10,
16,19,20,
21,22
10,21,22 1,8,16
Relatively high
needs* 16,17 21
4,5,10,
15,20,2
2,23
1,4,8,9,10,
14,16,18,1
9,20,21,22
1,2,6,7,8,9,11,
12,13,16,17,18
,19
35
Table 3: Cluster demographics, and association with clinical variables.
Characteristic Cluster
Description
Recordin
g rate for
sample
E
(n=472) F (n=309) A (n=329) B (n=219) C (n=178) D (n=185)
Cluster Working
title N/A
Low need requiri ng general support and monito ring Moderate need requiring sustained input Moderate need requiring focused input including emphasis on ASD High need requiring sustained and focused input with an emphasis on physical health High need requiring sustained and focused intervention with an emphasis on challenging behaviors and ASD High need requiring sustained and focused interventions with emphasis on mental health
Mean age in
years (S.D) 100%
44.0
(16.5) 42.0 (15.4) 39.8 (16.4) 46.6 (15.8) 36.9 (15.0) 37.9 (14.4)
% Males 100% 48.7% 58.6% 61.1% 50.2% 61.2% 49.2%
% ATUs 86.6% 0.0% 4.0% 2.9% 2.6% 12.1% 26.9%
Most common
primary
diagnosis (% of
those recorded)
40.4% Mild ID
(44.4%) Mild ID (48.4%) Mod ID (41.7%) Mod ID (18.4%) Severe ID (18.4%) Severe ID (32.5%) Mild ID (35.5%) Most common secondary
diagnosis (% of
those recorded)
26.8% Mild ID
(33.3%)
Mild ID
(30.9) Anxiety (16.9)
Diseases of nervous 39.1%) Diseases of nervous system (27.3%) Mild ID (21.1%) Most common primary medication type
(% of those
recorded) 36.1% Physical health med (27.6%) Antipsychotic (31.7%) Antipsychotic (27.4%) Anticonvulsant (48.7%) Antipsychotic (35.4%) Antipsychotic (30.7%) Most common secondary medication type
(% of those
recorded)
31.3% None
(55.4%) None (41.1%) None (41.3%)
Physical health
med (34.5%) None (27.8%)
Antidepressan
t (22.2%)
None (22.2%)
Mean total no of
36
Most frequent
intervention 31.8%
Physical
health
(23.9%)
Coping
strategies
(29.4%)
Coping
strategies
(31.6%)
Physical health
(43.7%)
Coping
strategies
(30.8%)
physical
health
(30.8%)
Coping
strategies
37
Table 4: Cluster scoring profiles for each of the six independently-rated
questionnaires used for preliminary cluster validation.
Cluster Significant scoring differences between clusters based on one-way ANOVA and post-hoc Tukey HSD tests
E F A B C D
Cluster description/ Measure Low need requiring general support and monitoring Moderate need requiring sustained input Moderate need requiring focused input including emphasis on ASD High need requiring sustained and focused input with an emphasis on physical health High need requiring sustained and focused intervention with an emphasis on challenging behaviors and ASD High need requiring sustained and focused interventions with emphasis on mental health WADL total Mean
(S.D.) 20.6 (7.4) 24.8 (5.0) 17.9 (5.7) 9.2 (7.8) 11.3 (6.3) 21.0 (5.3) B,C<,E,F,A,D
n 21 28 26 12 26 25
Physical
health tool
total
Mean
(S.D.) 2.4 (2.4) 1.7 (1.5) 2.3 (1.9) 5.6 (2.4) 4.2 (2.7) 1.1 (1.5)
F,A,D<E,C<B
n 11 15 20 10 19 14
PAS-ADD
total
Mean
(S.D.) 4.0 (6.8) 4.8 (8.0) 4.9 (7.0) 3.7 (6.0) 4.4 (6.1) 3.3 (6.1) None
n 19 25 22 10 22 26
SCQ total
Mean
(S.D.) 11.3 (3.6) 13.4 (4.3) 15.6 (4.8) 16.0 (5.8) 17.9 (6.1) 15.3 (4.5) E,F<A,C
n 20 28 29 12 26 26
BPI SIB
subscale
total
Mean
(S.D.) 3.0 (12.1) 9.8 (29.1) 3.2 (4.9) 1.7 (3.8) 15.0 (19.0) 5.2 (8.6) None
n 20 24 27 10 22 25
BPI
aggression
subscale
total
Mean
(S.D.) 6.1 (12.1) 5.6 (6.5) 10.2 (18.7) 4.9 (8.8) 35.3 (48.0) 22.2 (24.6)
E,F,A,B<C
38
BPI
stereotyped
subscale
total
Mean
(S.D.) 2.2 (4.1) 6.2 (10.9) 10.1 (11.8) 6.4 (7.0) 20.4 (17.1) 8.1 (9.9)
E,F,A,B,D<C
n 20 26 26 12 24 28
Mean TAG
safety
subscale
total
Mean
(S.D.) 0.6 (0.7) 1.0 (1.5) 1.2 (1.3) 0.6 (1.0) 2.2 (1.7) 1.6 (1.5)
E,F,B<C
n 21 28 30 12 26 27
TAG risk
subscale
total
Mean
(S.D.) 1.2 (1.0) 2.1 (1.7) 1.9 (1.6) 1.0 (1.3) 2.8 (1.7) 2.8 (1.6) E,B<C,D
n 20 28 29 12 27 27
TAG needs
&
disabilities
subscale
total
Mean
(S.D.) 2.2 (1.8) 3.1 (2.1) 4.3 (2.2) 3.1 (2.9) 5.3 (3.0) 5.1 (2.3)
E,F<A,C,D
n 22 28 30 11 25 27
TAG total
Mean
(S.D.) 4.0 (2.7) 6.3 (4.1) 7.4 (4.0) 4.8 (4.5) 10.7 (5.7) 9.6 (4.5) E,F,B<C,D
39
Figure 1: Example graphical comparison of mean LDNAT scoring profiles for
clusters.
0 0.5 1 1.5 2 2.5 3 3.5 4
1 2 3 4 5 6 7 8 9 10 11 12 13 14 15 16 17 18 19 20 21 22 23
M
e
an
sco
re
LDNAT Scale