go.warwick.ac.uk/lib-publications
Original citation:Ochoukov, R., Bobkov, V., Chapman, Benjamin, Dendy, R. O., Dunne, M., Faugel, H., García-Muñoz, M., Geiger, B., Hennequin, P., McClements, K. G., Moseev, D., Nielsen, S.,
Rasmussen, J., Schneider, P., Weiland, M. and Noterdaeme, J.-M. (2018) Observations of core ion cyclotron emission on ASDEX Upgrade tokamak. Review of Scientific Instruments, 89 (10). 10J101. doi:10.1063/1.5035180
Permanent WRAP URL:
http://wrap.warwick.ac.uk/104282
Copyright and reuse:
The Warwick Research Archive Portal (WRAP) makes this work by researchers of the University of Warwick available open access under the following conditions. Copyright © and all moral rights to the version of the paper presented here belong to the individual author(s) and/or other copyright owners. To the extent reasonable and practicable the material made available in WRAP has been checked for eligibility before being made available.
Copies of full items can be used for personal research or study, educational, or not-for profit purposes without prior permission or charge. Provided that the authors, title and full bibliographic details are credited, a hyperlink and/or URL is given for the original metadata page and the content is not changed in any way.
Publisher’s statement:
This article may be downloaded for personal use only. Any other use requires prior permission of the author and AIP Publishing.
The following article appeared in Review of Scientific Instruments and may be found at https://doi.org/10.1063/1.5035180
A note on versions:
The version presented here may differ from the published version or, version of record, if you wish to cite this item you are advised to consult the publisher’s version.
Observations of core ion cyclotron emission on ASDEX Upgrade tokamak
a)R. Ochoukov,1,b) V. Bobkov,1 B. Chapman,2 , R. Dendy,2,3 , M. Dunne,1 H. Faugel,1 M. García-Muñoz,4
B. Geiger,1 P. Hennequin,5 K.G. McClements,3 D. Moseev,6 S. Nielsen,7 J. Rasmussen,7
P. Schneider,1 M. Weiland,1 J.-M. Noterdaeme,1,8 ASDEX Upgrade Team,c) and EUROfusion MST1
Teamd)
1Max Planck Institute for Plasma Physics, Boltzmannstr. 2, D-85748 Garching, Germany
2Centre for Fusion, Space and Astrophysics, University of Warwick, Coventry, CV4 7AL, United Kingdom 3CCFE, Culham Science Center, Abingdon, Oxfordshire, OX14 3DB, UK
4FAMN Department, Faculty of Physics, University of Seville, 41012 Seville, Spain 5Laboratoire de Physique des Plasmas, Ecole Polytechnique, 91128 Palaiseau, France 6Max Planck Institute for Plasma Physics, Wendelsteinstr. 1, 17491, Greifswald, Germany
7Department of Physics, Technical University of Denmark, Fysikvej, b. 309, DK-2800 Kgs. Lyngby, Denmark 8Applied Physics Department, UGent, 9000 Gent, Belgium
(Presented XXXXX; received XXXXX; accepted XXXXX; published online XXXXX)
(Dates appearing here are provided by the Editorial Office)
The B-dot probe diagnostic suite on the ASDEX Upgrade tokamak has recently been upgraded with a new 125 MHz, 14 Bit resolution digitizer to study ion cyclotron emission (ICE). While classic edge emission from the low field side plasma is often observed, we also measure waves originating from the core with fast fusion protons or beam injected deuterons being possible emission driver. Comparing the measured frequency values with ion cyclotron harmonics present in the plasma places the origin of this emission on the magnetic axis, with the fundamental hydrogen/second deuterium cyclotron harmonic matching the observed values. The actual values range from ~27 MHz at on-axis toroidal field BT = -1.79 T to ~40 MHz at BT = -2.62 T. When the magnetic axis position evolves during this emission, the measured frequency values track the changes in the estimated on-axis cyclotron frequency values. Core ICE is usually a transient event lasting ~100 ms during the neutral beam startup phase. However, in some cases core emission occurs in steady-state plasmas and lasts for longer than 1 s. These observations suggest an attractive possibility of using a non-perturbing ICE-based diagnostic to passively monitor fusion alpha particles at the location of their birth in the plasma core, in deuterium-tritium burning devices such as ITER and DEMO.
I. INTRODUCTION
The purpose of this paper is to present novel detailed observations of ion cyclotron emission (ICE) originating from the plasma core region in ASDEX Upgrade (AUG) plasmas. Frequency matching between the measured value and the cyclotron frequency (ci = qiB/mi, where ci is the angular cyclotron frequency of the ion species i, qi is the ion charge, B is the magnitude of the local magnetic field, and mi is the ion mass) provides information on the likely source location of the emission and which ion species could be responsible for driving it. This technique places the origin of the observed ICE signal at the magnetic center of the plasma with either the fundamental minority proton or the second deuterium cyclotron harmonic (or both) exciting the emission. The possibility that this emission could be excited by fusion products at the location of their birth, in the
plasma core, raises the intriguing possibility of using an ICE diagnostic as a passive non-perturbing method to study fusion born alpha particles in D-T burning fusion reactors such as ITER and DEMO. Note that a similar case has been
made previously by McClements et al.1, our paper
strengthens their case with core ICE observations.
ICE is a frequently observed phenomenon in toroidal magnetized plasma devices such as tokamaks and stellarators2-8. The emission consists of radio frequency (RF) waves generated by a resonant interaction between fast ions and a plasma instability. The frequency of the emission is in the ion cyclotron range-of frequency (ICRF) band, typically 10-100 MHz in conventional tokamaks. The sources of fast ions can be fusion reactions, neutral beam injections (NBI), or acceleration by ICRF waves. The most likely instability type responsible for the emission is the
magnetoacoustic cyclotron instability (MCI)9. ICE
observations are not limited to a single type of toroidal confinement device. Examples of ICE in tokamaks include ASDEX Upgrade2, JET3, TFTR4, DIII-D5, KSTAR6, and JT-60U7. An example of ICE observed on a stellarator is from LHD8. Note that the presence of fast ions alone is not enough to generate ICE, the fast ion population must also be either non-monotonic (e.g. bump-on-tail) in energy10 or a)Published as part of the Proceedings of the 22nd Topical Conference on
High-Temperature Plasma Diagnostics (HTPD 2018) in San Diego, California, USA.
b)Author to whom correspondence should be addressed:
roman.ochoukov@ipp.mpg.de
anisotropic in its velocity components3, or both. Additionally, as ICE diagnostics are generally placed near or behind the first wall, the excited wave must be able to reach the detector without undergoing complete reabsorption/scattering.
“Classic” ICE, originating from the low field side plasma edge, is usually attributed to local non-monotonicity and anisotropy of the fast ion distribution function resulting from the large excursion orbits of certain fast ions from the core to the edge3. However, core ICE excitation, driven by fast fusion products born in beam-target fusion reactions, could also occur if the fast ions are non-monotonic10 or anisotropic. The aim of our paper is to present detailed ICE measurements from ASDEX Upgrade that show emission taking place close to the magnetic axis, with fusion-born fast protons being a likely driver. These measurements have been obtained with a new ICE diagnostic, which is the subject of the following section.
II. DIAGNOSTIC DESCRIPTION
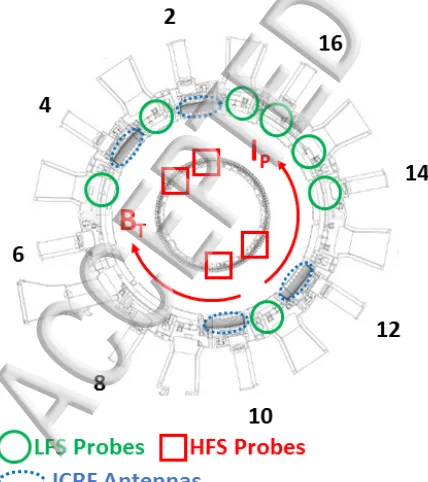
ICE is an electromagnetic wave, which consists of time-varying electric and magnetic field components. As a result, it is possible to detect the emission signal directly with an inductor, or a B-dot probe. ASDEX Upgrade is equipped with multiple in-torus B-dot probes11. These are positioned on both the low- and the high-field sides (LFS and HFS) of the tokamak (Fig. 1). At each position shown in Fig. 1 there are two probes oriented perpendicular to each other, with the exception of the probe pair in Sector 11 (Fig. 1): these two probes are oriented parallel to each other to allow a phase/wavenumber measurement. Poloidally, the
LFS probes are near the midplane and the HFS probes are ~0.8 m above the midplane.
The signal outputs from all of the probe pairs are digitized with so-called slow digitizers11. The slow digitization scheme relies on rectifying an RF signal into a DC voltage via a logarithmic (log) RF detector11. Each log detector contains two RF inputs, which makes it possible to measure the phase between the inputs. The phase value is also output in the form of a DC voltage11. Once rectified, the DC outputs of the log detectors are then digitized via a serial input/output-based system at 200 kHz11. To minimize the effects of low frequency plasma waves and high frequency harmonics on the output signal, the log detectors are equipped with a pair of bandpass filters – the RF signal is strongly attenuated below 10 MHz and above 50 MHz before it is rectified11. The slow digitization scheme loses the information on the RF signal frequency. As a result, a different fast digitization scheme has been installed on AUG during the 2017 experimental campaign to obtain the ICRF and ICE frequency spectrum.
The RF signal from the Sector 11 probe pair (the pair with the two probes oriented parallel to each other; see Fig. 1) is divided via a 3 dB splitter – one half of the signal is routed to a slow digitizer and the second half is digitized by the fast system. The fast digitization scheme consists of a 2-channel, 125 MHz, 14 Bit digitizer12. The internal memory of the digitizer (500 MB) limits the data acquisition duration per plasma shot: the system samples the two RF signals during a 1 ms time window, every 10 ms, for the duration of 8 s, long enough for most AUG discharges. Due to a limited data storage space available, the fast system only operates when requested. The fast digitizer system is equipped with four notch filters, two are centered at 30.0 MHz and two at 36.5 MHz, with 40 dB attenuation at the central frequency and with a 3.0 dB width of 1.4 MHz. The purpose of the notch filters is to remove the frequency component launched by ICRF antennas, in order to study ICE. The three modes of operation of the fast digitization scheme are 1) no filters applied; 2) with the 30 MHz filters active; and 3) with the 36.5 MHz filters active. The fast system is positioned inside the torus hall and can be accessed remotely via an Ethernet connection to control the state of the notch filters and retrieve the data. In the following section we present ICE results obtained either in ICRF-free discharges or before ICRF-on phases, with the fast diagnostic operating in the “no filters applied” mode.
III. EXPERIMENTAL RESULTS AND DISCUSSION
[image:3.612.60.274.452.693.2]To demonstrate the fast diagnostic capabilities, we first present a “classic” ICE example – low field side edge emission in the presence of neutral beam injected fast ions (Fig. 2 (a)). To avoid any ambiguity in the identification of the driving fast ion species, the discharge considered here has a hydrogen target plasma, heated with hydrogen beams (operated at 52 keV and 72 keV primary injection energies). The on-axis toroidal magnetic field (BT) is -2.47 T and the plasma current is 0.8 MA. The discharge is in H-mode,
FIG. 1. A top cross-sectional view of the RF probe positions in ASDEX Upgrade. Shown are the low field side (LFS) probes, the high field side (HFS) probes, and the ICRF antennas. The standard direction of the plasma current IP (+) and the toroidal magnetic field BT (-) are shown. The numbers
which is maintained by 4.5 MW of NBI and 2.7 MW of electron cyclotron resonance heating (ECRH) power. A plasma triangularity scan is performed between 2 s and 3 s of the discharge, which changes the edge localized modes
(ELMs) from a high- to a low-frequency type, while maintaining the heating power constant (Fig. 2 (a)). During this time the plasma stored energy increases (Fig. 2 (b)), and after this increase an instability develops with a frequency of ~30 MHz (Fig 2 (c) and (d)). Frequency matching with the fundamental hydrogen cyclotron frequency places the origin of this emission at the low field side plasma boundary, at the same radial position as the plasma pedestal. Once the ICE has developed, the emission characteristics are often not constant in time but show periodic modulations that are correlated with the ELM crashes.
[image:4.612.49.539.30.714.2]We occasionally observe on ASDEX Upgrade that deuterium plasmas heated with deuterium NBI power (operated at 60 keV primary injection energy) generate ICE at frequencies that match the hydrogen cyclotron frequency/second deuterium cyclotron harmonic at the position of the magnetic axis, not the edge (Fig. 3). This emission type has been detected in both H-mode (Fig. 3) and L-mode plasmas on AUG. The observed frequency ranges from ~27 MHz at BT = -1.79 T to ~37 MHz at BT = -2.47 T (Fig. 3). For the case of the lower magnetic field BT = -1.79 T, the second harmonic at ~54 MHz is also detected by the fast digitizer (Fig. 4). This emission type usually appears during the first 100 ms of the NBI startup phase (Fig. 3 (a)-(d)), which is still long enough to be easily detected between the 10 ms acquisition windows of the fast diagnostic. Since the plasma pressure profile evolves during this time interval and shifts the radial position of the magnetic axis (Fig. 3 (b)), the estimated on-axis hydrogen cyclotron frequency (fH+) also changes. The measured ICE frequency tracks this change of fH+ (Fig. 3 (d)). The short duration of core ICE
FIG. 2. A “classic” ICE example of low field side edge emission due to NBI fast ions on ASDEX Upgrade (discharge #34716, BT= 2.47 T, H
plasma, H beams). The plotted quantities are (a) the NBI power PNBI; (b)
the stored plasma energy WMHD; (c) the RF probe amplitude on the low
[image:4.612.61.509.458.703.2]field side, on a logarithmic scale; and (d) the measured ICE intensity frequency spectrum f, on a logarithmic scale (see (c) for relative scale).
FIG. 3. Examples of core ICE at BT= 1.79 T (discharge #34552, (a)-(d)) and BT = 2.47 T (discharge #34571, (e)-(h)). D plasma and D beams. The plotted
quantities are the NBI power PNBI (a) and (e); the radial position of the magnetic axis Rmag (b) and (f); the amplitude of the RF signal on the low and the high
in discharges such as #34552 is in line with the expectation that such phenomena are only likely to occur transiently, before the fast particles driving the emission quickly relax to form a slowing-down distribution that decreases monotonically with energy10.
However, we also observe cases in which a core instability occurs during a steady-state part of the discharge and persists for longer than 1 s (Fig. 3 (e)-(h)). Although it is not clear what triggers the core ICE shown in Fig. 3 (e)-(h), the instability promptly disappears when the NBI source switches from a tangential to a more radial injection geometry (while maintaining the total injected power constant) (Fig. 3 (h)). Interestingly, the high field side (HFS) probes also observe this core ICE, albeit at a reduced amplitude compared to the low field side (LFS) probes (Fig. 3 (c) and (g)). This suggests that the reabsorption of the excited wave by the bulk plasma is not complete in either radial direction as ICE travels radially from the source to the low and the high field sides.
The 1 ms acquisition time window of the fast ICE diagnostic allows us to measure ICE features with 1 kHz resolution in the frequency domain. We often observe that core ICE consists of multiple closely spaced frequency peaks (Fig. 5). The dominant splitting usually consists of 2-4 peaks (but can be more) that are ~100-200 kHz apart (Fig. 5 (a) and (c)). However, a fine scale splitting of individual peaks (~10 kHz apart) can also be seen (Fig. 5 (c)). This fine splitting is more apparent when examining the phase output of the slow ICE diagnostic measured between two probes ~2.4 cm apart: the phase value is not constant but shows periodic sweeps (every ~0.1 ms) (Fig. 5 (d)). These phase sweeps are consistent with a beatwave formed by ICE waves that are ~10 kHz apart. Thus the phase measurement confirms that the observed fine frequency splitting is a feature of the emission. Independent observations of frequency splitting have also been made in NBI heated discharges on the TUMAN-3M tokamak13.
An important issue is the possible fast ion driver of the observed core ICE. The fundamental minority hydrogen and second harmonic deuterium cyclotron resonances coincide (Fig. 6), and both of these fast ion species are present in deuterium plasmas heated with deuterium NBI: fast hydrogen ions are produced as a result of the D-D nuclear fusion reaction and fast deuterium ions are directly injected by NBI. The fast fusion protons, once born in the core of ASDEX Upgrade discharges, are not all promptly lost to the wall. Two independent fast ion (full orbit) tracking codes, Orb and Dimon, have been used to determine the region of velocity space of fast fusion protons born at the magnetic axis corresponding to confined orbits. The codes show that protons born with pitch values (V/VTot, where V is the
[image:5.612.36.293.49.295.2]fast ion velocity component parallel to the local magnetic field and VTot is its total velocity) greater than 0.45 (co-current) and less than -0.72 (counter-(co-current) remain confined (Fig. 6) and can, in principle, drive the observed emission. The thermalized hydrogen fraction is typically 5% in AUG D+ discharges, sufficient to ensure the existence
FIG. 4. ICE frequency spectrum for the discharge shown in Fig. 3 (a)-(d).
FIG. 5. Measured ICE spectra (a) during NBI pulses (b) in discharge at BT = 2.62 T. The effect of frequency splitting at levels of ~100 kHz and ~10 kHz (c)
[image:5.612.63.537.541.719.2]of the hydrogen minority-wave resonance in the plasma core. However, ICRF power was not applied during any of the time intervals considered here, and so fusion reactions are the only source of hydrogen ions capable of driving ICE. The Alfvѐn velocity in the core plasma is ~5-6106 m s-1, well below the fast fusion proton birth velocity (2.4107 m s-1) but a factor of two above the injected deuterium beam ion birth velocity (2.4106 m s-1). This suggests that the core ICE driver is likely to be the fusion-born protons and not the beam ions, since it is driven more readily when the fast ions are super-Alfvѐnic14. Indeed fusion protons were identified as the driver of ICE in the KSTAR discharges considered in Ref.15, although in this case the emission frequencies place the origin of the emission at the low field side plasma edge rather than at the magnetic axis. However, to unambiguously resolve the nature of the core ICE driver (fast proton vs fast deuteron), one needs to calculate the particle-wave coupling strength for the two fast ion species using a suitable numerical scheme16.
IV. CONCLUSIONS
The ICE diagnostic on ASDEX Upgrade has been upgraded with a fast 2-channel, 14 Bit resolution digitizer, which makes it possible to study ICE in greater detail than before. While the classic ICE features of emission from the low field side plasma edge often occur in AUG plasmas (Fig. 2), we also observe emission with frequencies that are consistent with a magnetic axis location, with either fusion-born protons or deuterium beam ions driving this emission (Figs. 3 and 4). The frequencies of this core ICE range from ~27 MHz at BT = -1.79 T to ~40 MHz at BT = -2.62 T,
matching the fundamental hydrogen and the second harmonic deuterium cyclotron frequencies at the magnetic axis location (Figs. 3 (d) and (h)). If the magnetic axis undergoes a radial shift during core ICE, the measured ICE frequency change tracks the calculated on-axis value (Fig. 3 (d)). The instability is usually brief (~100 ms long) and is most common during the NBI startup phase (Fig. 3 (a)-(d)). However, core ICE can also be excited during steady-state conditions, and can persist for more than 1 s (Fig. 3 (e)-(h)). The high resolution of the new fast ICE diagnostic reveals fine-scale structures in core ICE: two levels of frequency splitting are present at characteristic values of ~100 kHz and ~10 kHz (Fig. 5). In general, core ICE observed on ASDEX Upgrade is consistent with the theoretical expectations by Cordey et al.10 — an instability which is driven by fast fusion born ions in the plasma core. These measurements strengthen the case of an ICE diagnostic as a non-perturbing method of observing centrally-born fusion alpha particles in deuterium-tritium burning plasma devices such as ITER or DEMO1.
V. ACKNOWLEDGMENTS
This work has been carried out within the framework of the EUROfusion Consortium and has received funding from the Euratom research and training programme 2014-2018 under grant agreement No 633053. The views and opinions expressed herein do not necessarily reflect those of the European Commission. The authors also acknowledge the contribution of Rodolphe D’Inca in the conceptual design and assembly of the fast ICE diagnostic on ASDEX Upgrade. Fruitful discussions with Roberto Bilato on the subject of ICE are also acknowledged.
VI. REFERENCES
1K.G. McClements, et al., Nucl. Fusion 55, 043013 (2015). 2R. D’Inca, M. Garcia-Munoz, G. Tardini, J-M. Noterdaeme, and the
ASDEX Upgrade Team, Proc. of 38th EPS Conf. on Plasma Physics, 2011 3G.A. Cottrell et al., Nucl. Fusion 33, 1365 (1993).
4K. G. McClements, R. O. Dendy, C. N. Lashmore-Davies, G. A. Cottrell,
S. Cauffman and R. Majeski, Phys. Plasmas 3, 543 (1996).
5W W Heidbrink et al., Plasma Phys. Control. Fusion 53, 085028 (2011). 6S G Thatipamula, G S Yun, J Leem, H K Park, K W Kim, T Akiyama,
and S G Lee, Plasma Phys. Control. Fusion 58, 065003 (2016).
7M. Ichimura, et al., Nucl. Fusion 48, 035012 (2008). 8K. Saito et al., Plasma Sci. Technol. 15, 209 (2013).
9R. O. Dendy, C. N. Lashmore-Davies, K. G. McClements, and G. A.
Cottrell, Phys. Plasmas 1, 1918 (1994).
10J.G. Cordey, R.J. Goldston, and D.R. Mikkelsen, Nucl. Fusion 21, 581
(1981).
11R. Ochoukov, V. Bobkov, H. Faugel, H. Fünfgelder, J.-M. Noterdaeme,
and ASDEX Upgrade Team, Rev. Sci. Instrum. 86, 115112 (2015).
12R. Ochoukov et al., EPJ Web of Conferences 157, 03038 (2017). 13L. G. Askinazi, A. Belokurov, D. B. Gin, V. A. Kornev, S. V. Lebedev,
A. E. Shevelev, A. S. Tukachinsky and N. A. Zhubr, accepted for publication in Nucl. Fusion (2018).
14R. O. Dendy, C. N. Lashmore-Davies, and K. F. Kam, Phys. Fluids B 4,
12 (1992).
15. Chapman, R. O. Dendy, K. G. McClements, S. C. Chapman, G. S.
Yun, S. G. Thatipamula, and M. H. Kim, Nucl. Fusion 57, 124004 (2017).
16L. Carbajal, R. O. Dendy, S. C. Chapman, and J. W. S. Cook, Phys.
[image:6.612.62.258.70.323.2]Plasmas 21, 012106 (2014). FIG. 6. Frequency matched radial positions of the fundamental deuterium