warwick.ac.uk/lib-publications
Original citation:
Castro Degrossi, L., Porto de Albuquerque, João, dos Santos Rocha, R. and Zipf, A. (2018) A
taxonomy of quality assessment methods for volunteered and crowdsourced geographic
information. Transactions in GIS, 22 (2). pp. 542-560. doi:10.1111/tgis.12329
Permanent WRAP URL:
http://wrap.warwick.ac.uk/99519
Copyright and reuse:
The Warwick Research Archive Portal (WRAP) makes this work of researchers of the
University of Warwick available open access under the following conditions.
This article is made available under the Creative Commons Attribution 4.0 International
license (CC BY 4.0) and may be reused according to the conditions of the license. For more
details see:
http://creativecommons.org/licenses/by/4.0/
A note on versions:
The version presented in WRAP is the published version, or, version of record, and may be
cited as it appears here.
R E S E A R C H A R T I C L E
A taxonomy of quality assessment methods for
volunteered and crowdsourced geographic
information
Lívia Castro Degrossi
1|
Jo
~
ao Porto de Albuquerque
1,2,3|
Roberto dos Santos Rocha
1|
Alexander Zipf
31
Institute of Mathematics and Computer Science, University of S~ao Paulo, S~ao Carlos, Brazil
2
Centre for Interdisciplinary Methodologies, University of Warwick, Coventry, United Kingdom
3
Institute of Geography, Heidelberg University, Heidelberg, Germany
Correspondence
Lívia Castro Degrossi, Institute of Mathe-matics and Computer Science, University of S~ao Paulo, 400 Trabalhador S~ ao-carlense Avenue, 13566-590 S~ao Carlos, S~ao Paulo, Brazil.
Email: degrossi@icmc.usp.br
Funding information
Marie Curie Actions/Initial Training Networks, Grant/Award No. 317382; Coordenaç~ao de Aperfeiçoamento de Pessoal de Nível Superior, Grant/Award No. 88887.091744/2014-01; Conselho Nacional de Desenvolvimento Científico e Tecnologico, Grant/Award No. 201626/ 2015-2; Federal University of Bahia; Uni-versität Heidelberg; Engineering and Physi-cal Sciences Research Council (EPSRC)
Abstract
The growing use of crowdsourced geographic information (CGI) has
prompted the employment of several methods for assessing
informa-tion quality, which are aimed at addressing concerns on the lack of
quality of the information provided by non-experts. In this work, we
propose a taxonomy of methods for assessing the quality of CGI
when no reference data are available, which is likely to be the most
common situation in practice. Our taxonomy includes 11 quality
assessment methods that were identified by means of a systematic
lit-erature review. These methods are described in detail, including their
main characteristics and limitations. This taxonomy not only provides
a systematic and comprehensive account of the existing set of
meth-ods for CGI quality assessment, but also enables researchers working
on the quality of CGI in various sources (e.g., social media, crowd
sensing, collaborative mapping) to learn from each other, thus opening
up avenues for future work that combines and extends existing
meth-ods into new application areas and domains.
1
|I N T R O D U C T I O N
The use of crowdsourced geographic information (CGI) has grown in the past few years, owing to a number of key
fea-tures (e.g., it is free, up-to-date, and provided by several volunteers). CGI is being used as an umbrella term that
encom-passes both“active/conscious”and“passive/unconscious”georeferenced information generated by non-experts (See
...
This is an open access article under the terms of the Creative Commons Attribution License, which permits use, distribution and reproduction in any medium, provided the original work is properly cited.
VC2018 The Authors.Transactions in GISpublished by John Wiley & Sons Ltd.
et al., 2016). This term has been used as a broader replacement for volunteered geographic information (VGI)
(Good-child, 2007), since the term“volunteered”does not seem appropriate to refer to information that is collected without
the will or conscious knowledge of the provider (Harvey, 2013).
When making use of CGI, ensuring the quality of the information is a challenging question. The information that is
supplied by non-experts mostly does not have to comply with any quality standards, and there is no centralized control
over the creation process. Quality assessment thus becomes an important step to understand if the information is
fit-for-purpose with regard to the way it will be used (Ballatore & Zipf, 2015).
The quality of CGI has become a very popular topic amongst academics and researchers (Antoniou & Skopeliti,
2015). Several researchers have investigated approaches to assess the quality of CGI, so that there is currently a large
number of methods to accomplish this task (e.g., Foody et al., 2013; Girres & Touya, 2010; Senaratne, Br€oring, & Schreck, 2013). These methods differ with regard to the type of information evaluated, and reference data types,
among other factors. Owing to the large number of existing methods, selecting the most appropriate one for a
particu-lar purpose is not a trivial task.
In an attempt to summarize the existing methods in the literature, some previous studies have reviewed and
cate-gorized them (Bordogna, Carrara, Criscuolo, Pepe, & Rampini, 2016; Mirbabaie, Stieglitz, & Volkeri, 2016; Senaratne,
Mobasheri, Ali, Capineri, & Haklay, 2017; Wiggins, Newman, Stevenson, & Crowston, 2011). However, these previous
studies do not differentiate clearly between assessment methods that require a reference dataset and methods that
can be used when no comparable data is available. The latter is probably the most frequent situation in practice, since
the use of CGI is often motivated by a lack of availability (or currency) of authoritative data sources.
Against this backdrop, this article is motivated by the following research question:What types of methods can be
employed to assess the quality of CGI in the absence of authoritative data?We address this question by designing a
tax-onomy of the existing methods in the literature. The purpose of this taxtax-onomy is to form a basis for the researchers
and designers of collaborative platforms based on CGI, so that they can select the best method for their purposes, by
discussing the idiosyncrasies of each method. Additionally, the taxonomy can be used to systematically summarize
research results in the literature and determine where further investigation is still needed.
The remainder of this article is structured as follows. Section 2 presents background concepts on the quality of
CGI. In Section 3, there is an overview of related works. In Section 4, the methodology employed for the development
of the taxonomy is described. Following this, the proposed taxonomy is described in detail in Section 5. In Section 6,
we discuss our findings and the limitations of our taxonomy, and make suggestions for future research. Finally, in
Sec-tion 7, we summarize our conclusions.
2
|Q U A L I T Y O F C R O W D S O U R C E D G E O G R A P H I C I N F O R M A T I O N
The quality of CGI largely depends on different factors, such as the characteristics of the volunteer, the type of
infor-mation, and the way in which the information is produced (Bordogna et al., 2016). CGI is provided by a wide range of
sources (i.e., volunteers), who have different levels of expertise and come from different backgrounds, which can be
classified into three types of collaborative activities (Albuquerque, Herfort, Eckle, & Zipf, 2016), described as follows.
Social mediaThe first type of collaborative activity comprises volunteers sharing geographic information on social media, which are Internet-based applications built on the ideological and technological foundations of Web 2.0 (Kaplan
& Haenlein, 2010). Volunteers use social media to share their experience and/or opinion in“feeds” or“messages,”
which may contain a geographic reference and thus be used as a source of“ambient geographic information”
(Stefani-dis, Crooks, & Radzikowski, 2013).
Collaborative mappingThe third type of collaborative activity entails generating a particular type of digital data (i.e., data about“geographic features,”which we understand as characteristics of the geographic space). This type of activity
requires volunteers to produce a very specific type of georeferenced data, for instance geographic data about points
of interest, streets, roads, buildings, land use, etc. In our previous work, we proposed classifying the collaborative
map-ping tasks performed into three types of analytical tasks (Albuquerque, Herfort, & Eckle, 2016). In classification tasks,
volunteers analyze an existing piece of geographic information and classify it into a category that better represents it.
For instance, this might involve volunteers interpreting satellite imagery to classify land cover (Salk, Sturn, See, Fritz, &
Perger, 2016). In digitization tasks, volunteers create geographic data (including a geometry and a location) of a
real-world geographic object, for instance by digitizing building footprints (Mooney & Minghini, 2017). Finally, in conflation
tasks, volunteers analyze and interpret geographic information from multiple sources, conflating them to find matching
features/objects and thus produce new geographic information (e.g., detecting changes in geographic objects) (Anhorn,
Herfort, & Albuquerque, 2016).
These types of activity are referred to in various ways in the literature, and it is not our intention here to be
exhaustive (for a discussion on this, see See et al., 2016). In giving this summary of the types of collaborative activity
required for the production of crowdsourced geographic information, we would like to set up a context to discuss
issues related to the quality of the information. This summary shows that the different types of collaborative activity
result in geographic data with varying degrees of accuracy, structure, and format standardization. For instance, while
geotagged social media messages may have heterogeneous formats (e.g., text-, image-, and map-based data) and varied
structure, some projects employ a CGI standardized process for gathering CGI (e.g., Salk et al., 2016). However, even
with more standardized data formats and procedures, the extent to which volunteers will adhere to them is uncertain.
As a result, CGI is often suspected of having a heterogeneous quality and uncertain credibility (Flanagin & Metzger,
2008), which might affect the usability of the crowdsourced information (Bishr & Kuhn, 2013). The quality of CGI also
depends on how the information is used, since the quality of the information is determined by its“fitness for use”
within the context in which it is applied (Bordogna et al., 2016).
In the literature, the quality of CGI is often measured by making reference to the“quality elements”that are
tradi-tionally used to assess the quality of geographic information (International Organization for Standardization, 2013).
These quality elements include completeness, positional accuracy, and thematic accuracy, among others. Although
these elements can be applied to measure the quality of CGI, this type of information has particular features which
make assessing its quality different from traditional geographic data (Mohammadi & Malek, 2015). Hence, researchers
have added new elements to assist in assessing the quality of CGI (e.g., trust), or made new definitions for existing
quality elements (Fan, Zipf, Fu, & Neis, 2014; Girres & Touya, 2010).
These elements can be measured by means of different methods. Particularly, Goodchild and Li (2012)
pro-posed three approaches to assess the quality of CGI when authoritative data is not available. Thecrowdsourcing
approachrelies on the ability of a group of individuals (peers) to validate and correct erroneous information that
another individual might provide. In this sense, the term crowdsourcing (might) have two interpretations that are
rel-evant to quality assurance of CGI. In the first interpretation, quality might be assured on the basis of the number of
independent but consistent observations (i.e., an item of information can be strengthened by additional information,
reporting the same event from the same or nearby landmarks/points). For example, CGI reporting a flood event can
be strengthened by additional information from the same point or a point in the surrounding area. In the second
interpretation, quality can be assured in terms of the ability of the crowd to converge on the truth. In
OpenStreet-Map, for instance, if erroneous geographic information is provided, individuals (peers) are expected to edit and
cor-rect it (Mooney & Minghini, 2017).
Thesocial approachcould also be called hierarchical approach since it relies on a hierarchy of individuals who act
as moderators or gatekeepers of crowdsourcing platforms. Thus, quality is assured by a group of people who maintain
platform integrity, prevent vandalism and infringement of copyright, and avoid the use of abusive content. In the Flood
Citizen Observatory (Degrossi, Albuquerque, Fava, & Mendiondo, 2014), for instance, the platform administrator acts
approachinvolves comparing an item of geographic information with the body of geographic knowledge. Thus, this
approach adheres to rules such as the First Law of Geography, where“everything is related to everything else, but
near things are more related than distant things”(Tobler, 1970). Geographic information should, for instance, be
con-sistent with what is known about the location and surrounding area. In other words, it should be related to the space
in which the knowledge has been provided. For instance, Albuquerque, Herfort, Brenning, and Zipf (2015) showed that
when the overall number of flood-related tweets are compared, there is a tendency for“relevant”on-topic tweets to
be closer to flood-affected catchments.
Depending on which reference dataset is used, quality assessment methods can be classified as either extrinsic or
intrinsic. Extrinsic methods use external knowledge to measure the quality of CGI. Although authoritative data are
commonly used as external knowledge, their use can be constrained by financial costs, licensing restrictions (Mooney,
Corcoran, & Winstanley, 2010), and currency (Goodchild & Li, 2012). On the other hand, intrinsic methods do not rely
on external knowledge for assessing the quality of CGI. These methods may, for instance, analyze historical metadata
as a means of inferring the inherent quality of the data. Thus, it is possible to evaluate the quality of CGI regardless of
whether a reference dataset is available or not. However, in most cases, intrinsic methods do not allow absolute
state-ments to be made about CGI quality. Thus, they can only be used for making rough estimates of the possible data
qual-ity (Barron, Neis, & Zipf, 2014). Barron et al. (2014), for instance, proposed new intrinsic methods and indicators for
assessing the quality of OpenStreetMap data.
Furthermore, quality assessment methods can be employed in the light of two temporalities: (a)ex ante;and (b)ex
post(Bordogna et al., 2016). These differ with regard to the time when the assessment is carried out compared with
the creation time of CGI. Theex-antestrategy is employed before a CGI is created and seeks to avoid the creation of
low-quality CGI (Bordogna et al., 2016). As well as offering mechanisms for controlling data creation, these methods
also provide volunteers with resources for guiding the way information is produced. In contrast, theex-poststrategy is
employed after a CGI item has been created. This strategy aims at removing and improving CGI quality. This involves
first checking the quality of CGI and, later, filtering it.
3
|R E L A T E D W O R K S
Several critical literature reviews (or surveys) involving the categorization of quality assessment methods have been
conducted to provide an overview of this area (e.g., Bordogna et al., 2016; Mirbabaie et al., 2016; Senaratne et al.,
2017; Wiggins et al., 2011). An analysis of the quality assessment methods was carried out by Wiggins et al. (2011),
where the authors analyzed the data validation policy and quality assessment in citizen science projects (i.e., crowd
sensing). They found that the most common type of data validation is based on expert reviews conducted by trusted
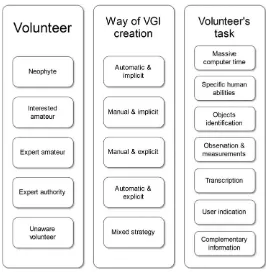
individuals or moderators. Bordogna et al. (2016) also analyzed CGI in citizen science projects. They initially reviewed
and categorized CGI projects, by analyzing the way they deal with CGI quality. This work also provided a classification
scheme (Figure 1) and a critical description of the strategies currently adopted to assure and improve CGI quality.
Bordogna et al. (2016) and Wiggins et al. (2011) conducted an important overview of quality assessment methods and
made significant recommendations for improving CGI quality in research projects. However, these authors only
ana-lyzed studies proposing methods for quality assessment of CGI in citizen science projects and did not take into account
other CGI sources such as collaborative mapping and social media.
Senaratne et al. (2017) conducted a critical literature review of the existing methods to assess the quality of the
main types of CGI: text, image, and map. This review examined methods that are based on theories and discussions in
the literature, and provided examples of the practical applicability of all the different approaches. In doing so, the
authors provided a general description of the methods used in each paper analyzed; however, they did not create a
taxonomy of methods for quality assessment. Moreover, this is a traditional literature review and, as many researchers
have pointed out, traditional reviews are prone to bias (i.e., authors may decide only to include studies with which they
are familiar or which support their particular standpoint) (Biolchini, Mian, Candida, & Natali, 2005; Mulrow, 1994). In
scientific, and transparent approach to locate the most significant literature about a given topic or discipline (Brereton,
Kitchenham, Budgen, Turner, & Khalil, 2007; Kitchenham & Charters, 2007).
Mirbabaie et al. (2016) conducted a systematic literature review on CGI in disaster management. The main
goal of this review was to provide information about the quality elements that are used, as well as the methods
that are employed to measure these elements. They found that attributes such as“accuracy”and“consistency”
are mainly used as criteria for quality assessment, while other factors such as“trustworthiness” are not fully
taken into account. However, they did not conduct an in-depth analysis of the existing methods with regard to
their applications and limitations, and were only concerned with the existing methods for disaster management.
Moreover, some key databases—such as Web of Science (WoS) and Scopus—were not used by Mirbabaie et al.
(2016).
4
|M E T H O D O L O G Y
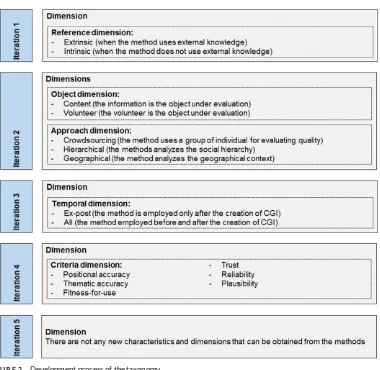
For developing the taxonomy, a rigorous and systematic method (Nickerson, Varshney, & Muntermann, 2013) was
adopted, providing guidance during the development stage. Since this method is iterative (Figure 2), we selected a subset
of the ending conditions (i.e., objective and subjective) that are required to terminate it, as shown in Tables 1 and 2,
respectively. We present as follows an overview of our usage of this method and the main stages, while a detailed
description of the development process of the taxonomy is provided as Supporting Information.
In Iteration 1, we adopted a conceptual-to-empirical approach, where the dimensions of the taxonomy are
concep-tualized without any examination of the objects (Nickerson et al., 2013), but rather based on conceptual distinctions
drawn from our literature review of the previous section. As noticed before, some quality assessment methods may
use external knowledge for assessing the quality of CGI (i.e., extrinsic), whereas others may not depend on this, but
F I G U R E 1 Classification schema of quality assessment methods
[image:6.485.108.374.41.313.2]rather require internal knowledge to carry out this task (i.e., intrinsic). We grouped both characteristics into the
refer-ence dimension. Since we added one dimension in this iteration, one more iteration was needed.
In Iteration 2, we decided to adopt the empirical-to-conceptual approach in which a subset of the objects is
classi-fied (Nickerson et al., 2013). On the basis of the studies we found in our SLR (Degrossi, Albuquerque, Rocha, & Zipf,
2017), we identified several quality assessment methods and selected the methods redundancy of volunteer’s F I G U R E 2 Development process of the taxonomy
T A B L E 1 Objective ending conditions
Objective ending condition Comments
All objects or a representative sample of objects have been examined
If all objects have not been examined, then the additional objects need to be studied
At least one object is classified under every characteristic of every dimension
If at least one object is not found under a characteristic, then the taxonomy has a“null”characteristic. We must either identify an object with the characteristic or remove the characteristic from the taxonomy
No new dimensions or characteristics were added in the last iteration
If new dimensions were found, then more characteristics of the dimensions may be identified. If new characteristics were found, then more dimensions may be identified that include these characteristics
[image:7.485.53.433.37.407.2] [image:7.485.38.449.536.647.2]contribution(M2),volunteer’s profile; reputation(M7), andspatiotemporal clustering(M6) based on suitability. On the
basis of our understanding of these methods, two new dimensions could be found (i.e., object and approach
dimen-sions). In the object dimension, the object under evaluation could be the information or the volunteer. In the approach
dimension, the method analyzes the geographical context (i.e., geographic approach), the social hierarchy (i.e., social
approach), or uses a group of people for evaluating quality (i.e., crowdsourcing approach). Since we added new
dimen-sions in this iteration, a further iteration was needed.
In Iteration 3, we adopted the conceptual-to-empirical approach once more in order to capture further conceptual
distinctions made in the field. As noticed before, quality assessment methods can be distinguished by comparing the
time of their application with the time of the creation of the CGI item (Bordogna et al., 2016). Some methods can be
employed after a CGI item has been collected (ex post), whereas other methods take place before a CGI item has been
created (ex ante). We grouped both characteristics into the temporal dimension. Since we added one dimension in this
iteration, a further iteration was needed.
In Iteration 4, we decided to adopt the empirical-to-conceptual approach again because there were still some
other methods that needed to be examined. We selected the methodsautomatic location checking(M5),extraction/
learning of characteristics(M9),ranking/filtering by linguistic terms(M10),volunteer’s profile; reputation(M7), andscoring
volunteered contribution(M3) from our SLR. On the basis of our understanding of these methods, we identified several
quality elements (i.e., positional accuracy, thematic accuracy, fitness-for-use, trust, reliability, and plausibility), which
T A B L E 2 Subjective ending conditions
Subjective ending conditions Questions
Concise Does the number of dimensions allow the taxonomy to be meaningful without being unwieldy or overwhelming?
Robust Do the dimensions and characteristics provide for differentiation among objects sufficient to be of interest?
Comprehensive Can all objects or a (random) sample of objects within the domain of interest be classified?
Extendible Can a new dimension or a new characteristic of an existing dimension be easily added?
Explanatory What do the dimensions and characteristics explain about an object?
Source: Adapted from Nickerson et al. (2013).
T A B L E 3 Dimensions and characteristics of the taxonomy
Dimension Characteristics
Reference Extrinsic: when the method uses external knowledge Intrinsic: when the method does not use external knowledge
Object Content: the information is the object under evaluation Volunteer: the volunteer is the object under evaluation
Approach Crowdsourcing: the method uses a group of individuals for evaluating quality Social: the method analyzes the social hierarchy
Geographical: the method analyzes the geographical context
Temporality Ex-post: the method is employed only after the creation of CGI All: the method is employed before and after the creation of CGI
Criteria Positional accuracy Thematic accuracy Fitness-for-use
[image:8.485.40.441.58.186.2] [image:8.485.40.450.499.660.2]were used to measure CGI quality. We grouped them into the criteria dimension. Since one dimension was added in
this iteration, one more iteration was needed.
In Iteration 5, we used the empirical-to-conceptual approach once again, since there were more methods that
needed to be examined. The methodsgeographic context(M1),expert assessment(M4),error detection/correction by
crowd(M8), andhistorical data analysis(M11) were selected from our SLR. After analyzing them, we were unable to
identify any new characteristics and dimensions, and thus they were classified in accordance with the characteristics
and dimensions outlined above. Since we did not add a new dimension in this iteration and finished examining all the
methods from our SLR, it can be concluded that the objective ending conditions were met. Furthermore, the taxonomy
met the subjective ending conditions.
The final set of dimensions and characteristics is shown in Table 3. We use them to build the taxonomy of quality
assessment methods, which is discussed in the following section.
5
|T A X O N O M Y O F Q U A L I T Y A S S E S S M E N T M E T H O D S
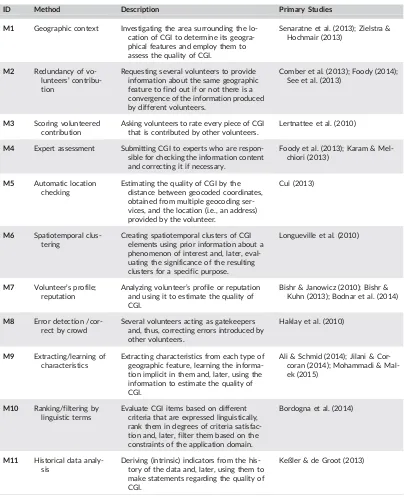
In this section, we introduce the taxonomy resulting from the analysis of the papers selected by our SLR (Degrossi
et al., 2017) (Table 4). This taxonomy comprises 11 methods that can be employed for assessing the quality of CGI
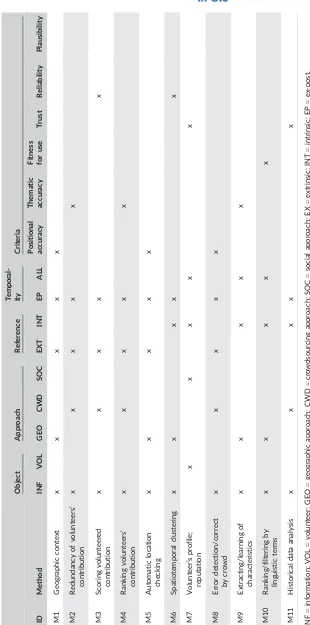
when authoritative data are not available. Moreover, it consists of a set of dimensions (Table 3) (i.e., reference, object,
approach, temporal, and criteria dimensions) that represent an abstraction of the main attributes of each method. Each
dimension has a set of possible values, which are called the characteristics of a method. The dimension“approach,”for
instance, comprises three possible characteristics (i.e., crowdsourcing, social, and geographical approaches). Each
method was classified in accordance with these dimensions and characteristics (Table 5).
In the following sections, we present a more detailed description of the existing methods to assess CGI quality.
We also provide practical examples of their applicability and discuss any drawbacks that might prevent their
employment.
5.1
|Geographic context
DescriptionEach place has its own distinguishing characteristics. The basic idea of the“geographic context”method consists of investigating the area surrounding the location of CGI to determine its geographical features and employ
them for assessing the likelihood that the citizen-generated data is consistent with those features. Both physical and
human geographical features (e.g., hydrological, geomorphological, socio-economical, demographic, etc.) could
poten-tially be used in this method.
ExampleSenaratne et al. (2013) examined the geographic context around Flickr photographs to determine which areas can be viewed from the CGI location, or more specifically, whether the point of interest (POI) lies within the line of
sight departing from the coordinates given in the CGI geotag. Similarly, Zielstra and Hochmair (2013) carried out an
investigation to evaluate the positional accuracy of geotagged photos from Flickr and Panoramio. Here, the positional
accuracy was estimated by measuring the distance between the image position and the estimated camera position
based on the imagery metadata.
LimitationA key factor when applying this method is determining which geographical features are related to the CGI content, since they must be matched. Furthermore, establishing reliable geographic relations is not a trivial
problem, since they may vary in accordance with the physical area and domain. Finally, this method may also be
constrained by the unsatisfactory quality of the reference data (e.g., the background map) used for the
5.2
|Redundancy of volunteers
’
contribution
Description This method involves requesting several volunteers to provide information about the same geo-graphic feature independently. Later, CGI quality is determined by comparing the volunteers’ contributions in
order to find out whether or not there is a convergence of the information independently produced by different
T A B L E 4 Summary of the quality assessment methods of the taxonomy and corresponding primary studies
ID Method Description Primary Studies
M1 Geographic context Investigating the area surrounding the lo-cation of CGI to determine its geogra-phical features and employ them to assess the quality of CGI.
Senaratne et al. (2013); Zielstra & Hochmair (2013)
M2 Redundancy of vo-lunteers’ contribu-tion
Requesting several volunteers to provide information about the same geographic feature to find out if or not there is a convergence of the information produced by different volunteers.
Comber et al. (2013); Foody (2014); See et al. (2013)
M3 Scoring volunteered contribution
Asking volunteers to rate every piece of CGI that is contributed by other volunteers.
Lertnattee et al. (2010)
M4 Expert assessment Submitting CGI to experts who are respon-sible for checking the information content and correcting it if necessary.
Foody et al. (2013); Karam & Mel-chiori (2013)
M5 Automatic location checking
Estimating the quality of CGI by the distance between geocoded coordinates, obtained from multiple geocoding ser-vices, and the location (i.e., an address) provided by the volunteer.
Cui (2013)
M6 Spatiotemporal clus-tering
Creating spatiotemporal clusters of CGI elements using prior information about a phenomenon of interest and, later, eval-uating the significance of the resulting clusters for a specific purpose.
Longueville et al. (2010)
M7 Volunteer’s profile; reputation
Analyzing volunteer’s profile or reputation and using it to estimate the quality of CGI.
Bishr & Janowicz (2010); Bishr & Kuhn (2013); Bodnar et al. (2014)
M8 Error detection /cor-rect by crowd
Several volunteers acting as gatekeepers and, thus, correcting errors introduced by other volunteers.
Haklay et al. (2010)
M9 Extracting/learning of characteristics
Extracting characteristics from each type of geographic feature, learning the informa-tion implicit in them and, later, using the information to estimate the quality of CGI.
Ali & Schmid (2014); Jilani & Cor-coran (2014); Mohammadi & Mal-ek (2015)
M10 Ranking/filtering by linguistic terms
Evaluate CGI items based on different criteria that are expressed linguistically, rank them in degrees of criteria satisfac-tion and, later, filter them based on the constraints of the application domain.
Bordogna et al. (2014)
M11 Historical data analy-sis
Deriving (intrinsic) indicators from the his-tory of the data and, later, using them to make statements regarding the quality of CGI.
[image:10.485.41.445.57.561.2]volunteers. In other words, the CGI quality is assumed to be higher when there is agreement among volunteers
with regard to the information content.
ExampleComber et al. (2013) estimated the degree of reliability of CGI by asking volunteers (i.e., experts, post-graduate students, scientists, and novices) to identify the type of land cover based on satellite imagery of a series
of locations. Similarly, See et al. (2013) employed this method to evaluate the accuracy and consistency of
volun-teers when labeling land cover and determining the human impact on the environment. In contrast, Foody (2014)
explored the redundancy of contributions to situations in which a large proportion of data is provided by poor
sources and/or is incomplete.
LimitationThis type of analysis is applicable to situations where it is practical to obtain several versions of the volun-teered information independently (i.e., in which different volunteers provide information about the same geographic
feature(s) independently and the quality can be associated with the degree of agreement among them). However, it is
worth noting that the ability to reach an agreement among volunteers will also depend on the difficulty of the task(s).
In other words, there is a greater chance of reaching an agreement when the tasks are“easy”than when they are
mod-erately hard to difficult (Albuquerque et al., 2016; Salk, Sturn, See, & Fritz, 2017). Moreover, since the information is
based on the knowledge of volunteers, it could cause problems as some of it may be less reliable and of poorer quality
(Comber et al., 2013).
5.3
|Scoring volunteered contribution
DescriptionIn this method, volunteers are asked to rate every piece of CGI that is contributed by other volunteers. A score is thus calculated from the individual rates given and assumed to represent“content quality.”
ExampleLertnattee, Chomya, and Sornlertlamvanich (2010) used a score calculated from the number of clicks on the button“Vote”given by members of the community to herbal information, a type of information related to
medicinal herbs.
Limitation The success of the method depends on how successful a platform is in gathering rates from volunteers, since it might require a large number of raters to arrive at a score that truly represents the“content quality.”
5.4
|Expert assessment
DescriptionFeedback and contributions from individuals that are familiar with an area or domain may greatly assist in estimating the quality of CGI (Karam & Melchiori, 2013). In this method, CGI is submitted to experts (i.e., individuals
who have a greater knowledge of the geographic area or domain and are responsible for checking the information
con-tent and correcting it if necessary). Later, all the CGI are ranked on the basis of the corrections made by the individuals.
When CGI is ranked in a lower position, it indicates the presence of malicious and/or wrong corrections. In other
words, it is CGI of a poorer quality.
ExampleKaram and Melchiori (2013) ranked CGI by employing four metrics: (a) the historical records of activities car-ried out by a volunteer; (b) the number of activities carcar-ried out by experts; (c) the feedback received after the change
was made; and (d) the score of the user that submitted the information.
5.5
|Automatic location checking
DescriptionThe location of a volunteer can be ascertained in different ways, such as GPS (global positioning system), manual georeferencing, or an address. However, the last of these could contain errors or typos. A way of automatically
determining the correct location of a volunteer is to compare geocoded coordinates, from multiple geocoding services,
with each other. Hence, the address should be submitted to several geocoding services, which will result in coordinates
that are represented by latitude and longitude. To qualify as reference data, the different geocoding services should
yield concordant results within a certain distance (Cui, 2013). The quality is, thus, estimated as the distance between
the geocoded coordinate and the location provided by the volunteer.
ExampleCui (2013) employed automatic location checking to determine the spatial accuracy of the location of farm-ers’markets.
LimitationThe reference data and geocoded methods used in the geocoding service might contain errors and, thus, lead to erroneous results (Cui, 2013). Hence, the use of multiple geocoding vendors’services can improve the reliability
of the resulting geocoded coordinates. Furthermore, the CGI location must be provided through an address or place
name that will be submitted to the geocoding services.
5.6
|Spatiotemporal clustering
Description CGI quality can be addressed by aggregating information from several volunteers (Mummidi & Krumm, 2008) and, later, by evaluating the significance of the resulting clusters for a specific purpose (Longueville, Luraschi,
Smits, Peedell, & Groeve, 2010). Thus, instead of checking the quality of a single CGI element, all elements are
eval-uated as a whole (i.e., the quality of the CGI cluster is assessed).
This method consists of creating spatiotemporal clusters of CGI elements using prior information about a
phenom-enon of interest. The clusters are created on the basis of the assumption that“CGI elements created at the same place
and time refer to the same event”(Longueville et al., 2010).
The process starts by creating temporal clusters, which are the CGI elements clustered in several temporal classes.
After this, the temporal classes are divided into sub-classes in compliance with spatial criteria. These steps convert raw
CGI of unknown quality into spatiotemporal clusters, the importance of which can be quantified by means of a ranking
score, which reflects the likelihood that an event took place in the time period and area that each cluster refers to.
ExampleLongueville et al. (2010) employed spatiotemporal clustering to assess the likelihood that a flood event took place (i.e., to locate inundation areas of flood events that occurred in the United Kingdom between January 1st, 2007
and March 31st, 2009).
LimitationAs Longueville et al. (2010) point out, when employing this method, a large dataset must be made available, since a low amount of data prevents a robust statistical analysis from being conducted. Hence, this method is less
suit-able for sparsely populated areas (e.g., rural areas), where only a few VGI elements are availsuit-able.
5.7
|Volunteer
’
s profile; reputation
DescriptionThe volunteer is an important factor in the quality of CGI, since his/her knowledge and background can have an influence on the data produced. By employing this method, the volunteer’s profile or reputation can be
ana-lyzed and used as a basis to estimate the quality of CGI. Bishr and Janowicz (2010) argue that if the volunteer has a
Example Bodnar, Tucker, Hopkinson, and Bilen (2014) analyzed volunteers’profiles to establish the veracity of volun-teered contributions with regard to four security-related events that took place in the U.S. In contrast, Bishr and Kuhn
(2013) employed this method to assess the trustworthiness of volunteers’statements regarding the quality of water from a
well.
LimitationThis method can be adversely affected if some of the metadata is missing or inaccurate (i.e., the metadata concerning a volunteer’s profile). Thus, before employing it, it is essential to check if reliable information about the
vol-unteers is available. Another limitation is that this method does not consider the extent to which users have the
neces-sary skills for a particular task or context. Volunteers may be reliable at producing data about the surroundings in
which they live, but when generating data about geographic areas for which they do not have any contextual
knowl-edge, they may produce less reliable geographic information (Klonner, Eckle, Uson, & H €ofle, 2017).
5.8
|Error detection/correct by crowd
DescriptionThis method is based on the so-called Linus’s law, according to which“given enough eyeballs, all bugs are shal-low”(Raymond, 1999). In the case of CGI, this can be understood as“given enough volunteers, all errors can be identified
and corrected.”
The basic idea behind this method is that a single individual might unintentionally introduce an error in a
crowdsourcing-based platform. Later, other people might notice this error and correct it, and hence the community of
volunteers acts as gatekeepers. This method is different from the redundancy of volunteers’contribution (Section 5.2),
since it is not based on an aggregation of information that is independently provided by volunteers, but rather relies on
peer verification of the information produced by other volunteers as a self-correcting mechanism.
ExampleHaklay, Basiouka, Antoniou, and Ather (2010) investigated whether Linus’s law applies to the positional accu-racy of OSM data (i.e., if the positional accuaccu-racy of a given geographic feature in OSM increases incrementally with the
number of volunteers).
LimitationAs Linus’s law states, there should be enough eyeballs (volunteers) to identify and correct the errors. How-ever, this could be a drawback, since a large number of people may be needed to achieve good quality. This can be
especially problematic in sparsely populated areas, such as rural areas where the number of volunteers is small, as well
as in virtual communities that have a small number of users.
5.9
|Extraction/learning of characteristics
DescriptionEach geographic feature has characteristics (i.e., shape, size, etc.) which can be used as a classification cri-terion. This method consists of extracting these characteristics from each type of geographic feature, learning the
information implicit in them, and, later, using the information to estimate the quality of CGI. For instance, distinct
char-acteristics can be extracted and learned from CGI with corresponding reference data and, later, used to estimate the
quality of CGI with no corresponding reference data.
ExampleAli and Schmid (2014) designed a classifier that learns the correct class of existing entities (i.e., parks and gar-dens) on the basis of their characteristics (e.g., size) and used it to predict the correct class of a new entity. Similarly,
Jilani and Corcoran (2014) extracted geometrical and topological properties of OSM street network data that are
rep-resentative of their semantic class, to infer the“road class”from the new data. Finally, Mohammadi and Malek (2015)
estimated the positional accuracy of OSM data without corresponding reference data by extracting patterns from
LimitationThis method does not depend on any external source when being employed. However, a large amount of data is required to properly learn the characteristics of geographic features. Moreover, it is context-dependent, since
geographic features in the same region might have more similar characteristics to those in different regions.
5.10
|Ranking/filtering by linguistic terms
DescriptionThe underlying principle of this method is the need to express the quality criteria linguistically. The linguis-tic terms are used to specify the desired values of the quality indicators and, together, these comprise a schema for
quality evaluation. Each CGI item is first evaluated on the basis of each criterion that is expressed linguistically and,
later, ranked in degrees of criteria satisfaction. Finally, CGI items are filtered by being subject to the constraints of the
application domain.
ExampleBordogna, Carrara, Criscuolo, Pepe, and Rampini (2014) employed this method to filter CGI items (i.e., pic-tures) for a citizen science project on glaciology.
Limitation One critical factor in this method is the schema for quality evaluation, since this is changed by each intended use of the CGI items. In other words, the schema depends on the application domain.
5.11
|Historical data analysis
DescriptionIn special cases, CGI comes with historical data. In OSM, for instance, a new version of an object is cre-ated whenever its geometry is changed. From the history of the data, it is possible to derive (intrinsic) indicators that
allow approximate statements to be made regarding data quality (Barron et al., 2014). An example of an indicator is
the number of contributors in a given area, since it has been demonstrated that this has an influence on the quality
(Haklay et al., 2010). Moreover, the historical data can be analyzed to identify patterns and make predictions of quality
elements.
ExampleKeßler and de Groot (2013) produced a set of indicators based on historical data (i.e., number of versions, contributors, confirmations, tag corrections, and rollbacks) to assess the quality of OSM data in Muenster, Germany.
Positive indicators (e.g., a high version number) were shown to correlate with high-quality CGI.
LimitationThis is an alternative method when no ground-truth data is available. However, a certain amount of histori-cal data must be available before it can be applied. Otherwise, the value of resulting statements may be limited.
6
|D I S C U S S I O N
This article presents a taxonomy of quality assessment methods for CGI. In contrast with existing works, as shown in
Section 3, this taxonomy summarizes what methods can be employed to assess the quality of CGI when authoritative
data is not available. In creating this taxonomy, we took into account different types of CGI source (i.e., social media,
crowd sensing, and collaborative mapping). As a result, the taxonomy can be useful for quality assessment in a larger
number of crowdsourcing-based platforms. Thus, this article can be regarded as an extension of previous work
(Bordo-gna et al., 2016; Wiggins et al., 2011), which only includes methods for assessing the quality of CGI in citizen science
projects (i.e., crowd sensing).
Some of the methods presented in the taxonomy have already been identified in previous studies (Bordogna et al.,
2016; Mirbabaie et al., 2016; Senaratne et al., 2017; Wiggins et al., 2011), such asredundancy of volunteers’
contribu-tion,scoring volunteered contribution,expert assessment,volunteer’s reputation,ranking/filtering by linguistic terms, and
present work is to identify a set of new methods to assess the quality of different types of CGI when there is no
authoritative data).
As well as in previous studies, we briefly described how each method works, classified them according to their
temporality and the approach employed, and presented practical examples. In addition, we classified them in
accord-ance with the type of reference dataset and the object under evaluation, and discussed their limitation(s), which may
prevent their employment. Moreover, we analyzed the CGI sources in which each method could be employed. With
the exception of four methods (i.e.,scoring volunteered contribution,spatiotemporal clustering,error detection/correct by
crowd, andhistorical data analysis), the majority of the methods can be employed with all CGI sources (i.e., social media,
crowd sensing, and collaborative mapping).
The methodscoring volunteered contribution(M3) can be employed for some crowd sensing platforms, since it is
possible to measure a score and attach it to the information. On the other hand, in some collaborative mapping and
social media platforms, it is not possible to directly measure a score but only to give indirect indicators of information
quality; this is owing to the idiosyncrasies of these platforms.
The methodspatiotemporal clustering(M6) can be employed for crowd sensing and social media platforms. In these
platforms, volunteers are able to share information about a specific event. Moreover, this set of information is usually
created in the same area and during a certain period of time. In contrast, in collaborative mapping platforms, the
volun-teers are not able to share information about an event, since these platforms usually collect data about less dynamic
geographic features, such as roads and buildings.
The methoderror detection/correct by crowd(M8) cannot be employed for social media platforms since no one is
allowed to correct the contributions of anyone else. However, it can be applied to some collaborative mapping and
crowd sensing platforms if permission is granted to volunteers to edit the information.
Finally, the method historical data analysis(M11) can only be employed in crowdsourcing platforms that keep
records of all the changes of a geographic feature, such as some collaborative mapping and crowd sensing platforms,
owing to its main characteristic (i.e., the use of historical data). Social media platforms, however, do not keep any
records, and this prevents them from using this method.
One advantage of our taxonomy is the fact that it is domain-independent (i.e., it can be employed in any field
of study). This is different from the work of Mirbabaie et al. (2016), which is focused exclusively on the
applica-tion domain of disaster management. Another advantage is the systematic process employed to develop our
tax-onomy. As a result of this, we were able to identify dimensions and characteristics that have not been identified
in previous studies (Bordogna et al., 2016; Senaratne et al., 2017), such as object, reference, and criteria
dimen-sions. Finally, our taxonomy provides a synthesis of the existing methods being employed to assess CGI quality,
which adds a systematization of research in this area and thus complements previous works which have focused
on summarizing existing studies in the literature related to quality assessment of CGI (Mirbabaie et al., 2016;
Senaratne et al., 2017; Wiggins et al., 2011).
An analysis of the methods presented in the taxonomy reveals opportunities for the development of new
indica-tors and other methods to assess the quality of CGI. Furthermore, it allows researchers working with a particular type
of CGI (e.g., social media) to learn about methods developed and employed in different types of CGI and application
domains that could be transferred to their research focus.
As pointed out in previous sections, quality assessment relies on the type and amount of data, the application
domain, and the reference dataset available. As a consequence, only a few methods can be employed in different CGI
sources and application domains. However, before their employment, there is a need to evaluate their appropriateness.
If the methods available are not suitable for a specific purpose, then future investigation should be carried out in order
to develop new method(s).
Unlike in existing works, our taxonomy was developed in a systematic way (i.e., the identification of existing
meth-ods through an SLR and development of the taxonomy). However, it still presents some limitations. SLR is a rigorous
and systematic methodology, but there are some threats to its validity. These have been minimized by selecting several
did not employ all synonyms in all electronic databases owing to their idiosyncrasies; in other words, we had to exclude
some synonyms in some search engines because we could not identify relevant studies with them. The limited number
of selected studies might be seen as a consequence. In addition, the number of studies included might have been
affected by language restrictions, as only studies written in English and Portuguese were taken into account. Thus, it is
possible that some relevant studies were not included in this work.
7
|C O N C L U S I O N S
In this article, we propose a taxonomy of methods for assessing the quality of CGI in the absence of authoritative data.
This first involved looking at the state-of-the-art by conducting a systematic literature review, and several works were
found that employ quality assessment methods for CGI. After this, we investigated each method to determine its
char-acteristics and, thus, be in a position to create our taxonomy. Following this, we described each method, discussing its
limitation(s) and potential application.
Our taxonomy is aimed at assisting quality assessment in new and existing crowdsourcing-based platforms.
Assessment is an important stage in all CGI, since the information comes from unknown sources and is of unknown
quality. As well as this, the scientific community can also benefit from the results of our taxonomy, because it provides
an overview of existing methods, but also offers scope for future research projects.
A C K N O W L E D G M E N T S
The authors would like to acknowledge funding provided by the Engineering and Physical Sciences Research
Council (EPSRC) through the Global Challenges Research Fund. Lívia Castro Degrossi is grateful for the financial
support from Coordenaç~ao de Aperfeiçoamento de Pessoal de Nível Superior (Grant/Award No. 88887.091744/ 2014-01) and Conselho Nacional de Desenvolvimento Científico e Tecnologico (Grant/Award No. 201626/2015-2). Jo~ao Porto de Albuquerque is grateful for the financial support from Coordenaç~ao de Aperfeiçoamento de Pessoal de Nível Superior (Grant/Award No. 88887.091744/2014-01) and Universität Heidelberg. Roberto
dos Santos Rocha is grateful for the financial support from the Marie Curie Actions/Initial Training Networks
(Grant/Award No. 317382) and Federal University of Bahia. All data created during this research are openly
avail-able from the University of Warwick data archive at http://wrap.warwick.ac.uk/99434.
OR C I D
Lívia Castro Degrossi http://orcid.org/0000-0001-6897-1186
Jo~ao Porto de Albuquerque http://orcid.org/0000-0002-3160-3168
Roberto dos Santos Rocha https://orcid.org/0000-0003-2013-2134
R E F E R E N C E S
Albuquerque, J. P., Herfort, B., Brenning, A., & Zipf, A. (2015). A geographic approach for combining social media and authoritative data towards identifying useful information for disaster management.International Journal of Geographical
Information Science,29(4), 667–689.
Albuquerque, J. P., Herfort, B., & Eckle, M. (2016). The tasks of the crowd: A typology of tasks in geographic information crowdsourcing and a case study in humanitarian mapping.Remote Sensing,8, 1–22.
Albuquerque, J. P., Herfort, B., Eckle, M., & Zipf, A. (2016). Crowdsourcing geographic information for disaster manage-ment and improving urban resilience: An overview of recent developmanage-ments and lessons learned. In C. Capineri, M. Haklay, H. Huang, V. Antoniou, J. Kettunen, F. Ostermann, & R. Purves (Eds.),European handbook of crowdsourced
geographic information(pp. 309–321). London, UK: Ubiquity Press.
Ali, A. L., & Schmid, F. (2014). Data quality assurance for volunteered geographic information. In M. Duckham, E. Pebesma, K. Stewart, & A. U. Frank (Eds.), Geographic Information Science: Proceedings of the Eighth International
Conference, GIScience 2014, Vienna, Austria, September 24–26, 2014 (pp. 126–141). Cham, Switzerland: Springer,
Anhorn, J., Herfort, B., & Albuquerque, J. P. (2016). Crowdsourced validation and updating of dynamic features in Open-StreetMap: An analysis of shelter mapping after the 2015 Nepal earthquake. InProceedings of the 13th International
Conference on Information Systems for Crisis Response and Management. Rio de Janeiro, Brazil: ISCRAM.
Antoniou, V., & Skopeliti, A. (2015). Measures and indicators of VGI quality: An overview.ISPRS Annals of
Photogramme-try, Remote Sensing & Spatial Information Sciences,23(W5), 345–351.
Ballatore, A., & Zipf, A. (2015). A conceptual quality framework for volunteered geographic information. In S. I. Fabrikant, M. Raubal, M. Bertolotto, C. Davies, S. Freundschuh, & S. Bell (Eds.),Spatial Information Theory: Proceedings of the
12th International Conference, COSIT 2015, Santa Fe, NM, USA, October 12–16, 2015(pp. 89–107). Cham, Switzerland:
Springer, Lecture Notes in Computer Science: Vol. 9368.
Barron, C., Neis, P., & Zipf, A. (2014). A comprehensive framework for intrinsic OpenStreetMap quality analysis.
Transac-tions in GIS,18(6), 877–895.
Biolchini, J., Mian, P. G., Candida, A., & Natali, C. (2005).Systematic review in software engineering. Retrieved from http:// www.cos.ufrj.br/uploadfile/es67905.pdf
Bishr, M., & Janowicz, K. (2010). Can we trust information? The case of volunteered geographic information. In
Proceed-ings of the Towards Digital Earth: Search, Discover and Share Geospatial Data Workshop. Berlin, Germany.
Bishr, M., & Kuhn, W. (2013). Trust and reputation models for quality assessment of human sensor observations. In T. Tenbrink, J. Stell, A. Galton, & Z. Wood (Eds.),Spatial information theory: Proceedings of the 11th International Conference, COSIT 2013,
Scarborough, UK, September 2–6, 2013(pp. 53–73). Cham, Switzerland: Springer, Lecture Notes in Computer Science: Vol.
8116.
Bodnar, T., Tucker, C., Hopkinson, K., & Bilen, S. G. (2014). Increasing the veracity of event detection on social media net-works through user trust modeling. InProceedings of the IEEE International Conference on Big Data. Washington, DC: IEEE.
Bordogna, G., Carrara, P., Criscuolo, L., Pepe, M., & Rampini, A. (2014). A linguistic decision making approach to assess the quality of volunteer geographic information for citizen science.Information Sciences,258, 312–327.
Bordogna, G., Carrara, P., Criscuolo, L., Pepe, M., & Rampini, A. (2016). On predicting and improving the quality of volun-teer geographic information projects.International Journal of Digital Earth,9, 134–155.
Brereton, P., Kitchenham, B. A., Budgen, D., Turner, M., & Khalil, M. (2007). Lessons from applying the systematic litera-ture review process within the software engineering domain.Journal of Systems and Software,80(4), 571–583.
Comber, A., See, L., Fritz, S., Velde, M., Van Der, Perger, C., & Foody, G. (2013). Using control data to determine the reli-ability of volunteered geographic information about land cover.International Journal of Applied Earth Observation &
Geoinformation,23, 37–48.
Cui, Y. (2013). A systematic approach to evaluate and validate the spatial accuracy of farmers market locations using multi-geocoding services.Applied Geography,41, 87–95.
Degrossi, L. C., Albuquerque, J. P., Fava, M. C., & Mendiondo, E. M. (2014). Flood Citizen Observatory: A crowdsourcing-based approach for flood risk management in Brazil. InProceedings of the 26th International Conference on Software
Engineering and Knowledge Engineering(pp. 570–575). Vancouver, Canada: KSI.
Degrossi, L. C., Albuquerque, J. P., Rocha, R. S., & Zipf, A. (2017). A framework of quality assessment methods for crowd-sourced geographic information: A systematic literature review. InProceedings of the 14th International Conference on
Information Systems for Crisis Response and Management. Albi, France: ISCRAM.
Fan, H., Zipf, A., Fu, Q., & Neis, P. (2014). Quality assessment for building footprints data on OpenStreetMap.
Interna-tional Journal of Geographical Information Science,28(4), 700–719.
Flanagin, A. J., & Metzger, M. J. (2008). The credibility of volunteered geographic information.GeoJournal,72(3&4), 137–148.
Foody, G. M. (2014). Rating crowdsourced annotations: Evaluating contributions of variable quality and completeness.
International Journal of Digital Earth,7(8), 650–670.
Foody, G. M., See, L., Fritz, S., Van der Velde, M., Perger, C., Schill, C., & Boyd, D. S. (2013). Assessing the accuracy of volunteered geographic information arising from multiple contributors to an internet based collaborative project.
Transactions in GIS,17(6), 847–860.
Girres, J. F., & Touya, G. (2010). Quality assessment of the French OpenStreetMap dataset.Transactions in GIS,14(4), 435–459.
Goodchild, M. F. (2007). Citizens as sensors: The world of volunteered geography.GeoJournal,69(4), 211–221.
Goodchild, M. F., & Li, L. (2012). Assuring the quality of volunteered geographic information.Spatial Statistics,1, 110–120.
Harvey, F. (2013). To volunteer or to contribute locational information? Towards truth in labeling for crowdsourced geo-graphic information. In D. Sui, S. Elwood, & M. F. Goodchild (Eds.),Crowdsourcing geographic knowledge: Volunteered
geographic information (VGI) in theory and practice(pp. 31–42). Dordrecht, the Netherlands: Springer.
International Organization for Standardization. (2013).Geographic information–Data quality (ISO 19157). Retrieved from https://www.iso.org/standard/32575.html
Jilani, M., & Corcoran, P. (2014). Automated highway tag assessment of OpenStreetMap road networks. InProceedings of
the 22nd ACM SIGSPATIAL International Conference on Advances in Geographic Information Systems. Dallas, TX: ACM.
Kaplan, A. M., & Haenlein, M. (2010). Users of the world, unite! The challenges and opportunities of social media.Business
Horizons,53(1), 59–68.
Karam, R., & Melchiori, M. (2013). A crowdsourcing-based framework for improving geo-spatial open data. InProceedings
of the 2013 IEEE International Conference on Systems, Man, and Cybernetics(pp. 468–473). Manchester, UK: IEEE.
Keßler, C., & de Groot, R. T. A. (2013). Trust as a proxy measure for the quality of volunteered geographic information in the case of OpenStreetMap. In C. J. Vandenbroucke & D. Bucher (Eds.),Geographic information science at the heart of
Europe(pp. 21–37). Cham, Switzerland: Springer, Lecture Notes in Geoinformation and Cartography.
Kitchenham, B. A., & Charters, S. (2007). Guidelines for performing systematic literature reviews in software engineering. Retrieved from https://www.elsevier.com/__data/promis_misc/525444systematicreviewsguide.pdf
Klonner, C., Eckle, M., Uson, T., & Hofle, B. (2017). Quality improvement of remotely volunteered geographic information€ via country-specific mapping instructions. InProceedings of the 14th International Conference on Information Systems
for Crisis Response and Management. Albi, France: ISCRAM.
Lertnattee, V., Chomya, S., & Sornlertlamvanich, V. (2010). Reliable improvement for collective intelligence on Thai herbal information. In N. T. Nguyen, R. Katarzyniak, & S. M. Chen (Eds.),Advances in intelligent information and database sys-tems(pp. 99–110). Berlin, Germany: Springer, Studies in Computational Intelligence: Vol. 283.
Longueville, B., Luraschi, G., Smits, P., Peedell, S., & Groeve, T. (2010). Citizens as sensors for natural hazards: A VGI inte-gration workflow.Geomatica,64, 41–59.
Mirbabaie, M., Stieglitz, S., & Volkeri, S. (2016). Volunteered geographic information and its implications for disaster man-agement. InProceedings of the 49th Hawaii International Conference on System Sciences. Koloa, HI: IEEE.
Mohammadi, N., & Malek, M. (2015). Artificial intelligence-based solution to estimate the spatial accuracy of volunteered geographic data.Journal of Spatial Science,60(1), 119–135.
Mooney, P., Corcoran, P., & Winstanley, A. C. (2010). Towards quality metrics for OpenStreetMap. InProceedings of the
18th SIGSPATIAL International Conference on Advances in Geographic Information Systems. San Jose, CA: ACM.
Mooney, P., & Minghini, M. (2017). A review of OpenStreetMap data. In G. Foody, L. See, S. Fritz, P. Mooney, A.-M. Olteanu-Raimond, C. C. Fonte, & V. Antoniou (Eds.),Mapping and the citizen sensor(pp. 37–59). London, UK: Ubiquity Press.
Mulrow, C. D. (1994). Rationale for systematic reviews.BMJ (Clinical Research Ed.),309(6954), 597–599.
Mummidi, L., & Krumm, J. (2008). Discovering points of interest from users’ map annotations.GeoJournal, 72(3&4), 215–227.
Nickerson, R. C., Varshney, U., & Muntermann, J. (2013). A method for taxonomy development and its application in information systems.European Journal of Information Systems,22(3), 336–359.
Raymond, E. S. (1999).The cathedral and the bazaar. Sebastopol, CA: O’Reilly Media.
Resch, B. (2013).People as sensors and collective sensing-contextual observations complementing geo-sensor network
meas-urements. Berlin, Germany: Springer.
Salk, C. F., Sturn, T., See, L., & Fritz, S. (2017). Limitations of majority agreement in crowdsourced image interpretation.
Transactions in GIS,21(2), 207–223.
Salk, C. F., Sturn, T., See, L., Fritz, S., & Perger, C. (2016). Assessing quality of volunteer crowdsourcing contributions: Les-sons from the Cropland Capture game.International Journal of Digital Earth,9(4), 410–426.
See, L., Comber, A., Salk, C., Fritz, S., van der Velde, M., Perger, C., & Obersteiner, M. (2013). Comparing the quality of crowdsourced data contributed by expert and non-experts.PLoS One,8(7), 1–11.
See, L., Mooney, P., Foody, G., Bastin, L., Comber, A., Estima, J., & Rutzinger, M. (2016). Crowdsourcing, citizen science or volunteered geographic information? The current state of crowdsourced geographic information.ISPRS International
Journal of Geo-Information,5(5), 1–23.
Senaratne, H., Broring, A., & Schreck, T. (2013). Using reverse viewshed analysis to assess the location correctness of vis-€ ually generated VGI.Transactions in GIS,17(3), 369–386.
Stefanidis, A., Crooks, A., & Radzikowski, J. (2013). Harvesting ambient geospatial information from social media feeds.
GeoJournal,78(2), 319–338.
Tobler, W. R. (1970). A computer movie simulating urban growth in the Detroit region.Economic Geography,46, 234–240.
Wiggins, A., Newman, G., Stevenson, R. D., & Crowston, K. (2011). Mechanisms for data quality and validation in citizen science. InProceedings of the Seventh IEEE International Conference on e-Science Workshops. Stockholm, Sweden: IEEE.
Zielstra, D., & Hochmair, H. H. (2013). Positional accuracy analysis of Flickr and Panoramio images for selected world regions.Journal of Spatial Science,58(2), 251–273.
S U P P O R T I N G I N F O R M A T I O N
Additional Supporting Information may be found online in the supporting information tab for this article.
How to cite this article:Degrossi LC, Albuquerque JP, Rocha RS, Zipf A. A taxonomy of quality assessment
methods for volunteered and crowdsourced geographic information.Transactions in GIS. 2018;22:542–560.