Original citation:
Mostaed, Ali, Balakrishnan, Geetha, Lees, Martin R., Yasui, Yukio, Chang, Lieh-Jeng and Beanland, R.. (2017) Atomic structure study of the pyrochlore Yb2Ti2O7 and its relationship with low-temperature magnetic order. Physical Review B (Condensed Matter and Materials Physics), 95 . 094431.
Permanent WRAP URL:
http://wrap.warwick.ac.uk/86724
Copyright and reuse:
The Warwick Research Archive Portal (WRAP) makes this work by researchers of the University of Warwick available open access under the following conditions. Copyright © and all moral rights to the version of the paper presented here belong to the individual author(s) and/or other copyright owners. To the extent reasonable and practicable the material made available in WRAP has been checked for eligibility before being made available.
Copies of full items can be used for personal research or study, educational, or not-for-profit purposes without prior permission or charge. Provided that the authors, title and full bibliographic details are credited, a hyperlink and/or URL is given for the original metadata page and the content is not changed in any way.
Publisher statement:
© 2017 American Physical Society
Published version: https://doi.org/10.1103/PhysRevB.95.094431
A note on versions:
The version presented here may differ from the published version or, version of record, if you wish to cite this item you are advised to consult the publisher’s version. Please see the ‘permanent WRAP url’ above for details on accessing the published version and note that access may require a subscription.
Atomic structure study of the pyrochlore Yb
2Ti
2O
7and its relationship
with low-temperature magnetic order
Ali Mostaed1,*, Geetha Balakrishnan1, Martin Richard Lees1, Yukio Yasui2, Lieh-Jeng Chang3 and Richard Beanland1
1Department of Physics, University of Warwick, Gibbet Hill Road, CV4 7AL, Coventry, UK 2Department of Physics, Meiji University, Kawasaki 214-8571 Japan
3Department of Physics, National Cheng Kung University, Tainan 70101, Taiwan
Abstract
There has been great interest in the magnetic behavior of pyrochlore oxides with the general formula
A2B2O7, in which rare-earth (A), and transition metal (B) cations are ordered on separate
interpenetrating lattices of corner-sharing tetrahedra. Such materials exhibit behaviors including quantum spin-ice, (quantum) spin-liquid, and ordered magnetic ground states. Yb2Ti2O7 lies on the boundary between a number of competing magnetic ground states. Features in the low-temperature specific heat capacity that vary in sharpness and temperature from sample to sample suggest that in some cases the magnetic moments order, while in others the moments remain dynamic down to temperatures as low as ~16 mK. In this work, three different Yb2Ti2O7 samples, all grown by the optical floating zone technique but exhibiting quite different heat capacity behavior, are studied by aberration-corrected scanning transmission microscopy (STEM). Atomic-scale energy-dispersive X-ray analysis shows that a crystal with no specific heat anomaly has substitution of Yb atoms on Ti sites (‘stuffing’). We show that the detailed intensity distribution around the visible atomic columns in annular dark field STEM images is sensitive to the presence of nearby atoms of low atomic number (in this case oxygen) and find significant differences between the samples that correlates both with their magnetic behavior and measurements of Ti oxidation state using electron energy loss spectroscopy. These measurements support the view that the magnetic ground state of Yb2Ti2O7 is extremely sensitive to disorder.
Keywords: pyrochlore; magnetic frustration; Yb2Ti2O7; annular dark field STEM; atomic resolution EDX
* Corresponding author.
I. INTRODUCTION
Pyrochlore oxides with general formula A2B2O7, in which A is a rare-earth ion and B is a transition metal, exhibit a variety of interesting magnetic properties [1]. The A and B cations lie on distinct but interpenetrating lattices of corner-sharing tetrahedra. Such a lattice is incompatible with a simple organisation of magnetic moments and leads to geometric frustration [1]. By analogy with the large ground-state entropy of crystalline H2O [2], which has an oxygen lattice of corner-sharing tetrahedra, the ground states of many magnetic A2B2O7 materials have been proposed to be a spin-ice [1]. In a spin-ice, each tetrahedron has two spins pointing inwards and two outwards (so-called ice rules [1,3]). Nevertheless, other unusual behaviors have been observed in A2B2O7 pyrochlores, including spin glass [4-6], and spin liquid [4] states, as well as magnetic configurations modified by quantum fluctuations [1,7-10]. The qualities of any given A2B2O7 compound are principally dictated by the elements A and B, but can be strongly altered by structural defects, particularly ‘stuffing’ of magnetic A3+ ions onto nonmagnetic B4+ sites and oxygen, A-site or B-site vacancies [1,7-10].
Here, we examine Yb2Ti2O7. The picture for this material is complicated by reports of different results for polycrystalline and single crystal samples, and for different samples with nominally identical form, stoichiometry, and structure [11-13]. An early study found a peak in the temperature dependence of the heat capacity of Yb2Ti2O7 at 214 mK [14], consistent with later neutron scattering, muon spectroscopy, and magnetization studies that associate the heat capacity anomaly with a first-order transition to ferromagnetic long-range magnetic order [13,15-18] with a collinear or nearly collinear magnetic structure [15,16], an ice-like splayed ferromagnetic structure [19] or all-in-all-out splayed ferromagnetic structure [20]. Other works have proposed that this system is a quantum spin-ice [11,12,21,22] or quantum spin liquid [23,24], or adopts a ground state with short-range correlations where the magnetic moments continue to fluctuate down to temperatures as low as 16 mK [25-27].
by stuffing of Yb onto 2.3% of Ti sites, rather than Ti vacancies or anti-stuffing [11]. However, Baroudi and co-workers in a synchrotron X-ray diffraction study proposed that Yb, being the smallest of the rare earth atoms, could swap with Ti, producing up to 2% anti-site defects in their Yb2Ti2O7 powders [31].
We employ aberration-corrected scanning transmission electron microscopy (STEM) to investigate three different samples that have quite different low-temperature heat capacity behavior, in conjunction with atomically-resolved energy-dispersive X-ray spectroscopy (EDX) and electron energy loss spectroscopy (EELS). While diffraction studies, such as those mentioned above, measure average structure, electron microscopy at atomic resolution offers the opportunity to directly observe defects such as stuffing and atom swapping between cation sites as well as providing average measurements from regions several nm in size. We find significant differences between the samples that correlate with their magnetic behavior.
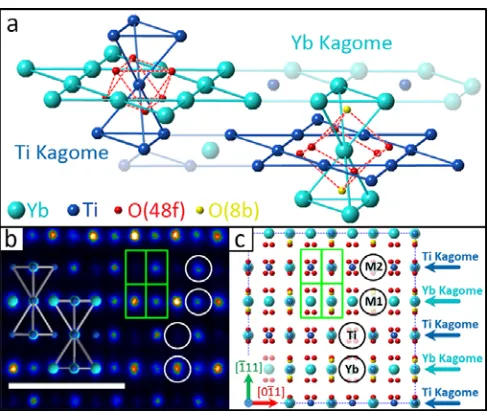
In order to interpret atomic resolution images of Yb2Ti2O7 the pyrochlore structure ( 3 ) [32] must be considered. One way to understand the structure of Yb2Ti2O7 is examination of 1 1 1 planes as shown in Fig. 1(a). On these planes, sheets of metal atoms have a hexagonal Kagome pattern and alternate between Yb3+ (light blue) and Ti4+ (dark blue) in Fig. 1. In each Yb layer, Ti atoms sit at the centre of an Yb hexagon (top, Fig. 1(a); most oxygen atoms have been omitted for clarity). These Ti atoms also lie at the vertex of a pair of opposing Ti tetrahedra that link to the Ti Kagome layers above and below. A similar pattern is found for Yb atoms in the Ti Kagome layer (bottom, Fig. 1(a)). Each metal atom is surrounded by an octahedron of oxygen ions that either lie on a Wyckoff f-site (red) or b -site (yellow). Note that all the cations of the same type are symmetrically identical, and this pattern is found on all of the symmetrically equivalent 1 1 1 layers. Crystallographic parameters for a perfect Yb2Ti2O7 crystal [33] are listed in Table SI in Supplemental Material [34].
FIG. 1. (a) The pyrochlore structure of Yb2Ti2O7 (see text for details). (b) [211] annular dark field STEM
image of Yb2Ti2O7 with Yb and Ti tetrahedra overlaid (scale bar is 1 nm). Four different types of atom
columns are visible, marked by circles. The Yb columns are the brightest, followed by mixed columns M1 and
M2, while the Ti columns are the faintest. (c) Corresponding projection of the crystal structure showing the Kagome layers and the four different types of atom column. Voronoi cells, used for measurement of intensities in the image, are illustrated in green in (b) and (c).
Our interest lies in the purity of the Yb and Ti sublattices – and the effect on adjacent oxygen atoms – that may result from the presence of an Yb atom on a Ti site, or vice versa. We thus consider a simple model in which an atomic column, which is nominally comprised completely of atoms of type X in perfect material, has some atoms replaced by others of type Y. Now, moving atoms between different cation sublattices must involve changes in oxidation state and/or anion populations in order to maintain charge balance; rearrangements of oxygen atoms or oxygen vacancies may be necessary. We will return to these points later, but begin by assuming that there is no correlation between the different substitution sites, i.e. that there is no clustering or repulsion between substituted sites and there are no vacancies, interstitials or impurity atoms. In such a simple case, with a probability for an atom of type X to be replaced by one of type Y, the probability of finding a column of atoms which contains
type Y atoms is given by the binomial distribution, i.e.
!
! ! 1 . (1)
of 45 nm, replacement of 1% gives more than 50% of atomic columns that contain at least one foreign atom (yellow curve). Even if only 0.4% of atoms are replaced by a different type, more than 20% of atomic columns will have one foreign atom (red curve). Conversely, unaffected columns only form a small fraction of the image if significant amounts of stuffing occur; only 10% have no foreign atom at a stuffing of 3% (violet curve). Importantly, at stuffing fractions of a few percent, adjacent columns with widely differing substitutions should be quite common.
FIG. 2.The fraction of columns with 73 atoms that have between zero and five foreign atoms predicted by (Eq. 1), for different amounts of average atom swapping (0.4% to 3%). This is equivalent to a [211] Yb2Ti2O7
specimen with thickness 45nm.
columns may not be directly interpretable in terms of composition, e.g. due to static atomic displacements [48,49] that may be a result of stuffing.
Here we show that O vacancies, along with stuffing of Yb atoms onto the Ti sites, are responsible for the breakdown of the long-range magnetic ordering in Yb2Ti2O7 pyrochlore, resulting in a material that exhibits only short-range order or in which magnetic ordering is absent down to the lowest temperatures measured.
II. METHODS
[image:7.612.188.417.506.693.2]We investigated three Yb2Ti2O7 single crystals prepared by the floating zone method with quite different low-temperature specific heat characteristics. Stoichiometric quantities of Yb2O3 and TiO2 powder were mixed, pressed into rods and then sintered at 1150 °C (Sample 1 and Sample 3) or 1350 °C (Sample 2) for 24 hours. Using these rods, single crystals were grown in air at a rate of 1.5 mm/h (Sample 1 and Sample 3) or 2 mm/h (Sample 2). The crystals had a typical diameter of ~6 mm and a length of 20 to 30 mm. The samples were used in the previous published works [15,16,18]. As shown in Fig. 3, Sample 1 exhibits a sharp transition at ~200 mK, consistent with the onset of long-range magnetic order, typical of stoichiometric powder samples although at a reduced temperature. Sample 2 shows two relatively broad anomalies at ~200 mK and 280 mK. This type of behavior could be explained by short-range magnetic ordering, with the magnetic correlation length limited by defects [11]. Finally, Sample 3 exhibits no clear specific heat anomaly, consistent with a disordered magnetic state, and is thus expected to have significant stuffing of Yb3+ onto the Ti4+ sites [11].
In order to avoid any issues associated with sample inhomogeneity and to able to compare the microscopy and heat capacity results directly, the TEM, specimens were taken from the same thin sections of the crystal used for the heat capacity measurements. Then, the TEM specimens were prepared using standard routes, i.e. mechanical grinding and polishing followed by ion milling to electron transparency using Ar+ at 6 keV. Surface damage was minimised by a final low energy milling step at 500 eV. Images were obtained with a doubly-corrected JEOL ARM200F microscope at 200 kV. Defect-free, flat and uniform regions of interest were selected with thicknesses characterised using low-loss EELS [50], chosen to be ⁄ ≈ 0.76, i.e. ~45 nm. In order to obtain data with a good signal to noise ratio, unaffected by specimen drift, up to sixty images were collected sequentially, all with a short time of 10 µs/pixel. The resulting set of images was aligned using normalized cross-correlation and summed to produce high quality, low noise data.
At small scattering angles, i.e. when the inner angle of the ADF detector is only a little larger than the probe convergence angle α, coherent diffraction effects can produce strain contrast that is very sensitive to crystal orientation that compromises the ability to relate intensities to atomic number [38]. Here, therefore, for images intended to be sensitive to composition we use an ADF detector inner angle at least 4.6 times the probe convergence angle α, giving a scattered intensity proportional to a small power of the atomic number, . to [51,52]. For images that show greater sensitivity to the
configurations of oxygen atoms we use an ADF detector inner angle of only ~2.4α. Data were normalized to the incident beam intensity using calibrated brightness/contrast levels, a map of the ADF detector response and an image of the diffraction pattern falling on the detector, following an approach similar to that of LeBeau and co-workers [53]. EDX measurements were obtained with a windowless Oxford Instruments X-max 100 silicon drift X-ray detector. EEL spectra were obtained with a Gatan Quantum EELS system operating in dual EELS mode, allowing correction of zero-loss offsets and removal of multiple scattering from high energy core-loss edges by Fourier-log deconvolution calculated from the low loss spectrum. Image simulations were performed with QSTEM [54] and STEMsim [55] multislice to compare with experimental data.
III. RESULTS
A. Annular dark field STEM intensities
supplementary information). The four sublattices are readily distinguished in the false color image Fig. 4(d) and the intensity histogram Fig. 4(e). The higher mean intensity of M1 in comparison with M2 is caused by the presence of four oxygen columns in the Voronoi cell of every M1 column in comparison with two for M2 (Fig. 1(c)). Thus, even though oxygen atoms cannot be resolved in these ADF-STEM images it is clear that their effect can be seen in quantitative intensity measurements.
One might hope that the range of intensities in the histograms for each type of atom might be governed in some way by Eq. (1). However, if the four sublattice intensities are each normalized separately to a range between zero and one (Fig. 4(f)) it becomes apparent that there is a systematic variation across the image, presumably due to a small variation in specimen thickness. The width of the intensity histograms in Fig. 4(e) is thus mainly caused by this thickness variation rather than atomic substitutions. Similar variations are present for Samples 2 and 3 (see supplementary Fig. S1). These thickness variations and/or damage/contamination of the specimen surface are sufficient to mask statistical measurements of stuffing, or anti-stuffing, from the ADF intensities of atomic columns, i.e. changes in the number of atoms per column easily produce differences that are equal to or larger than the effect of a few atomic substitutions.
The difference in M1 and M2 column intensities indicates a sensitivity of ADF data to nearby oxygen atoms. We therefore investigated mean radial intensity as a function of distance from the centre of the visible atom columns, averaged over all equivalent columns in the images of Figs. 4(a-c). These mean radial intensity profiles are shown in Figs. 4(g-i), where the centre of the atom column is at the origin and the mean radial intensity decays following a quasi-Gaussian profile. In sample 1, the M2
columns have a higher peak intensity (Fig. 4(g)), consistent with oxygen atom columns close to their centres (49 pm in the nominal structure). The radial intensity of the M1 columns decays more slowly, consistent with more oxygen atom columns at larger distances (72 pm in the nominal structure). The intensity of M1 columns exceeds that of M2 columns at a radius of ~65 pm (see also Fig. S2(a) and Fig. S3 in Supplemental Material [56]). The same trend is observed in multislice simulations of the nominal Yb2Ti2O7 structure (Fig. S2(d) in Supplemental Material [56]), with the intensity at M2 columns becoming smaller than that of M1 columns at a certain radius depending the sample thickness.
Interestingly, the higher peak intensity of M2 columns shown in Fig. 4(g) is only found in Sample 1; for Samples 2 and 3, as illustrated in Figs. 4(h) and 4(i), the radial intensity of M2 never exceeds that of
M1 (see also Figs. S2 in Supplemental Material [56]). This effect could be caused by fewer oxygen atoms in the Wyckoff f-site or their movement away from M2 columns, which would reduce the M2
intensity at small radii, and/or movements of f-site and b-site oxygen atoms closer to M1 columns, which would increase their intensity at small radii.
B. Atomic resolution EDX
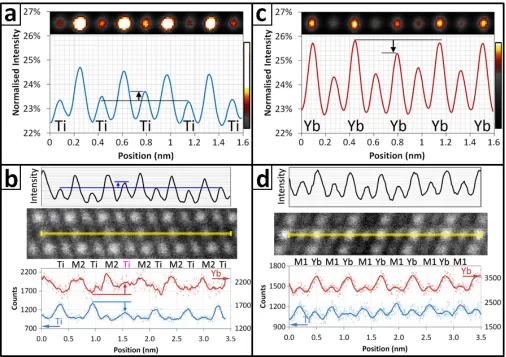
Anomalously bright Ti columns, consistent with stuffing of Yb onto Ti sites were observed (Fig. 5(a)) as well as anomalously dark Yb columns, consistent with anti-stuffing of Ti onto Yb sites (Fig. 5(c)). These were examined with atomic resolution EDX. Fig. 5(b) shows an EDX line scan across an anomalously bright Ti column, made using Ti Kα (4.51 keV) and Yb Lα (7.41 keV) X-rays. There is an obvious drop in Ti signal, and an increase in the Yb signal, for the brighter column in comparison with the others, particularly those to the left. The correlation between bright atom column contrast and a lower Ti / higher Yb signal was observed several times (see Fig. S4 in Supplemental Material [57]) and is direct evidence for stuffing in this sample. Figure 5(d) shows a line of Yb-M1 columns, in which a small Ti signal can be seen at each Yb column as well as the expected signal at the M1 columns. While this may indicate anti-stuffing of Ti onto Yb sites, it is also possible that a small amount of specimen drift (0.2 nm) during acquisition introduced some signal from the adjacent Ti-M2 row of atoms.
C. EELS
Analysis of Yb2Ti2O7 at atomic resolution using EELS is possible using the Ti-L3,2 edge at ~450 eV and the Yb-N4,5 edge at 185 eV, although spatial resolution is limited for the latter due to delocalization effects [50], limiting the analysis to the [110] zone axis. Nevertheless, electron energy loss near-edge structure (ELNES) spectra can be used to obtain information on Ti bonding configurations [58-60]. Metallic Ti shows two white lines L3 and L2 at 456 eV and 462 eV, due to electron transitions from 2p3/2 and 2p1/2 subshells to unoccupied 3d states respectively. In titanium oxides, the number of peaks in the Ti-L3,2 ELNES spectrum depends on valence state, coordination and site symmetry of the Ti atoms [59]. In materials with a Ti oxidation state of +4, like Yb2Ti2O7, titanium core-holes created by excitation of 2p core electrons can be poorly screened since there is no electron in the Ti4+ conduction band. Consequently, both L3 and L2 edges are shifted to higher energy losses than for metallic Ti [59]. Octahedral coordination of Ti atoms with oxygen splits the degenerate unoccupied 3d states into a lower energy 2t2g molecular energy level and a higher 3eg level [61]. Hence, in Yb2Ti2O7 the Ti L3 and
L2 edges both consist of two white lines, αand β for L3 and γ and δfor L2. In fact, for each edge the first (α, γ) and second (β, δ) peak are due to transitions from the 2p state to the 2t2g (π*) and 3eg (σ*) oxide
levels, respectively.
A decrease in Ti valence, for example due to oxygen vacancies, has two effects on Ti-L3,2 ELNES: a) a systematic shift to lower energies of ~2 eV per valence state [59]; and b) the intensity ratios ⁄ , ⁄ and ⁄ all trend to larger values [58,59]. These changes are very sensitive indicators of change
in Ti valence.
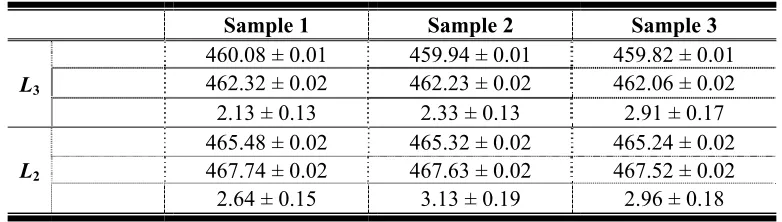
The experimental spectra from the three samples are shown in Fig. 6(a). Peak energies, extracted by fitting the data to four Lorentzian curves (Fig. 6(b)), as well as intensity ratios are listed in Table I. All of these indicators show that the Ti valence drops from Sample 1 to Sample 2 and still further for Sample 3.
FIG. 6. (a) Experimental EEL TiL3,2 spectra of the three samples (t/λ = 0.30). (b) Lorentzian curves fitted to
[image:13.612.70.547.70.254.2]the experimental EEL spectra shown in (a).
TABLE I. Ti ELNES energies and intensity ratios for the three Yb2Ti2O7 samples.
Sample 1 Sample 2 Sample 3
L3
460.08 ± 0.01 459.94 ± 0.01 459.82 ± 0.01
462.32 ± 0.02 462.23 ± 0.02 462.06 ± 0.02
2.13 ± 0.13 2.33 ± 0.13 2.91 ± 0.17
L2
465.48 ± 0.02 465.32 ± 0.02 465.24 ± 0.02
467.74 ± 0.02 467.63 ± 0.02 467.52 ± 0.02
2.64 ± 0.15 3.13 ± 0.19 2.96 ± 0.18
IV. DISCUSSION
[image:13.612.110.501.325.436.2]The EELS data (Fig. 6) thus show a correlation between magnetic properties and oxidation state. In order to link this to the differences in intensity profiles we observe in ADF-STEM data (Fig. 4), and the effects of stuffing, it is necessary to consider the position of the oxygen atoms in the crystal structure. One way to do this is to divide the crystal into regular tetrahedral and octahedral volumes (Fig. 7). Each cation sits at the vertex of six edge-sharing tetrahedra and six corner-sharing octahedra. These are shown for an Yb atom in Figs. 7(a) and 7(b); the octahedra are empty, while each tetrahedron contains an oxygen atom. There are two types of tetrahedron around an Yb atom, shown in colored shading in Fig. 7(b); two tetrahedra are comprised of four Yb3+ ions, 4Yb, with a Wyckoff b-site O2- atom at their centres (green), while the remaining six (purple) have two Yb and two Ti atoms, 2Ti2Yb, and a Wyckoff f-site O2- atom, displaced well off-centre, close to the mid-point of the edge connecting the Ti atoms. A similar structure surrounds the Ti atoms, except in this case there are six 2Ti2Yb tetrahedra and two 4Ti tetrahedra, comprised of four Ti4+ ions with no oxygen atom inside.
FIG. 7.Cation tetrahedra in Yb2Ti2O7. (a) Ball and stick model showing the eight cation tetrahedra that have a
common vertex at an Yb atom. (b) The same tetrahedra, color-coded as 2Ti2Yb (purple) and 4Yb (green). (c) Ball and stick model showing the eight cation tetrahedra that have a common vertex at a Ti atom. (d) The effect of stuffing an Yb3+ atom onto the Ti4+ site. The six 2Ti2Yb tetrahedra (purple) become 1Ti3Yb and the two 4Ti
(orange) become 3Ti1Yb. Stuffing produces an oxygen vacancy in one of the surrounding 1Ti3Yb tetrahedra (highlighted in red) and the conversion of an adjacent Ti atom from 4+ to 3+. The network of magnetic 4Yb
[image:14.612.54.559.320.534.2]Stuffing will change all eight tetrahedra that surround the affected site. A possible structure that results from replacing a Ti4+ atom with Yb3+ is shown in Fig. 7(d). The six 2Ti2Yb tetrahedra become
1Ti3Yb tetrahedra (purple) and the two 4Ti tetrahedra change to 3Ti1Yb. No other ytterbium titanates have been documented that could be used as a guide to the structural changes that will result, but we note that Ti-O bond lengths are much shorter than Yb-O bond lengths (~1.95 Å vs. ~2.3 Å) and Ti-O-Ti bond angles tend to be approximately 130°. Thus, oxygen atoms in the 1Ti3Yb tetrahedra will be displaced away from the stuffed atom towards the Ti atoms at the outer vertices of the orange tetrahedra in Fig. 7(d). Nevertheless, these changes still do not satisfy the normal oxygen bonding configurations with Ti4+ or Yb3+. It therefore seems likely – and is indeed indicated by our EELS results – that replacement of Ti4+ by Yb3+ will result in one of the adjacent Ti atoms reducing to Ti3+ with an accompanying vacancy in that 1Ti3Yb tetrahedron (highlighted red in Figs. 7(d) and 7(h)). Still further changes in structure are possible such as static distortions of the cation framework, with the tetrahedron containing the oxygen vacancy expanding due to Coulomb repulsion. There are likely to be significant effects on the magnetic 4Yb tetrahedra that surround the stuffed atom; there are six nearby
4Yb tetrahedra, numbered in Fig. 7(d). We note that a study of oxygen deficient Y2Ti2O7 [10] found that 4Y tetrahedra were much more likely to lose their oxygen atom and it is thus possible that the oxygen vacancy in the red tetrahedron moves into the adjacent 4Yb tetrahedron #2. In any case, tetrahedron #2 is most affected. It is clear from Figs. 7(e) and 7(g) that the replacement of a nonmagnetic Ti4+ cation by a magnetic Yb3+ can modify the nature of the magnetic exchange with the system through formation of the frustrated triangular lattice of magnetic cations. Furthermore, the introduction of a magnetic moment on the Ti site as a consequence of reduction of Ti4+ to magnetic Ti3+ as well as stuffing the Yb atom onto the Ti site will disrupt the magnetic order locally and may serve as pinning sites for magnetic defects (monopoles in spin ice) within the material [10].
FIG. 8.The four types of [2 1 1] atom columns in Yb2Ti2O7, shown as a chain of cation tetrahedra. The black
arrow indicates the direction of propagation of the electron beam. Partial transparency highlights the repeat motif of 10 cations; the number of Ti (dark blue) and Yb (light blue) atoms in the motif is given at the bottom of each panel. The [2 1 1] projection of each column is inset bottom right. Color scheme is the same as Fig. 1.
In a stuffed material, the oxygen atom inside a tetrahedron will be affected by all four atoms at its vertices, which means that the oxygen atoms close to any given [2 1 1] atom column depend upon the chains of tetrahedra shown in Fig. 8, not just the atoms in the column. The oxygen atoms are therefore very sensitive to stuffing. Furthermore, the difference in Yb:Ti ratio for each chain means that each has a different sensitivity. Thus, using the same binomial statistics (Eq. 1) for a 45 nm thick TEM
specimen, and e.g. 1% stuffing and no anti-stuffing, we find that only 30% of M columns and 50% of Ti columns are directly affected by stuffing (obviously, no Yb columns are affected). However, the nearby oxygen atoms are affected in around 67% of M1 columns, 77% of Ti columns, 89% of Yb columns and 92% of M2 columns. That is, the radial profiles of Yb and M2 columns should be more affected by stuffing than the Ti and M1 columns and this does indeed appear to be the case in Figs. 4(g-i). Furthermore, the structural rearrangements illustrated in Fig. 7 will tend to move oxygen atoms away from M1 columns more readily than M2 columns, producing the changes in radial profile shown in Figs. 4(g-i).
long-range ferromagnetic order. These results are consistent with the magnetic properties of Sample 3 (Fig. 1(a)) showing no clear transition in the specific heat down to 50 mK.
V. CONCLUSIONS
We have examined three samples of Yb2Ti2O7, with different low temperature specific heat capacity anomalies that indicate varying magnetic properties, using aberration-corrected STEM. We find direct evidence for stuffing of Yb onto Ti sites, using atomic resolution EDX of Ti atomic columns that have anomalously bright contrast, in Sample 3. We also observe Yb atomic columns that have anomalously dark contrast, but are unable to use the well-known compositional sensitivity of ADF-STEM to extract the statistics of stuffing (or anti-stuffing) due to the confounding effects specimen thickness variations and/or surface damage. Nevertheless, we clearly observe the influence of oxygen atoms on these images, and by examining the radial intensity profile of cation columns we observe rather different behavior of oxygen atoms near to the cation columns for the three samples. The sensitivity of the different types of atom column in the [2 1 1] ADF-STEM images is explained by considering them as chains of tetrahedra with different Ti:Yb ratios. The changes are consistent with the rearrangement of oxygen atoms away from Yb that occupies Ti sites. Using Ti-L3,2 ELNES, we find that these differences in ADF-STEM radial intensity profile are accompanied by changes in Ti valence number, indicating the presence of magnetic Ti3+ and oxygen vacancies. Samples that have more diffuse specific heat capacity anomalies have more stuffing, lower Ti valence numbers and more disordered oxygen sublattices.
The methods described here can readily be applied to other pyrochlore systems where a similar sensitivity to structural defects, including stuffing [9], has recently been shown to lead to significant differences in the magnetic behavior, for example, the magnetic ground state of the spin liquid candidate Tb2Ti2O7 [62] and magnetic monopole dynamics in spin ice Dy2Ti2O7 [63]. Studies of this kind should also prove useful in understanding the physics of other frustrated magnets where defects or low levels of doping rapidly modify the physics; examples include triangular lattice magnets such as CuFeO2 and RbFe(MoO4)2, and order-by-disorder transitions that occur in several lattice motifs.
More generally, such methods could play a valuable role in the study of emergent phenomena, including superconductivity and magnetism, both in the bulk and at interfaces, when defects are known to be important.
Part of the work was supported by EPSRC, UK, Grant M028771/1. A.M. acknowledges the University of Warwick Chancellor’s International Scholarship for financial support.
References
[1] J. S. Gardner, M. J. P. Gingras, and J. E. Greedan, Reviews of Modern Physics 82, 53 (2010). [2] L. Pauling, Journal of the American Chemical Society 57, 2680 (1935).
[3] S. T. Bramwell and M. J. P. Gingras, Science 294, 1495 (2001). [4] J. E. Greedan, Journal of Alloys and Compounds 408, 444 (2006).
[5] J. N. Reimers, J. E. Greedan, and M. Sato, Journal of Solid State Chemistry 72, 390 (1988). [6] H. D. Zhou, C. R. Wiebe, A. Harter, N. S. Dalal, and J. S. Gardner, Journal of Physics-Condensed
Matter 20, 325201 (2008).
[7] H. Yamamura, H. Nishino, K. Kakinuma, and K. Nomura, Solid State Ionics 158, 359 (2003). [8] M. W. Gaultois, P. T. Barton, C. S. Birkel, L. M. Misch, E. E. Rodriguez, G. D. Stucky, and R.
Seshadri, Journal of Physics-Condensed Matter 25, 186004 (2013).
[9] G. C. Lau, B. D. Muegge, T. M. McQueen, E. L. Duncan, and R. J. Cava, Journal of Solid State Chemistry 179, 3126 (2006).
[10] G. Sala, M. J. Gutmann, D. Prabhakaran, D. Pomaranski, C. Mitchelitis, J. B. Kycia, D. G. Porter, C. Castelnovo, and J. P. Goff, Nature Materials 13, 488 (2014).
[11] K. A. Ross, T. Proffen, H. A. Dabkowska, J. A. Quilliam, L. R. Yaraskavitch, J. B. Kycia, and B. D. Gaulin, Physical Review B 86, 174424 (2012).
[12] K. A. Ross, L. Savary, B. D. Gaulin, and L. Balents, Physical Review X 1, 021002 (2011). [13] A. Yaouanc, P. D. de Reotier, C. Marin, and V. Glazkov, Physical Review B 84, 172408 (2011). [14] H. W. J. Blöte, R. F. Wielinga, and W. J. Huiskamp, in Physica1968), pp. 549.
[15] Y. Yasui et al., Journal of the Physical Society of Japan 72, 3014 (2003).
[16] L.-J. Chang, S. Onoda, Y. Su, Y.-J. Kao, K.-D. Tsuei, Y. Yasui, K. Kakurai, and M. R. Lees, Nature Communications 3, 992 (2012).
[17] L.-J. Chang, M. R. Lees, I. Watanabe, A. D. Hillier, Y. Yasui, and S. Onoda, Physical Review B
89, 184416 (2014).
[18] E. Lhotel, S. R. Giblin, M. R. Lees, G. Balakrishnan, L. J. Chang, and Y. Yasui, Physical Review B 89, 224419 (2014).
[19] J. Gaudet, K. A. Ross, E. Kermarrec, N. P. Butch, G. Ehlers, H. A. Dabkowska, and B. D. Gaulin, Physical Review B 93, 064406 (2016).
[20] A. Yaouanc, P. D. de Reotier, L. Keller, B. Roessli, and A. Forget, Journal of Physics-Condensed Matter 28, 426002 (2016).
[21] M. J. P. Gingras and P. A. McClarty, Reports on Progress in Physics 77, 056501 (2014).
[22] R. Applegate, N. R. Hayre, R. R. P. Singh, T. Lin, A. G. R. Day, and M. J. P. Gingras, Physical Review Letters 109, 097205 (2012).
[23] K. A. Ross et al., Physical Review B 84, 174442 (2011). [24] R. M. D'Ortenzio et al., Physical Review B 88, 134428 (2013). [25] J. A. Hodges et al., Physical Review Letters 88, 077204 (2002).
[26] J. S. Gardner, G. Ehlers, N. Rosov, R. W. Erwin, and C. Petrovic, Physical Review B 70, 180404 (2004).
[27] K. A. Ross, J. P. C. Ruff, C. P. Adams, J. S. Gardner, H. A. Dabkowska, Y. Qiu, J. R. D. Copley, and B. D. Gaulin, Physical Review Letters 103, 227202 (2009).
[29] L. D. C. Jaubert, O. Benton, J. G. Rau, J. Oitmaa, R. R. P. Singh, N. Shannon, and M. J. P. Gingras, Physical Review Letters 115, 267208 (2015).
[30] J. Robert, E. Lhotel, G. Remenyi, S. Sahling, I. Mirebeau, C. Decorse, B. Canals, and S. Petit, Physical Review B 92, 064425 (2015).
[31] K. Baroudi, B. D. Gaulin, S. H. Lapidus, J. Gaudet, and R. J. Cava, Physical Review B 92, 024110 (2015).
[32] M. A. Subramanian, G. Aravamudan, and G. V. S. Rao, Prog. Solid State Chem. 15, 55 (1983). [33] M. L. Hand, M. C. Stennett, and N. C. Hyatt, Journal of the European Ceramic Society 32, 3211
(2012).
[34] See Supplemental Material at [URL will be inserted by publisher] for Crystallographic Information.
[35] K. Kimoto, T. Asaka, T. Nagai, M. Saito, Y. Matsui, and K. Ishizuka, Nature 450, 702 (2007). [36] N. Li, K. Du, G. Liu, Y. Xie, G. Zhou, J. Zhu, F. Li, and H.-M. Cheng, Journal of Materials
Chemistry A 1, 1536 (2013).
[37] D. A. Muller, N. Nakagawa, A. Ohtomo, J. L. Grazul, and H. Y. Hwang, Nature 430, 657 (2004). [38] I. MacLaren and Q. M. Ramasse, International Materials Reviews 59, 115 (2014).
[39] P. Hartel, H. Rose, and C. Dinges, Ultramicroscopy 63, 93 (1996).
[40] R. Ishikawa, A. R. Lupini, S. D. Findlay, and S. J. Pennycook, Microscopy and Microanalysis 20, 99 (2014).
[41] Y.-M. Kim et al., Nature Materials 11, 888 (2012).
[42] K. Lu, E. Sourty, and J. Loos, Journal of Electron Microscopy 59, 531 (2010).
[43] D. Wang, H. L. Xin, R. Hovden, H. Wang, Y. Yu, D. A. Muller, F. J. DiSalvo, and H. D. Abruna, Nature Materials 12, 81 (2013).
[44] J. M. LeBeau, S. D. Findlay, L. J. Allen, and S. Stemmer, Nano Letters 10, 4405 (2010).
[45] H. Kauko, C. L. Zheng, Y. Zhu, S. Glanvill, C. Dwyer, A. M. Munshi, B. O. Fimland, A. T. J. van Helvoort, and J. Etheridge, Applied Physics Letters 103, 232111 (2013).
[46] T. Mehrtens, K. Muller, M. Schowalter, D. Z. Hu, D. M. Schaadt, and A. Rosenauer, Ultramicroscopy 131, 1 (2013).
[47] A. Rosenauer et al., Ultramicroscopy 111, 1316 (2011).
[48] M. Schowalter, I. Stoffers, F. F. Krause, T. Mehrtens, K. Mueller, M. Fandrich, T. Aschenbrenner, D. Hommel, and A. Rosenauer, Microscopy and Microanalysis 20, 1463 (2014).
[49] V. Grillo, E. Carlino, and F. Glas, Physical Review B 77, 054103 (2008).
[50] R. F. Egerton, Electron Energy Loss Spectroscopy in the Electron Microscope (Springer US, 2011), 3 edn.
[51] J. Kirkland, Advanced Computing in Electron Microscopy (Springer, 2010). [52] P. W. Hawkes and J. C. H. Spence, Science of Microscopy (Springer, 2007), v. 1. [53] J. M. LeBeau and S. Stemmer, Ultramicroscopy 108, 1653 (2008).
[54] C. Koch, Ph.D., Arizona State University, 2002.
[55] A. Rosenauer and M. Schowalter, in Microscopy of Semiconducting Materials 2007, edited by A. G. Cullis, and P. A. Midgley2008), pp. 169.
[56] See Supplemental Material at [URL will be inserted by publisher] for STEM Results. [57] See Supplemental Material at [URL will be inserted by publisher] for EDS Results.
[58] E. Eberg, A. T. J. van Helvoort, R. Takahashi, M. Gass, B. Mendis, A. Bleloch, R. Holmestad, and T. Tybell, Journal of Applied Physics 109, 034104 (2011).
[59] E. Stoyanov, F. Langenhorst, and G. Steinle-Neumann, American Mineralogist 92, 577 (2007). [60] J. M. Zhang, A. Visinoiu, F. Heyroth, F. Syrowatka, M. Alexe, D. Hesse, and H. S. Leipner,
[61] L. A. Grunes, R. D. Leapman, C. N. Wilker, R. Hoffmann, and A. B. Kunz, Physical Review B 25, 7157 (1982).
[62] M. Ruminy, L. Bovo, E. Pomjakushina, M. K. Haas, U. Stuhr, A. Cervellino, R. J. Cava, M. Kenzelmann, and T. Fennell, Physical Review B 93, 144407 (2016).
![FIG. 2. (Eq. 1), for different amounts of average atom swapping (0.4% to 3%). This is equivalent to a [211] YbThe fraction of columns with 73 atoms that have between zero and five foreign atoms predicted by 2Ti2O7 specimen with thickness 45nm](https://thumb-us.123doks.com/thumbv2/123dok_us/9441366.451411/6.612.181.421.195.369/different-swapping-equivalent-fraction-columns-predicted-specimen-thickness.webp)
![FIG. 3. Specific heat as a function of temperature for the three Yb2Ti2O7 samples in zero magnetic field [15,16,18]](https://thumb-us.123doks.com/thumbv2/123dok_us/9441366.451411/7.612.188.417.506.693/fig-specific-heat-function-temperature-samples-magnetic-field.webp)
![FIG. 4. ADF-STEM images taken with an ADF detector inner angle of 2.4α, (a) Sample 1, (b) Sample 2 and (c) Sample 3, viewed along [2 1 1] (scale bar is 2 nm) (d) shows extracted mean integrated intensities from (a) using Voronoi cells centred on each atomi](https://thumb-us.123doks.com/thumbv2/123dok_us/9441366.451411/9.612.65.558.190.663/detector-sample-sample-extracted-integrated-intensities-voronoi-centred.webp)

![FIG. 8. The four types of [2 1 1] atom columns in Yb2Ti2O7, shown as a chain of cation tetrahedra](https://thumb-us.123doks.com/thumbv2/123dok_us/9441366.451411/16.612.58.564.68.322/fig-types-atom-columns-shown-chain-cation-tetrahedra.webp)
