Manuscript version: Author’s Accepted Manuscript
The version presented in WRAP is the author’s accepted manuscript and may differ from the published version or Version of Record.
Persistent WRAP URL:
http://wrap.warwick.ac.uk/114217
How to cite:
Please refer to published version for the most recent bibliographic citation information. If a published version is known of, the repository item page linked to above, will contain details on accessing it.
Copyright and reuse:
The Warwick Research Archive Portal (WRAP) makes this work by researchers of the University of Warwick available open access under the following conditions.
© 2017 Elsevier. Licensed under the Creative Commons Attribution-NonCommercial-NoDerivatives 4.0 International http://creativecommons.org/licenses/by-nc-nd/4.0/.
Publisher’s statement:
Please refer to the repository item page, publisher’s statement section, for further information.
Shear degradation of corn starches with different amylose contents
Xingxun Liu, Xiaoming Xiao, Peng Liu, Long Yu, Ming Li, Sumei Zhou, Fengwei Xie
PII: S0268-005X(16)30845-1
DOI: 10.1016/j.foodhyd.2016.11.023
Reference: FOOHYD 3684
To appear in: Food Hydrocolloids
Received Date: 19 August 2016
Revised Date: 14 November 2016
Accepted Date: 18 November 2016
Please cite this article as: Xingxun Liu, Xiaoming Xiao, Peng Liu, Long Yu, Ming Li, Sumei Zhou, Fengwei Xie, Shear degradation of corn starches with different amylose contents, Food
(2016), doi: 10.1016/j.foodhyd.2016.11.023 Hydrocolloids
Graphical abstract
Highlights
Starch structural changes under shear was studied using SEC and
SAXS
Amylopectin molecules degraded to a stable size under shear
Shear disrupted the starch lamellar structure effectively
Higher-amylopectin starch was more prone to granule damage
1
Shear degradation of corn starches with different amylose contents
2
3 Xingxun Liua,*, Xiaoming Xiaob, Peng Liuc, Long Yub, Ming Lia, Sumei Zhoua, Fengwei Xied,**
4
5 a Institute of Food Science and Technology (IFST), Chinese Academy of Agricultural Science (CAAS), Beijing,
6 100193, China
7 b School of Food Science and Engineering, South China University of Technology (SCUT), Guangzhou,
8 510640, China
9 c School of Chemistry and Chemical Engineering, Guangzhou University, Guangzhou, 510006, China
10 d School of Chemical Engineering, The University of Queensland, Brisbane, Qld 4072, Australia
11
12
13 *Corresponding author at: Institute of Food Science and Technology, CAAS, Beijing, China. E-mail:
14 ytboy652@163.com (X. Liu).
15 ** Corresponding author at: School of Chemical Engineering, The University of Queensland, Brisbane, Qld
16 4072, Australia. Email: f.xie@uq.edu.au, fwhsieh@gmail.com (F. Xie)
17
18 Abstract: This work investigated the effect of shear on the starch degradation, with a particular
19 focus on the changes in molecular and lamellar structures. Corn starches with different
20 amylose/amylopectin ratios (waxy corn starch, or WCS: 1:99; normal corn starch, or NCS: 25:75;
21 and Gelose 80 starch, or G80: 80:20) were used as model materials to be processed using a Haake
22 twin-rotor mixer for different times. Molecular and lamellar structural analysis was performed using
23 size-exclusion chromatography (SEC) and small-angle X-ray scattering (SAXS). The degree of
24 damage of starch at the granule level was evaluated by an assay kit. The results showed that amylose
25 molecules in starch granules did not change significantly, while amylopectin molecules degraded to a
26 stable size caused by the shear treatment. The average thickness of semi-crystalline lamellae
27 disappeared rapidly during processing. A typical positive deviation from Porod’s law at a high q
28 region was observed, attributed to the presence of thermal density fluctuations or mixing within
29 phases. Nonetheless, the degree of mixing within phases for the processed samples was lower than
30 the native starch. The study of the mass fractal structure indicated that the scattering objects of the
31 processed starches were more compact than those of the native counterparts. Furthermore, waxy corn
32 starch (containing mostly amylopectin) experienced the greatest granule damage than the other
33 starches. All the results showed that the rigid crystal structure in amylopectin is more sensitive to the
34 shear treatment than the flexible amorphous structure in amylose. This mechanistic understanding at
35 the microstructure level is helpful in designing the processing of starch-based foods or plastics with
36 desired functional properties.
37
38 Keywords: starch, degradation, shear strength, amylose, lamellar structure
39 1. Introduction
40 Starch is the main component of cereal-based foods, which is a primary source of energy for
41 humans. Besides, due to its total biodegradability, low cost, and wider availability, starch has
42 attracted much attention as an important raw material for producing biodegradable plastics to replace
43 some petroleum-based polymers (Yu, Dean, & Li, 2006). Extrusion is commonly used in industry for
44 the processing of starch-based foods and materials. Gelatinization and degradation are two most
45 important phenomena in extrusion processing, affecting the material performance (Liu et al., 2013).
46 Starch degradation during processing has shown to be strongly correlated to the mechanical
47 properties of starch-based materials (Liu, Halley, & Gilbert, 2010; Li, Hasjim, Xie, Halley, &
48 Gilbert, 2014).
49 It is well known that the multi-scale structure of the starch granule is mainly composed of
50 amylose and amylopectin. These two macromolecules are the basis of the aggregation and granule
51 structure of starch and provide an excellent conceptual approach to the understanding of the
52 structure-processing-property relationships of natural polymers (Pérez & Bertoft, 2010; Wu, Witt, &
53 Gilbert, 2013; Liao, Liu, Liu, Lin, Yu, & Chen, 2014). Amylose is a linear molecular with a few long
54 branches, whereas amylopectin is highly branched, containing ~5% branching points and a large
55 number of short branches (Damager, Engelsen, Blennow, Lindberg Møller, & Motawia, 2010; Pérez
56 et al., 2010). The outer parts of amylopectin branches (A and B1 chains) form clusters of double
57 helices, which build up the crystalline lamellae; and the internal parts (B2, B3 and C chains) locate in
58 the amorphous lamellae (Jane, Xu, Radosavljevic, & Seib, 1992). The alternating crystalline and
59 amorphous lamellae with a ~9 nm repeat distance collectively form the semi-crystalline growth rings
60 in a starch granule (Calvert, 1997; Damager et al., 2010). Amylose is in either amorphous or single
61 helical conformation and is interspersed among amylopectin molecules (Jane et al., 1992;
Lopez-62 Rubio, Flanagan, Gilbert, & Gidley, 2008).
63 The mechanical shear in extrusion processing induces gelatinization, with the breakage of the
64 crystalline structure of starch (Xie, Halley, & Avérous). This process is entirely different from the
65 usual gelatinization process under heat-moisture treatment (Zhang, Chen, Liu, & Wang, 2010) or
66 annealing (Liu, Yu, Simon, Dean, & Chen, 2009). In our previous paper, the lamellar structure of
67 starch during gelatinization process was studied by synchrotron-SAXS/WAXS (Zhang et al., 2015;
68 Kuang et al., 2016). It was observed that, before the gelatinization temperature, the lamellar peak
69 intensity decreased, and the thickness of crystalline lamellae increased, whereas the size of both
70 amorphous and crystallinity lamellae disappeared rapidly around the gelatinization temperature.
71 However, there have been no comprehensive studies on the change of starch lamellar structure under
72 shear treatment.
73 On the other hand, shear may also induce the change in the molecular size of starch. Liu et al.
74 (2010) and Li et al. (2014) have used size-exclusion chromatography (SEC) to investigate the
75 degradation mechanism of corn starch during extrusion. They found that the mechanical energy
76 played a dominant role in reducing the starch molecular size, and amylopectin in starch granules was
77 more susceptible to shear degradation than amylose. However, as extrusion is a process involving a
78 complex flow and multiple temperature sections, it is difficult to obtain a precise understanding of
79 the relationship between processing conditions and the resultant structure of starch.
80 Recently, an internal twin-rotor mixer has been used to understand the gelatinization (Xue,
81 Yu, Xie, Chen, & Li, 2008; Wang, Yu, Xie, Chen, Li, & Liu, 2010) and chemical modification (Qiao
82 et al., 2012; Qiao, Bao, Liu, Chen, Zhang, & Chen, 2014) of starch during processing. A HAAKE
83 Rheomix twin-rotor mixer can not only be used a processing device, but also serves as a rheometer to
84 accurately monitoring the processing conditions (Yang, Bigio, & Smith, 1995). This device can
85 represent a short section of an extruder so it could be useful to understand the processing-structure
86 relationship in a simpler manner. Yet, the change of the multi-level starch structure during kneading
87 using a twin-rotor mixer has not been reported.
88 In this study, corn starches with different amylose/amylopectin ratios were used as model
89 materials to reveal the shear-induced starch degradation during kneading. The molecular and
90 lamellar structures were studied by SEC and small-angle X-ray scattering (SAXS), respectively. The
91 information obtained from this study would help to understand the shear degradation mechanism and
92 to design new starch materials with accurately-controlled structures.
93
94 2. Material and Method
95 2.1 Sample and sample prepared
96 Commercially-available corn starches with different amylose contents were used in this
97 experimental work. Waxy corn starch (WCS) (1% amylose content) was supplied by Lihua Starch
98 Industry Co., Ltd.. Normal corn starch (NCS) (25% amylose content) was provided by Huanglong
99 Food Industry Co., Ltd.. Gelose 80 starch (G80) (80% amylose content) was supplied by National
100 Starch Pty Ltd. (Lane Cove, NSW 2066, Australia).
101 Starch and water were pre-mixed in a high-speed mixer (capacity 10 L, SRLW 10/25,
102 Fanchang machinery Co. LCD, China) at 1000 rpm for 5 min. An infrared heating balance (Model
103 DHS-20, Longway & Yueping, Shanghai, China) was used to measure the moisture content during
104 heating the sample to 110 °C for 20 min. The total moisture content (about 35%) of a specimen was
105 taken as the sum of the original starch moisture content and the added water.
106
107 2.2Haake rheometer
108 A Haake Rheocord Polylab RC500p system incorporating a HAAKE Rhemix 600p
twin-109 rotor mixer (ThermoHaake, Germany) was used in the experimental work. This equipment was
110 described in detail previously (Xue et al., 2008; Wang et al., 2010). The material was introduced into
111 the mixer through a top-mounted loading hopper, and torque and temperature were recorded
112 immediately after loading. The roller speed of 75 rpm and initial temperatures 70 °C were used. The
113 samples were collected at different times (0, 2, 5, 7, 10 and 15 min) and ground into power using a
114 cryo-grinder (ZM200, Retsch) under liquid nitrogen for further analysis.
115
116 2.3 Size-exclusion chromatography
117 The molecular size and size distribution of fully-branched and debranched starch molecules
118 were measured using size-exclusion chromatography (SEC) (Tran, Shelat, Tang, Li, Gilbert, &
119 Hasjim, 2011). The extracted native starch granules (about 6 mg) were dissolved in DMSO/LiBr
120 solution and then debranched using isoamylase in acetate buffer (pH ~3.5), following the method of
121 Li, Hasjim, Dhital, Godwin, and Gilbert (2011). Then, the weight size distributions of fully-branched
122 and debranched starch molecules were analyzed in duplicate using SEC (Agilent 1260 series, Agilent
123 Technologies, Santa Clara, California, USA) equipped with a refractive index detector (Optilab
T-124 rEX, WYATT Corp., USA). The injection volume was 100 μL, the flow rate was 0.3 mL/min, and
125 the column oven temperature was at 80 °C. A series of columns (GRAM precolumn, GRAM 30, and
126 GRAM 3000 analytical columns, Polymer Standard Services, Mainz, Germany) were used to analyze
127 the size distribution of fully-branched starch molecules.Another series of columns (GRAM
128 precolumn, GRAM 100, and GRAM 1000 analytical columns, Polymer Standard Services, Mainz,
129 Germany) were used to analyze the size distribution of debranched starch molecules. A series of
130 pullulan standards (Polymer Standard Services, Mainz, Germany) with varying molecular weights
131 ranging from 342 to 2.35 × 10⁶ Da were used for calibration to obtain the relationship between the
132 SEC elution volume and the hydrodynamic volume Vh (which is the separation parameter for SEC).
133 Data are presented as the SEC weight distribution, w(log Vh), as a function of the corresponding
134 hydrodynamic radius Rh, with Vh = (4/3)PiRh3. Because the largest standard had a hydrodynamic
135 radius of ~ 50 nm, this is the maximum size at which calibration is reliable. The dependence of Rh on
136 elution volume for larger sizes was obtained by extrapolation of the calibration curve and thus are
137 only semi-quantitative, and also sensitive to day-to-day variations (Wang, Hasjim, Wu, Henry, &
138 Gilbert, 2014).
139
140 2.4 Small-angle X-ray scattering (SAXS)
141 Synchrotron small-angle X-ray scattering (SAXS) measurements were carried out at the
142 BL16B1 beamline at the Shanghai Synchrotron Radiation Facility (SSRF), China. Distilled water
143 was added to the starch in a glass vial to obtain a starch suspension with the starch:water ratio being
144 1:3 (w/v). The suspension was equilibrated for 24 h before SAXS tests. Then, the starch suspension
145 (0.70 mL) was loaded into a 2-mm-thick sample cell, of which both the front and back windows
146 were covered with the Kapton tape. Two-dimensional (2D) Mar165 were used to collect the 2D
147 SAXS patterns. The wavelength of the incident X-ray was 1.24 Å, and the sample-to-detector
148 distance (SDD) was 1940 mm for SAXS measurements. A beef tendon specimen was used as
149 standard materials for the calibration of the scattering vector of SAXS. By measuring sample
150 adsorption using the ionization chambers in the front and back of the sample cell, we performed data
151 correction, calibrated the SAXS data from the background scattering, and normalized the data on the
152 primary beam intensity. Background subtraction follows the equation:
153 𝐼𝑠(𝜃) =𝐼𝑡(𝜃)‒𝐼𝐼𝑡 Ib(θ). 𝑏
𝑇𝑡
𝑇𝑏
154 It(θ), Ib(θ) and Is(θ) represent the distribution of scattering intensity of samples held in cells, sample
155 cells and pure samples, respectively. It and I represent values of samples held in the cells and sample
156 cells, read from the ionization chambers in front of sample cell. Ti and Tt represent the transmissivity
157 of the samples held in cells and sample cells.
158
159 2.5 Damage of starch granules
160 The degree of damage to starch granules was determined according to the AACC method
76-161 31.01 using an assay kit from Megazyme International Ltd. (Ireland) (AACC International Method
162 76-31.01). The tests were based on the susceptibility to amylolytic enzyme hydrolysis, using the
163 Megazyme starch damage assay kit in triplicate, following the procedure provided by the
164 manufacturer (AACC International Method 76-13.01).
165
166 3. Result and Discussion
167 3.1 Shear behavior of starch
168 The Haake rheometer with a twin-roll mixer can be used not only for melting and blending of
169 polymers (Liu, Wang, Chow, Yang, & Mitchell, 2014), but also provides information on torque
170 variation during the kneading process. Fig. 1 shows a typical curve of torque variation with time for
171 a starch during kneading. The peak (a) occurred during the loading due to the resistance force when
172 the cold materials were rapidly loaded into the mixer. After the loading of material, the torque
173 decreased, and then increased to form a broad peak (b), representing the maximum viscosity
174 resulting from the granule swelling and gelatinization. After the second peak (b), more starch
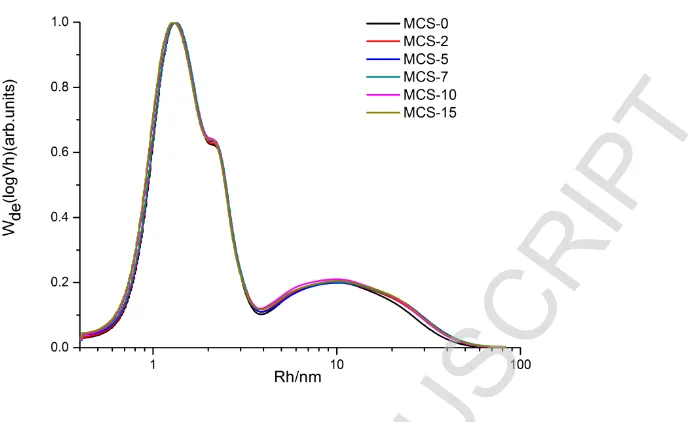
175 granules were destroyed, resulting in a decreasing torque (c) until the end of the measurement (20
176 min), with the gradually-reduced decrease rate (d). Moreover, the temperature increased gradually
177 with time, resulting in the reduction in viscosity and torque.
178 In our previous paper (Xue et al., 2008; Wang et al., 2010), the effects of water content, rotor
179 speed and initial temperature on the torque and temperature have been studied. The results showed
180 that the starch granules first swelled and then disintegrated, and finally all the granules were
181 destroyed. Microscopy and DSC confirmed that the semi-crystallinity structure of starch granules
182 was destroyed by the shear stress.
183
184 3.2 Molecular size distribution of fully branched starch during shear
185 Although DSC and polarized-light microscopy can detect the crystal structure change during
186 the kneading process, the change of starch molecular structure (such as size and size distribution) is
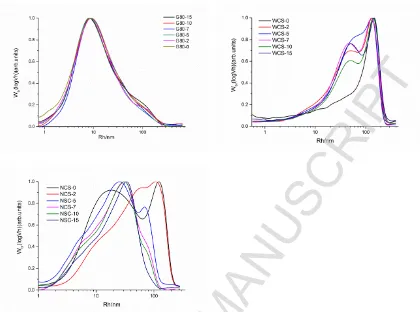
187 still unclear. Fig. 2 shows weight distributions of the whole (fully-branched) starch molecules
188 collected at different kneading times by SEC. All the weight distributions of the whole starch
189 molecules were normalized to the highest peak. For NCS, two peaks were observed from SEC. One
190 peak (Rh = ~10 nm) was due to amylose, and the other (Rh = ~100 nm) was due to amylopectin (Liu
191 et al., 2010; Tran et al., 2011; Li et al., 2014).
192 The amylopectin peak area for NCS and WCS became smaller and amylose peak area
193 became larger during kneading compared with their native counterparts. However, the value did not
194 change significantly for G80, which may relate to its more intact granule (Li et al., 2014). From Fig.
195 2, it was clearly seen that the amylose/amylopectin ratio also affected the degradation mechanism of
196 starch. The amylopectin molecule was easier to degrade than amylose during kneading. For the
197 degraded amylopectin molecules (WCS), a new peak (Rh = ~50 nm) representing the stable size
198 achieved during kneading could be identified. The shear-induced molecular size reduction to a stable
199 value has also been reported previously (Liu et al., 2010; Li et al., 2014). For NCS, the size of
200 amylopectin molecules decreased with time and showed a stable size of 50 nm. For amylose
201 molecules (G80), the highest value of Rh was about 10 nm from the whole molecules SEC weight
202 distributions, which was smaller than the stable size for WCS and NCS. This difference might be due
203 to the smaller size of the amylose in G80.
204
205 3.3 Molecular size distribution of debranched starch during shear
206 Typical SEC weight distributions of debranched starch molecules are shown in Fig. 3. For
207 NCS, a bi-modal peak was observed which was associated with the amylopectin branches (Rh < 4
208 nm) and there was a broader bi-modal peak, which was associated with the amylose branches (Rh > 4
209 nm) (Tran et al., 2011). Besides, there was a shoulder peak at about Rh≈ 2 nm representing the B2,
210 B3 chains in amylopectin branches, which spans more than one lamella. In Fig. 3, there were no
211 qualitative differences in the weight distributions of the debranched starch between NCS and its
212 processed samples collected at different times. The results indicated that the glycosidic bonds near or
213 at the branching points, sometimes termed building blocks (Dhital, Shrestha, & Gidley, 2010), of the
214 amylopectin molecules, were susceptible to shear degradation during the melting kneading process.
215 WCS and G80 showed similar results in this study.
216
217 3.4 Lamellar structure change during shear
218 The SAXS one-dimensional (1D) scattering intensity distributions for starches with different
219 amylose content are shown in Fig. 4. A clear lamellar peak at q = ~0.68 nm−1 was observed in SAXS
220 curves of native starches, which was corresponding to the 9–10 nm semi-crystalline lamellar
221 structure of starch (Chen, Wang, Kuang, Zhou, Wang, & Liu, 2016). From Fig. 4, it can be clearly
222 seen that the scattering intensity of the lamellar peak for the amylopectin-rich starch was higher than
223 the amylose-rich starch, indicating a higher electron density contrast (Δr = ρc – ρa, where ρc and ρa
224 are the electron densities of the crystalline regions and the amorphous regions in the semi-crystalline
225 lamellae) between crystalline and amorphous lamellae
226 It could also be clearly seen in Fig. 4 that the lamellar peak disappeared rapidly (as early as 2
227 min), which meant that the crystalline lamellar structure was damaged by shear. The kneading
228 process is different from a general gelatinization process where heating (Vermeylen, Derycke,
229 Delcour, Goderis, Reynaers, & Koch, 2006; Zhang et al., 2015), microwave heating (Fan et al., 2013;
230 Fan et al., 2014), or ultra-high hydrostatic pressure (Yang, Gu, Lam, Tian, Chaieb, & Hemar, 2016a)
231 was applied. The in-situ SAXS data showed that the change under mechanical kneading was a more
232 gradual process. The crystalline lamellar size of starch obtained from the correlation function was
233 increased even before the gelatinization temperature. The twin-rotor mixer would provide the shear
234 energy to destroy the starch granules structure. The rigid crystallites in starch granules were mainly
235 formed by amylopectin and these crystallites were most susceptible to shear, as seen from the SEC
236 results showing the decrease in the size of amylopectin. The destruction to the amylopectin
237 crystallites was proposed to lead to the disappearance of the lamellar peak.
238
239 3.5 Mixing within phase and fractal dimension of starch granule
240 It is well known that only the scattering by an ideal two-phase system with sharp boundaries
241 obeys Porod’s law (Li et al., 2001). However, deviation from this law is often observed in practice. A
242 negative deviation is due to the finite diffuse-boundary thickness between two phases and a positive
243 deviation due to the density fluctuation resulting from either the movement of electrons or
244 compositional heterogeneity within scattering elements (Xu et al., 2004). In this study, the ln (I × q4)
245 ~q2 patterns of the starch treated in the mixer are shown in Fig. 5. All the starch samples showed a
246 typical positive deviation from Porod’s law at a high q region, which could be attributed to the
247 presence of thermal density fluctuations or mixing within phases (Yang et al., 2016a; Yang et al.,
248 2016b). In the current work, the mixing of the starch was that between crystalline and amorphous
249 phases. Compared to the native starch, the treated starch displayed a reduced slope, suggesting the
250 degree of mixing within phases was lower than the native starch.
251 The fractal dimension from SAXS data can be used to describe the self-similar structure of
252 starch granules in a given region (Suzuki, Chiba, & Yarno, 1997), which means the structure is
253 independent of the observation scale. The fractal dimension helps to quantify the compactness
254 properties such as mass (m) and surface area (A). The slope (−α) of logI (q) vs. log q curves in the
255 linear region was calculated, with linear regression analysis, leading to fractal dimensions (Df). For α
256 between 1 and 3, Df equals α and the material is characterized as mass fractal (Dm) in a
257 dimensional space (Leite et al., 2007). These parameters could indicate if the density profile of the
258 scattering objects has a self-similar nature.
259 The length scale for Df ranging from 1 to 3 for all corn starches with different mixing time is
260 between 32 nm and 57 nm, suggesting the presence of a mass fractal structure in starch granules.
261 However, the value for the shear-treated starch was lower than the native starch, which meant that
262 the scattering objects in the treated starch were more compact.
263
264 3.6 Degree of damage of starch granules
265 Mechanical kneading can damage starch granules to some extent, which significantly
266 influence the physicochemical properties of starch. The damage to the starch granules in the mixer
267 (see Table 1) increased significantly from about 0 to over 20%, even 40% for WCS. Moreover, the
268 degree of damage for WCS was higher than that for G80, which also suggested that WCS was more
269 fragile. The different susceptibility of various starches was also observed using lab-scale ball milling
270 (Tester, 1997). The degrees of damage of starches detected here were in agreement with our previous
271 paper (Wang et al., 2010). Overall, the starch with higher amylose content was more resistant to
272 external physical treatment.
273
274 4. Conclusion
275 The structural changes of corn starches with different amylose contents during kneading
276 using a twin-rotor mixer were investigated. Resulting from kneading, no apparent changes were
277 observed for the amylose molecules in starch granules, while amylopectin molecules degraded to a
278 stable size during the processing. The lamellar peak, which represents the average thickness of
279 crystalline lamellae disappeared rapidly during mixing. A typical positive deviation from Porod’s
280 law at a high q region was observed, which was attributed to the presence of thermal density
281 fluctuations or mixing within phases. The degrees of mixing within phases for the processed starches
282 were lower than for the native counterparts. The mass fractal values indicated that the scattering
283 objects of the processed starch were more compact. Moreover, the degree of damage of WCS was
284 higher than those of the other two starches. All the results showed that the rigid crystallites of
285 amylopectin in starch granules were more susceptible to shear degradation compared with the
286 flexible amorphous amylose. The starch degradation mechanism, concluded from the present study,
287 is similar to the dry grinding mechanism of starch granules at a cryogenic temperature. This
288 mechanistic understanding from the characterizations of different starch structural levels is helpful in
289 designing the processing of starch-based foods and plastics with desired structure and improved
290 functional properties.
291
292 Conflict of interest
293 The authors declare that there is no conflict of interests regarding the publication of this
294 paper.
295
296 Acknowledgments
297 The authors from China would like to acknowledge the research funds NFSC (Nos. 31301554
298 and 31571789).
299
300 References
301 AACC International. Approved Methods of Analysis, 11th Ed. Method 76-31.01. Determination of damaged starch. 302 Spectrophotometric method. Approved November 3rd, 1999. AACC International, St Paul, MN.
303 Calvert, P. (1997). Biopolymers: The structure of starch. Nature, 389, 338-339.
304 Chen, P., Wang, K., Kuang, Q., Zhou, S., Wang, D., & Liu, X. (2016). Understanding how the aggregation structure of 305 starch affects its gastrointestinal digestion rate and extent. International Journal of Biological Macromolecules, 306 87, 28-33.
307 Damager, I., Engelsen, S. B., Blennow, A., Lindberg Møller, B., & Motawia, M. S. (2010). First principles insight into the 308 α-glucan structures of starch: Their synthesis, conformation, and hydration. Chemical Reviews, 110,
2049-309 2080.
310 Dhital, S., Shrestha, A. K., & Gidley, M. J. (2010). Effect of cryo-milling on starches: Functionality and digestibility. Food
311 Hydrocolloids, 24, 152-163.
312 Fan, D., Wang, L., Chen, W., Ma, S., Ma, W., Liu, X., Zhao, J., & Zhang, H. (2014). Effect of microwave on lamellar 313 parameters of rice starch through small-angle x-ray scattering. Food Hydrocolloids, 35, 620-626.
314 Fan, D., Wang, L., Ma, S., Ma, W., Liu, X., Huang, J., Zhao, J., Zhang, H., & Chen, W. (2013). Structural variation of rice 315 starch in response to temperature during microwave heating before gelatinisation. Carbohydrate Polymers, 92, 316 1249-1255.
317 International, A. Aacc international method 76-13.01, total starch assay procedure (megazyme
amyloglucosidase/α-318 amylase method). First approval november 8, 1995; reapproval november 3, 1999. . AACC International, St. 319 Paul, MN, U.S.A.
320 International, A. Aacc international method 76-31.01, determination of damaged starch - spectrophotometric method.
321 Final approval november 8, 1995; reapproval november 3, 1999. St. Paul, MN, U.S.A.: AACC International. 322 Jane, J., Xu, A., Radosavljevic, M., & Seib, P. A. (1992). Location of amylose in normal starch granules. I. Susceptibility of 323 amylose and amylopectin to cross-linking reagents. Cereal Chemistry, 69, 405-409
324 Kuang, Q., Xu, J., Liang, Y., Xie, F., Tian, F., Zhou, S., & Liu, X. (2016). Lamellar structure change of waxy corn starch 325 during gelatinization by time-resolved synchrotron saxs. Food Hydrocolloids.
326 Leite, F. L., de Oliveira Neto, M., Paterno, L. G., Ballestero, M. R. M., Polikarpov, I., Mascarenhas, Y. P., Herrmann, P. S. 327 P., Mattoso, L. H. C., & Oliveira Jr, O. N. (2007). Nanoscale conformational ordering in polyanilines investigated 328 by saxs and afm. Journal of Colloid and Interface Science, 316, 376-387.
329 Li, E., Hasjim, J., Dhital, S., Godwin, I. D., & Gilbert, R. G. (2011). Effect of a gibberellin-biosynthesis inhibitor treatment 330 on the physicochemical properties of sorghum starch. Journal of Cereal Science, 53, 328-334.
331 Li, M., Hasjim, J., Xie, F., Halley, P. J., & Gilbert, R. G. (2014). Shear degradation of molecular, crystalline, and granular 332 structures of starch during extrusion. Starch - Stärke, 66, 595-605.
333 Li, Z. H., Gong, Y. J., Wu, D., Sun, Y. H., Wang, J., Liu, Y., & Dong, B. Z. (2001). A negative deviation from porod's law in 334 saxs of organo-msu-x. Microporous and Mesoporous Materials, 46, 75-80.
335 Liao, L., Liu, H., Liu, X., Lin, Yu, L., & Chen, P. (2014). Development of microstructures and phase transitions of starch. 336 Acta Polym Sinica, 21, 761-773.
337 Liu, H. S., Yu, L., Simon, G., Dean, K., & Chen, L. (2009). Effects of annealing on gelatinization and microstructures of 338 corn starches with different amylose/amylopectin ratios. Carbohydr Polym, 77, 662-669.
339 Liu, W.-C., Halley, P. J., & Gilbert, R. G. (2010). Mechanism of degradation of starch, a highly branched polymer, during 340 extrusion. Macromolecules, 43, 2855-2864.
341 Liu, X., Wang, T., Chow, L. C., Yang, M., & Mitchell, J. W. (2014). Effects of inorganic fillers on the thermal and 342 mechanical properties of poly (lactic acid). International Journal of Polymer Science.
343 Liu, X., Wang, Y., Yu, L., Tong, Z., Chen, L., Liu, H., & Li, X. (2013). Thermal degradation and stability of starch under 344 different processing conditions. Starch‐Stärke, 65, 48-60.
345 Lopez-Rubio, A., Flanagan, B. M., Gilbert, E. P., & Gidley, M. J. (2008). A novel approach for calculating starch 346 crystallinity and its correlation with double helix content: A combined xrd and nmr study. Biopolymers, 89, 347 761-768.
348 Pérez, S., & Bertoft, E. (2010). The molecular structures of starch components and their contribution to the architecture 349 of starch granules: A comprehensive review. Starch - Stärke, 62, 389-420.
350 Qiao, D.-l., Bao, X.-y., Liu, X.-x., Chen, L., Zhang, X.-q., & Chen, P. (2014). Preparation of cassava starch-based 351 superabsorbent polymer using a twin-roll mixer as reactor. Chinese Journal of Polymer Science, 32, 1348-1356. 352 Qiao, D., Zou, W., Liu, X., Yu, L., Chen, L., Liu, H., & Zhang, N. (2012). Starch modification using a twin‐roll mixer as a 353 reactor. Starch‐Stärke, 64, 821-825.
354 Suzuki, T., Chiba, A., & Yarno, T. (1997). Interpretation of small angle x-ray scattering from starch on the basis of 355 fractals. Carbohydrate Polymers, 34, 357-363.
356 Tester, R. F. (1997). Properties of damaged starch granules: Composition and swelling properties of maize, rice, pea and 357 potato starch fractions in water at various temperatures. Food Hydrocolloids, 11, 293-301.
358 Tran, T. T. B., Shelat, K. J., Tang, D., Li, E., Gilbert, R. G., & Hasjim, J. (2011). Milling of rice grains. The degradation on 359 three structural levels of starch in rice flour can be independently controlled during grinding. Journal of
360 Agricultural and Food Chemistry, 59, 3964-3973.
361 Vermeylen, R., Derycke, V., Delcour, J. A., Goderis, B., Reynaers, H., & Koch, M. H. J. (2006). Gelatinization of starch in 362 excess water: Beyond the melting of lamellar crystallites. A combined wide- and small-angle x-ray scattering 363 study. Biomacromolecules, 7, 2624-2630.
364 Wang, J., Yu, L., Xie, F., Chen, L., Li, X., & Liu, H. (2010). Rheological properties and phase transition of cornstarches with 365 different amylose/amylopectin ratios under shear stress. Starch - Stärke, 62, 667-675.
366 Wang, K., Hasjim, J., Wu, A. C., Henry, R. J., & Gilbert, R. G. (2014). Variation in amylose fine structure of starches from 367 different botanical sources. Journal of Agricultural and Food Chemistry, 62, 4443-4453.
368 Wu, A. C., Witt, T., & Gilbert, R. G. (2013). Characterization methods for starch-based materials: State of the art and 369 perspectives. Australian Journal of Chemistry, 66, 1550-1563.
370 Xie, F., Halley, P. J., & Avérous, L. Rheology to understand and optimize processibility, structures and properties of 371 starch polymeric materials. Progress in Polymer Science.
372 Xu, Y., Li, Z., Fan, W., Wu, D., Sun, Y., Rong, L., & Dong, B. (2004). Density fluctuation in silica–pva hybrid gels 373 determined by small-angle x-ray scattering. Applied Surface Science, 225, 116-123.
374 Xue, T., Yu, L., Xie, F. W., Chen, L., & Li, L. (2008). Rheological properties and phase transition of starch under shear 375 stress. Food Hydrocolloids, 22, 973-978.
376 Yang, L.-Y., Bigio, D., & Smith, T. G. (1995). Melt blending of linear low-density polyethylene and polystyrene in a haake 377 internal mixer. Ii. Morphology-processing relationships. Journal of Applied Polymer Science, 58, 129-141. 378 Yang, Z., Gu, Q., Lam, E., Tian, F., Chaieb, S., & Hemar, Y. (2016a). In situ study starch gelatinization under ultra-high 379 hydrostatic pressure using synchrotron saxs. Food Hydrocolloids, 56, 58-61.
380 Yang, Z., Swedlund, P., Hemar, Y., Mo, G., Wei, Y., Li, Z., & Wu, Z. (2016b). Effect of high hydrostatic pressure on the 381 supramolecular structure of corn starch with different amylose contents. International Journal of Biological
382 Macromolecules, 85, 604-614.
383 Yu, L., Dean, K., & Li, L. (2006). Polymer blends and composites from renewable resources. Progress in Polymer Science, 384 31, 576-602.
385 Zhang, B., Chen, L., Xie, F., Li, X., Truss, R. W., Halley, P. J., Shamshina, J. L., Rogers, R. D., & McNally, T. (2015). 386 Understanding the structural disorganization of starch in water-ionic liquid solutions. Physical Chemistry
387 Chemical Physics, 17, 13860-13871.
388 Zhang, J., Chen, F., Liu, F., & Wang, Z.-W. (2010). Study on structural changes of microwave heat-moisture treated 389 resistant canna edulis ker starch during digestion in vitro. Food Hydrocolloids, 24, 27-34.
390
391
392
393 Tables and Figures
394
395 Table 1 Degree of damaged starch granules (%) after kneading for different times.
396 Fig.1 Typical curve of torques vs. time measured by the Haake Rheomix mixer for G80
397 Fig. 2 SEC weight distributions of whole (fully-branched) starches after kneading for different times.
398 Fig. 3 SEC weight distributions of debranched maize starch after kneading for different times.
399 Fig. 4 Double-logarithmic SAXS patterns of corn starches after kneading for different times.
400 Fig.5 Porod SAXS patterns of corn starches after kneading for different times
401
402
Fig.1 Typical curve of torques vs. time measured by the Haake Rheomix mixer for G80
Fig. 2 SEC weight distributions of whole (fully-branched) starches after kneading for different times.
Fig. 3 SEC weight distributions of debranched maize starch after kneading for different times.
Fig.4 Double-logarithmic SAXS patterns of corn starches after kneading for different times.
Fig.5 Porod SAXS patterns of corn starches after kneading for different times
Table 1 Degree of damaged starch granules (%) after kneading for different times.
Time (min) WSC NCS G80
0 1.5±0.02 0.7±0.01 1.2±0.00
2 32.3±0.22 24.8±0.10 22.0±0.02
5 24.3±0.01 21.1±0.07 22.8±0.02
7 41.4±0.10 20.6±0.01 19.5±0.04
10 39.9±0.10 21.4±0.07 26.2±0.99
15 36.4±0.07 25.2±0.01 20.5±0.13