From altered synaptic plasticity to atypical learning: a computational model of Down 1
syndrome 2
3 4 5
Ángel Eugenio Tovar*,a, b, Gert Westermanna, Alvaro Torresb 6
7 8 9
aDepartment of Psychology, Lancaster University, Lancaster, LA1 4YF, United 10
Kingdom. 11
bFacultad de Psicología, Universidad Nacional Autónoma de México, Av. Universidad 12
3004, 04510, México. 13
14
*Correspondence should be addressed to A.E.T. eugeniot@comunidad.unam.mx 15
16 17 18 19 20
Word count (main text): 6300 21
From altered synaptic plasticity to atypical learning: a computational model of Down 1
syndrome 2
3
Abstract 4
5
Learning and memory rely on the adaptation of synaptic connections. Research on the 6
neurophysiology of Down syndrome has characterized an atypical pattern of synaptic 7
plasticity with limited long-term potentiation (LTP) and increased long-term depression 8
(LTD). Here we present a neurocomputational model that instantiates this LTP/LTD 9
imbalance to explore its impact on tasks of associative learning. In Study 1, we ran a 10
series of computational simulations to analyze the learning of simple and overlapping 11
stimulus associations in a model of Down syndrome compared with a model of typical 12
development. Learning in the Down syndrome model was slower and more susceptible 13
to interference effects. We found that interference effects could be overcome with 14
dedicated stimulation schedules. In Study 2 we ran a fourth set of simulations and an 15
empirical study with participants with Down syndrome and typically developing 16
children to test the predictions of our model. The model adequately predicted the 17
performance of the human participants in a serial reaction time task, an implicit learning 18
task that relies on associative learning mechanisms. Critically, typical and atypical 19
behavior was explained by the interactions between neural plasticity constraints and the 20
stimulation schedule. Our model provides a mechanistic account of learning 21
impairments based on these interactions, and a causal link between atypical synaptic 22
plasticity and associative learning. 23
Key words: neurocomputational model, Down syndrome, LTP/LTD balance, 24
associative learning, implicit learning, serial reaction time task. 25
1. Introduction
Down syndrome (DS) is the most common genetic cause of intellectual 1
disability with an incidence estimated along different populations between 1 in 319 and 2
1 in 1000 live births (Morris, Alberman, Mutton, & Jacobs, 2012; Wiseman, Alford, 3
Tybulewicz, & Fisher, 2009). It is caused by a total or partial trisomy of chromosome 4
21. 5
Behavioral studies have documented atypical learning, memory and language 6
acquisition in individuals with DS (Costanzo et al., 2013; Karmiloff-Smith et al., 2016; 7
Pennington, Moon, Edgin, Stedron, & Nadel, 2003; Wishart, 1993). Synaptic plasticity 8
is considered a core mechanism underlying these processes (Hofer & Bonhoeffer, 2010; 9
Neves, Cooke, & Bliss, 2008). This has led to extensive research on synaptic plasticity 10
in mouse models of DS to understand the altered neurobiological mechanisms and to 11
explore possible ways to normalize synaptic function (Andrade-Talavera, Benito, 12
Casañas, Rodríguez-Moreno, & Montesinos, 2015; Begenisic et al., 2014; Fernandez & 13
Garner, 2007; Martínez-Cué et al., 2013; Rueda, Flórez, & Martínez-Cué, 2012; Scott-14
McKean & Costa, 2011). However, the relationship between altered synaptic plasticity 15
described in animal models and behavioral deficits observed in patients is not fully 16
understood and has been minimally studied. 17
In this paper, we present a neurocomputational model of DS that is based on 18
findings about altered neuronal plasticity observed in mouse models. Our main 19
objective is to give insights into how specific and well-documented alterations in 20
synaptic plasticity affect end state processes such as learning and memory; here we 21
focus on exploring impairments in simple forms of associative learning in DS. 22
Long-term potentiation (LTP) and long-term depression (LTD), are two 23
processes suitable for studying increase and decrease, respectively, in synaptic strength 24
According to theories of synaptic plasticity (Bienenstock, Cooper, & Munro, 1982), 1
LTP occurs when presynaptic activity coincides with strong postsynaptic depolarization 2
above a threshold value. When presynaptic activity persistently fails to produce 3
depolarization in the postsynaptic neuron beyond this threshold, LTD occurs (Bear, 4
1995). 5
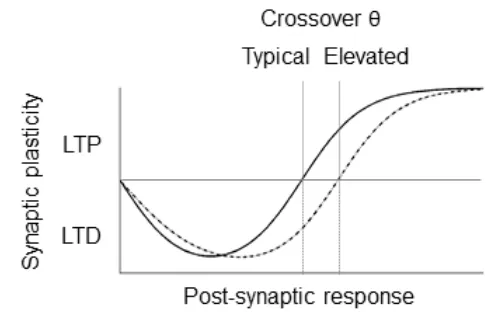
This modification threshold, or LTD/LTP crossover point, is elevated in a 6
number of animal models of intellectual disability (Meredith, Holmgren, Weidum, 7
Burnashev, & Mansvelder, 2007; Meredith & Mansvelder, 2010). A direct consequence 8
of an elevated threshold is an altered balance of brain plasticity that enhances LTD at 9
the expense of LTP (Fig. 1). Accordingly, several lines of research have consistently 10
reported increased LTD and reduced LTP in animal models of DS (Andrade-Talavera 11
et al., 2015; Begenisic et al., 2014; Kleschevnikov et al., 2004; Martínez-Cué et al., 12
2013; Siarey et al., 1999). 13
14
Fig 1 The consequence of a comparatively elevated LTD/LTP crossover threshold that
15
results in increased LTD and limited LTP in response to the same amounts of post-16
synaptic activity coincident with pre-synaptic activity. 17
18
[image:4.595.170.414.441.597.2]Ts65Dn mouse, the most used and best characterized model of DS (Davisson et al., 1
1993; Rueda et al., 2012). Particularly, in the dentate gyrus and CA1 regions LTP is 2
reduced when compared with euploid controls (Begenisic et al., 2014; Kleschevnikov 3
et al., 2004; Martínez-Cué et al., 2013; Siarey et al., 1999; Siarey, Stoll, Rapoport, & 4
Galdzicki, 1997). Furthermore, this mouse model shows increased levels of LTD (Scott-5
McKean & Costa, 2011; Siarey et al., 1999), suggesting that the atypicality in LTP 6
arises from an increased LTD/LTP crossover threshold. Convergent evidence of limited 7
LTP and/or increased LTD has been reported from three other mouse models of DS: 8
Tc1, TsiCje and Ts1Rhr (Andrade-Talavera et al., 2015; Belichenko et al., 2009; 9
O’Doherty et al., 2005; Siarey, Villar, Epstein, & Galdzicki, 2005). 10
Atypical synaptic plasticity in DS has also been described in other brain areas 11
outside the hippocampus. For example, a lack of LTP in the Ts65Dn mouse was 12
observed in the intrastriatal cholinergic system (Di Filippo et al., 2010), which is a 13
major relay of cortical information flow through the basal ganglia. 14
While mice showing altered LTD/LTP are known to also show behavioral 15
impairments (Begenisic et al., 2014; Costa, Stasko, Schmidt, & Davisson, 2010), it is 16
still unknown what are the computational properties emerging from neural networks 17
with exaggerated LTD and limited LTP, and how this atypical pattern of strengthening 18
and weakening in synaptic connections produces less efficient computations resulting in 19
impaired learning and memory. Answering this question requires an understanding of 20
the pathway from neural plasticity constraints to end-state cognitive processes in both 21
typical and atypical populations. 22
Here, in Study 1, we present a neurocomputational approach to explore how the 23
altered pattern of synaptic plasticity in DS impacts on tasks of associative learning. For 24
simulates DS (DS model), and this model is compared with one simulating typical 1
development (TD model). In a series of three simulations we evaluate learning of simple 2
(AB) and overlapping (AB and BC) stimulus associations. In Study 2, to explore the 3
predictive validity of our model, we run an additional set of simulations and an 4
empirical study with DS and TD participants. We analyze the performance of both 5
computational models and human participants in a Serial Reaction Time (SRT) task. In 6
this task, which is usually considered an implicit learning task (Vicari, Verucci, & 7
Carlesimo, 2007), associative learning is assessed through reductions in response times 8
as participants are exposed to a repeated sequence of stimuli. We have chosen this 9
experimental task because first, it provides an index of associative learning between 10
arbitrarily related stimuli (Keele, Ivry, Mayr, Hazeltine, & Heuer, 2003; Nissen & 11
Bullemer, 1987) and thus is well suited to translate predictions of associative learning 12
from our computational model to empirical tests. Second, the reviewed studies of DS 13
mouse models have stressed hippocampal and striatal dysfunction of synaptic 14
mechanisms, and recent evidence shows that these brain structures are involved in 15
learning during SRT tasks (Aizenstein et al., 2004; Doyon et al., 1997; Eichenbaum, 16
2013; Ergorul & Eichenbaum, 2006; Schendan, Searl, Melrose, & Stern, 2003). Indeed, 17
with neuroimaging techniques it has now been possible to observe engagement of the 18
hippocampus and fronto-striatal networks in both explicit and implicit learning 19
(Degonda et al., 2005; Schendan et al., 2003; Yang & Li, 2012). Finally, there are 20
previous studies reporting performance of DS participants during SRT tasks (Bussy, 21
Charrin, Brun, Curie, & des Portes, 2011; Mosse & Jarrold, 2010; Vicari, Bellucci, & 22
Carlesimo, 2000; Vicari et al., 2007) that allow us to evaluate the extent to which our 23
computational simulations and empirical results converge and extend previous findings. 24
2. Study 1: Neurocomputational Model
1
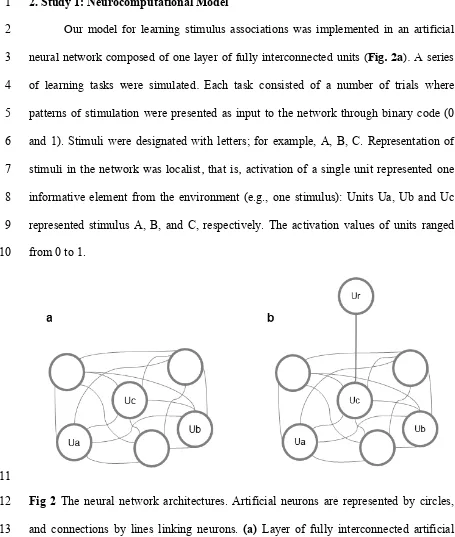
Our model for learning stimulus associations was implemented in an artificial 2
neural network composed of one layer of fully interconnected units (Fig. 2a). A series 3
of learning tasks were simulated. Each task consisted of a number of trials where 4
patterns of stimulation were presented as input to the network through binary code (0 5
and 1). Stimuli were designated with letters; for example, A, B, C. Representation of 6
stimuli in the network was localist, that is, activation of a single unit represented one 7
informative element from the environment (e.g., one stimulus): Units Ua, Ub and Uc 8
represented stimulus A, B, and C, respectively. The activation values of units ranged 9
from 0 to 1. 10
11
Fig 2 The neural network architectures. Artificial neurons are represented by circles,
12
and connections by lines linking neurons. (a) Layer of fully interconnected artificial 13
neurons used in simulations 1-3. (b) The architecture that includes Ur to simulate the 14
Serial Reaction Time task in Simulation 4. 15
16
Each connection between neurons was characterized by a weight value. To 17
[image:7.595.56.511.76.613.2]interpreted as associative strengths (AS) between stimuli. The development and 1
maintenance of AS were conceptualized as measures of learning and memory. 2
Connection weights close to 1 were interpreted as high AS between stimuli, and weights 3
close to 0 were interpreted as low AS between stimuli. 4
During each simulation, after presenting the pattern of stimulation, activation 5
propagated to the whole network through the connections. Each unit performed a 6
weighted sum of all inputs it received from the other active units, and transformed this 7
net-input into an activation/output value through a sigmoid function (Equation 1). 8
for net_input > 0, ai = 1 / 1+exp-net_input_i (1) 9
Else, ai = ai 10
where ai is the activation value of unit i 11
12
2.1. Learning algorithm 13
All connection weights between neurons (Wij) were initially set at 0 to simulate no 14
previous learning between stimuli. After presenting each stimulation pattern, Hebbian 15
modifications updated the value of Wij. Hebbian algorithms usually assume that 16
coactivation of neurons leads to proportional strengthening in their connections (Bliss, 17
Collingridge, & Morris, 2007); this formalization captures LTP (Equation 2). 18
Wij (t+1) = Wij + ß (ai*aj) (2) 19
where ai and aj are the activation values of units i and j, respectively, so that 20
coactivation equals ai*aj. Wij is the connection value between units i and j. ß is the 21
learning rate. 22
Our model included an LTD analogous adaptation as well: decays in connection 23
the notion of the LTD/LTP cross-over threshold, determined whether coactivation led to 1
strengthening or weakening of connections between co-active neurons. 2
Since a main aim of our computational implementation was to explore the 3
effects of altered LTD/LTP on basic associative learning, we kept our model as simple 4
as possible. However, more complex neurophysiological theories of synaptic plasticity, 5
captured in computational models like the BCM model (Bienenstock et al., 1982) and 6
the XCAL algorithm (O’Reilly, Wyatte, & Rohrlich, 2014), have stressed the relevance 7
of homeostatic coactivation threshold adjustments. In our model, we therefore included 8
a self-adjusting value (λ) that modulated the model’s synaptic adaptation: 9
If (ai*aj)> θ, then λ = (ai*aj) – Wij (3) 10
else λ = –Wij 11
The function of λ is to stabilize changes in Wij, prevent connections from 12
becoming too strong, and to allow for simulating metaplasticity, which involves 13
modifying the properties of synaptic plasticity in response to its adaptation history 14
(Abraham, 2008). For above-θ values, λ depends on the difference between the 15
coactivation and Wij and is computed by subtracting the current value of Wij, from the 16
current coactivation. For example, when two units ai and aj are maximally coactive (both 17
active with value 1) and the weight between them is 0, λ is 1 and allows for maximal 18
learning. As the connection weight between coactive units increases, λ gets smaller and 19
dampens weight adaptation. In cases where coactivation of two units is smaller than 20
their connection weights, or when coactivation does not reach the threshold θ, λ is 21
negative and leads to synaptic weakening. The interaction between θ and λ allows the 22
network to approach a homeostatic adjustment of synaptic weights by making changes 23
in Wij dependent on the co-occurring activation of neurons and the previous state of Wij 24
Wij (t+1) = Wij + λ ß (ai*aj) (4) 1
Changes in weights were defined by direction and magnitude. Direction 2
depended on the interaction between the levels of activation, the value of θ, and 3
previous learning history. Magnitude was determined by a rate of change parameter (ß). 4
5
2.1.1. Modeling DS 6
We modeled DS through a relatively increased coactivation threshold (TD 7
model: θ = 0.65; DS model: θ = 0.7) for connection strengthening and a lower rate of 8
change (TD model: ß = 0.25; DS model: ß = 0.2). Increasing θ in our model leads to 9
restricting gains and enhancing decays in Wij, simulating the altered LTP/LTD ratio in 10
DS. Reducing ß simulated slowness in the rate of change for DS simulations. This was 11
biologically motivated by structural abnormalities in DS neural networks with impact 12
on computing power, including reduction of synapse density, inhibitory predominance, 13
and abnormal growth of dendritic spines (Ayberk Kurt, Ilker Kafa, Dierssen, & Ceri 14
Davies, 2004; Dierssen, 2012; Dierssen et al., 2003). To provide stochasticity to our 15
model, ß fluctuated from trial to trial according to a normal distribution with µ = 0.25 16
and σ = 0.14 in TD simulations, and µ = 0.2 and σ = 0.11 in the DS simulations. We 17
decided to incorporate stochasticity to our simulations through variable learning rates 18
rather than through noise in connection weights or activation values. This was to allow 19
for transparent interpretations of learning in the model, based on observing the changes 20
in connection weights. 21
The TD and DS models were run 5 times in each simulation and the mean value 22
of AS was calculated. 23
24
To examine in principle how the development of AS between co-presented 1
stimuli is affected by the atypical parameters for connection strengthening in DS, we 2
analyzed the simplest possible scenario by stimulating the models with two stimuli, A 3
and B, simultaneously for a total of 25 repetitions (i.e., 25 AB trials). 4
5
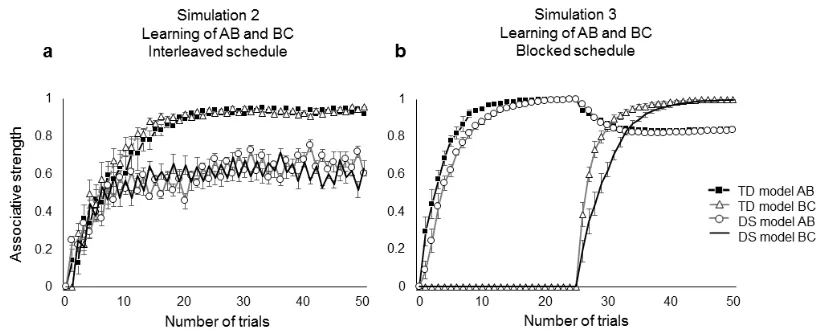
2.1.3. Simulation 2. Learning of AB and BC (interleaved schedule) 6
The second simulation presented a more demanding task requiring learning of 7
two overlapping associations, AB and BC, that share one common element (stimulus 8
B). Learning in this kind of task, usually assessed through learning (i.e., recall) of word-9
pair associates, is known to be affected by interference effects (Ellenbogen, Hulbert, 10
Stickgold, Dinges, & Thompson-Schill, 2006; O’Reilly & Munakata, 2000), resulting in 11
decays in AS of one stimulus pair (AB) after being exposed to the second stimulus pair 12
(BC). This simulation consisted of a total of 50 trials of alternating AB and BC trials. 13
14
2.1.4. Simulation 3. Learning of AB and BC (blocked schedule) 15
In Simulation 3 we analyzed the effects of a different stimulation schedule for 16
learning the two overlapping associations AB and BC. Twenty-five trials of each 17
association were presented in separate blocks instead of interleaved in one stimulation 18
block. Thus, we first presented 25 AB trials and then 25 BC trials. 19
20
2.2 Results
21
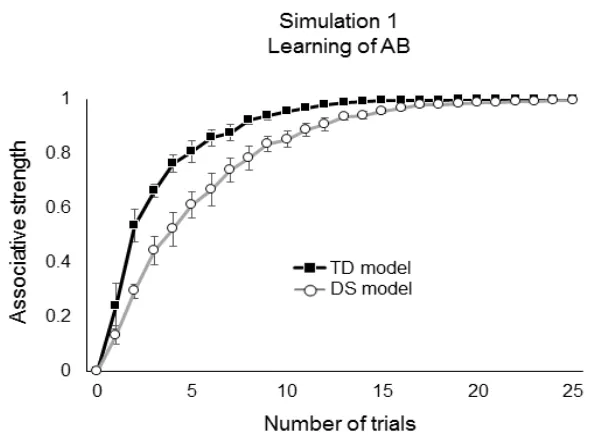
2.2.1 Simulation 1. Learning of association AB 22
Gains in AS between A and B were slower in the DS model compared with the 23
TD model (Fig. 3). The main differences occurred during the first half of the training 24
TD model, around trial 14 the AS was close to 1 while a similar value was achieved by 1
DS model only by trial 20; thereafter differences between the two models were virtually 2
undetectable. In summary, in the simplest associative learning task our computational 3
implementation describes a slower learning process in DS but that ultimately reaches 4
the same level as in TD. 5
6
Fig 3 Changes in connection weights or associative strength between A and B in the TD
7
and DS models during Simulation 1. Error bars show the standard error of the mean. 8
9
2.2.2 Simulation 2. Learning of AB and BC (interleaved schedule) 10
Unlike in the previous simulation, where AS increased after each trial, in 11
Simulation 2 we observed positive and negative changes in connection weights 12
replicating learning interference effects (Fig. 4a). Notably, the interference effect in the 13
TD model was minimal and did not preclude AS to reach values close to 1. In sharp 14
contrast, in the DS model the interference was more marked, with bigger drops in 15
connection weights that prevented a regular connection strengthening process. 16
[image:12.595.148.443.217.438.2]1
Fig 4 Changes in connection weights or associative strength in the TD and DS models
2
after (a) an interleaved presentation schedule of AB and BC trials, and (b) a blocked 3
presentation schedule of AB and BC trials. Error bars show the standard error of the 4
mean. 5
6
2.2.3 Simulation 3. Learning of AB and BC (blocked schedule) 7
The most notable difference in the results of Simulation 3 compared with 8
Simulation 2 is that the DS-Model achieved stronger and more stable AS in Simulation 9
3 (Fig. 4b). The only variation between simulations 2 and 3 was the order in which
10
trials were presented; in both tasks the overall amount of stimulation remained the 11
same. During Simulation 3 the final performance of DS was again analogous to that of 12
TD. When BC trials were introduced in training there was a decay in the AB associative 13
strength in both models. However, this decay was not catastrophic and a high AS was 14
maintained for the AB association despite this mapping being no longer presented. 15
16
2.2.4 Analysis of parameters’ effects 17
There are two changes in the learning algorithm between our DS model and TD 18
[image:13.595.87.497.73.240.2]increasing the threshold parameter θ, and decreasing the learning rate ß. Varying two 1
parameters makes it difficult to assign credit to the individual mechanistic effects of 2
each parameter. Therefore, we were interested in observing how each parameter 3
contributed to the observed effects in the atypical DS learning. Two main differences 4
were observed in our simulations; 1) learning in the DS model is slower than learning in 5
the TD model (particularly clear in simulations 1 and 3), and 2) interference effects are 6
more prevalent in DS during interleaved schedules (Simulation 2). 7
[image:14.595.72.515.319.438.2]8
Table 1 Parameters used during simulations.
9
Parameter DS model TD model Associated effects
Learning rate ß µ = 0.2, σ = 0.11 µ = 0.25, σ = 0.14 Learning is delayed with reduced ß values
Coactivation threshold
θ 0.7 0.65
Increased θ values lead to interference effects in interleaved
schedules Fixed connection
between Uc and Ur (Simulation 4 only)
2.6 3
Smaller values in this connection capture the overall slowness in
response speed in DS.
10
We compared the 4 possible combinations of the two parameters (i.e., Typical ß 11
typical θ; reduced ß typical θ; reduced ß increased θ; and typical ß increased θ), for 12
simulations 1 and 2 (Fig. 5). The delayed, but ultimately successful, learning of AB 13
associations in DS was an effect of the reduced learning rate (Fig. 5a) irrespective of the 14
setting for θ. In the learning of overlapping associations (Fig. 5b) the observed 15
interference effects were caused by the altered cross-over threshold θ, with little effect 16
of changes in learning rate. Thus, in our DS model, lowering the learning rate accounted 17
better for learning delays, while increasing the LTP/LTD threshold accounted better for 18
1
Fig 5 Changes in connection weights or associative strength between A and B, and B
2
and C in the neural network with different parameter values. The curves show the 3
development of associative strength after (a) presentation of AB trials during 4
Simulation 1, and (b) after the interleaved presentation schedule of AB and BC trials. 5
Error bars show the standard error of the mean. 6
7
2.2.5 Prediction of the Model 8
Results from simulations 2 and 3 were taken as a prediction of our 9
neurocomputational model for the learning of two overlapping associations in typical 10
and DS populations. The model predicts a series of learning outcomes for each 11
population depending on the training schedule used (interleaved trials and blocked 12
trials): an interleaved schedule should result in high AS between paired elements for 13
[image:15.595.173.389.75.220.2]DS can be overcome by using a blocked schedule in which TD and DS participants both 1
should develop high AS between paired elements. 2
3
2.3 Discussion
4
We observed that when learning one association between two elements (A and 5
B) the TD and DS models performed similarly, with delayed learning in DS. This delay 6
resulted mainly from a relatively lower learning rate which modeled structural 7
abnormalities in DS neural networks, including reduction of synapse density, inhibitory 8
predominance, and abnormal growth of dendritic spines (Ayberk Kurt et al., 2004; 9
Dierssen, 2012; Dierssen et al., 2003). 10
Learning of two overlapping associations (AB and BC) was disrupted in DS 11
under an interleaved schedule, with learning of BC interfering with the previously 12
learned relation AB. In this computational implementation, the marked learning 13
interference in DS was mainly explained by the increased value in the coactivation 14
threshold for synaptic changes that captures an increased LTD/LTP crossover point. 15
Our model provides a mechanistic explanation for this learning interference: in the 16
model, activation spreads in the network through the learned connections, allowing a 17
process of pattern completion; that is, after training trials were presented, direct 18
stimulation of one neuron (e.g., Ub) was able to recall the activation of previously co-19
active units (e.g., Ua). Then, when a BC trial is presented the activation of Ub spreads 20
to Ua, producing a coactivation between Ua and Ub that triggers the learning 21
mechanism in the model. However, spreading activation alone, without direct 22
stimulation of Ua, does not produce full activation of Ua so that the coactivation value 23
will more likely be below θ, leading to a weakening in the connection weight between 24
progressively decreasing interference effects, while in the DS model, the relatively 1
higher value of θ leads to impaired learning of AB and BC. Thus, here, atypical 2
associative learning in DS is explained directly through an altered LTP/LTD cross-over 3
threshold that has been found in mouse models of DS. 4
Based on the rationale of our mechanistic interpretation of learning interference 5
in DS, we evaluated a different stimulation schedule that minimizes interference effects 6
by means of presenting separate blocks of AB and BC trials. Under this condition, the 7
DS model improved to a level indistinguishable from the TD model. This is because in 8
the first block, connections between A and B become strong enough to sufficiently 9
activate A through spreading activation when B and C are presented in the second 10
block. This higher activation of A then protects the connection (AS) between A and B 11
from atypical weakening in the second block. 12
13
3. Study 2: Evaluation of model predictions
14
Simulations 2 and 3 of Study 1 predicted different learning trajectories for DS 15
and TD depending on the stimulation schedule. Particularly, the model predicts that the 16
use of blocked schedules leads to developing high AS in both TD and DS, while the use 17
of interleaved schedules leads to high AS in TD but low AS in DS. To test the 18
predictions of our model we ran a fourth set of simulations and a Serial Reaction Time 19
(SRT) task with human participants. 20
In a SRT task, participants see stimuli presented sequentially, and they respond 21
as fast as possible whenever they see the target stimulus (e.g., stimulus C). When the 22
target is constantly preceded by another stimulus (e.g., stimulus A), decreases in 23
response times (RTs) to the target, relatively to baseline RTs, are inversely proportional 24
predictors and order of stimulation it is possible to measure AS between two 1
overlapping associations (AC and BC) in blocked and interleaved schedules. 2
Previous studies with SRT tasks in DS individuals have converged on the 3
finding of well-preserved implicit learning during schedules that present one sequence 4
associated with one target (Mosse & Jarrold, 2010; Vicari et al., 2000, 2007). However, 5
there are no previous reports of learning two overlapping associations using SRT tasks 6
in DS. 7
8
3.2 Methods 9
3.2.1 Model extension 10
We modeled an SRT task in which C was the target stimulus. In order to 11
simulate RTs, a new accumulator unit Ur was added to the model (Fig. 2b). As in 12
previous computational models simulating RTs (Usher & McClelland, 2001), Ur 13
accumulated information over time about the presence of the target stimulus C. When 14
the input to Ur surpassed a threshold, Ur became active, and this moment was registered 15
as the RT of the model. 16
There were two sources of input for Ur. One was the activation of Uc, 17
representing direct stimulation of target C, and the second was the associative 18
connection between A and C, or B and C. This mechanism captured the modulatory role 19
of AS on RTs. Ur collected information according to Equation 4. 20
(4) dUr = [IUr + learn.Ur] dt + εUr √dt 21
Where dUr is the change in activation of Ur during each time interval dt. Time 22
intervals corresponded to 0.0125 seconds. Thus, activation of Ur was updated 80 times 23
per second. εUr is a Gaussian noise term with zero mean and variance σ2. This parameter 24
theories of response times (Smith, 1995; Usher & McClelland, 2001). Changes in Ur 1
were driven by information from Uc activation (IUr), and by the AS between Uc and the 2
previously active unit, either Ua or Ub (learn.Ur). IUr depended on the output from Uc 3
weighted by the connection between Uc and Ur; for this connection, we used fixed 4
values of 2.6 for DS simulations and 3 for TD simulations. These values were 5
empirically motivated by evidence that shows slower reaction times in DS participants 6
compared to TD controls in SRT (Vicari et al., 2000). For each simulation, the 7
activation value of Ur started at 0. During each time interval Ur collected information 8
and responded every time a threshold of 1.65 was surpassed. We ran five DS 9
simulations and five TD simulations. 10
11
3.2.1.1 Simulation 4. Serial Reaction Time task 12
During simulation of the SRT the elements A, B and C were not presented at the 13
same time but sequentially. To capture this characteristic of SRT, activation of Ua, Ub 14
and Uc decayed from 1 to 0.9 every time that an element was removed and another 15
element was presented to the network. 16
We programed 8 experimental phases. Phases 1 and 8 were used to measure 17
baseline RTs (i.e., the time between the presentation of C and the activation of Ur, when 18
C is not presented in a fixed sequence). Phases 2 to 7 were used to infer AS between AC 19
and BC by means of presenting sequences of stimulation where C was always preceded 20
by either stimulus A (AC trial) or stimulus B (BC trial). For the interleaved schedule, a 21
total of 48 AC and 48 BC trials were interleaved from Phase 2 to 7. For the blocked 22
schedule the 48 AC trials were presented during phases 2, 3 and 4, and the 48 BC trials 23
Significant decreases in RTs during fixed sequences (phases 2 to 7) relative to 1
baseline RTs (phases 1 and 8) were taken as evidence of learned associations between 2
the predictors (A or B) and the target (C). 3
4
3.2.2 Empirical study 5
3.2.2.1 Participants 6
Our empirical study was prepared in accordance with the APA’s Ethical 7
Principles of Psychologists and Code of Conduct, and approved by the Ethics 8
Committee of the School of Psychology at the National Autonomous University of 9
Mexico. Informed consent was obtained from the parents of all the participants, who 10
also gave assent before taking part in the study. Five individuals diagnosed with DS (2 11
females) were recruited from a center of education for people with learning disabilities. 12
The mean chronological age of DS participants was 18.04 years with SD = of 3.25 and 13
an age range between 12.8 and 21.5 years. In order to compare the performance of 14
individuals with a similar level of cognitive development, the mental age of the DS 15
group was estimated using an abbreviated form of the Wechsler Intelligence Scale for 16
Children (WISC-IV) that included the subtests Block Design, Matrix Reasoning and 17
Figure Completion. This short form is among the ten most recommended versions with 18
high reliability (0.93) and validity (0.83) values (Sattler, 2010). Five TD children (3 19
females) without diagnosis of intellectual disability were recruited from their 20
elementary school, with a chronological age (M = 6.5, SD = 0.31, age range 6.2-6.9 21
years) that matched the mental age of DS participants (M = 6.2 years, SD = 0.04, mental 22
age range 6.1-6.2 years). 23
24
TD and DS participants were tested in a SRT task designed to match the trials 1
and phases from our computational simulation of SRT. Two experimental sessions were 2
conducted on different days. The interleaved schedule was applied during one session 3
and the blocked schedule during the other session. The order in which protocols were 4
applied was counterbalanced. 5
During each session participants sat in front of a computer screen (23 inches) 6
and a keyboard. The experimenter gave the following instruction to participants: “We 7
will play a computer game. You will see different images on the screen. Press the space 8
bar as fast as possible every time you see SpongeBobTM”. An image of SpongeBobTM 9
was shown on the screen to participants to make sure they recognized the character and 10
then the experimental task started. One sequence of images was used as the element A, 11
another sequence as the element B, and SpongeBobTM image as element C (Fig. 6). 12
13
14
Fig 6 Images used for the Serial Reaction Time task. Circles were presented in the color
15
indicated by the labels. SpongeBobTM was presented in its original color. 16
Note: * The assignment of images in sequences A and B to the interleaved and blocked 17
schedules was counterbalanced. 18
19
Each experimental session was divided into 8 phases. We obtained baseline RTs 20
[image:21.595.54.516.45.838.2]target was unpredictable. During phases 2 to 7 the images were always presented in one 1
of two possible fixed sequences. One sequence (A) followed by the target C (AC trial), 2
and another sequence (B) followed by the target C (BC trial). AC and BC trials were 3
presented in blocked and interleaved schedules, depending on the experimental session, 4
from phases 2 to 7 as in the computational simulation. Each image was presented a total 5
of 16 times per phase. Each image was presented for 1 s and the inter-image interval 6
was 0.8 s. In both sessions participants took a short break between phases 4 and 5. 7
8
3.2.3 Statistical analysis 9
During the fourth set of simulations and the empirical study we had a total of 10
eight experimental conditions, resulting from applying the interleaved and blocked 11
schedules to DS and TD populations in the computer models and the human 12
participants. Each of these conditions was analyzed separately to search for evidence of 13
learning through significant decreases in RTs during phases 2 to 7 relative to phases 1 14
and 8. 15
Each condition included 8 experimental phases; each phase presented 16 times 16
the target stimulus. We obtained the mean RTs to the target for each trial across the five 17
participants or runs of the computational models. The mean RTs were treated as 18
repeated measures across the 8 experimental phases and analyzed through repeated-19
measures ANOVA. Where we found a main effect of the experimental phase we 20
analyzed pairwise differences among phases with the Bonferroni method. Those 21
comparisons with p-values lower than 0.05 were considered statistically significant. 22
23
3.3 Results
24
Significant decreases in RTs during phases 2 to 7 (interleaved or blocked 1
sequences) compared with phases 1 and 8 (baseline RTs) where taken as evidence of 2
learning the AC and BC associations. U-shaped curves can be observed in those 3
conditions where learning took place (Fig. 7). A repeated-measures ANOVA, for each 4
computational model in each training schedule, revealed the establishment of 5
associative learning in both schedules presented to the TD model (Table 2). For the DS 6
model, learning only occurred after the blocked schedule. We found no evidence of 7
learning during the interleaved schedule in the DS simulation. This pattern of results 8
was used as a prediction of performance by TD and DS participants in the SRT task. 9
10 11
Fig 7 Mean reaction times during the Serial Reaction Time task. Error bars show the
12
standard error of the mean. 13
14
3.3.2 Empirical study. 15
The mean RTs of the TD and DS participants replicated the pattern of our 16
simulation results (Fig. 7). Differences in RTs between baseline phases and phases with 17
[image:23.595.151.442.323.529.2]revealed learning of AC and BC associations in TD participants in both the interleaved 1
and the blocked schedule (Table 2). Meanwhile, DS participants showed evidence of 2
learning AC and BC during the blocked schedule, but not during the interleaved 3
schedule, as predicted by our model. The model also captured the result that responses 4
of DS participants overall were slower in comparison to TD. Thus, the model accounted 5
for the human data both qualitatively and quantitatively. 6
7
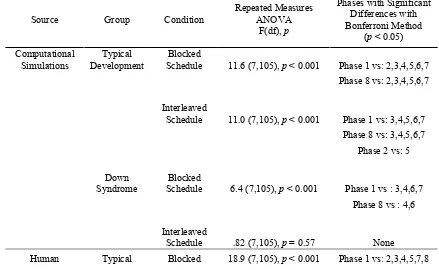
Table 2 Summary of statistical analysis for the serial reaction time task. The final
8
column provides the experimental phases in which reaction times differed significantly 9
(Bonferroni test). Significant differences were mostly observed between Phase 1 and 10
Phases 2 to 7, and between Phase 8 and Phases 2 to 7. Additionally, there is a 11
significant difference between Phases 2 and 5 in the computational simulation of TD 12
under the interleaved schedule. This difference shows that under this schedule there are 13
small gains in learning during the initial phases, but these gains accumulate across 14
phases to produce notable reductions in response times during the final phases. 15
Source Group Condition
Repeated Measures ANOVA
F(df), p
Phases with Significant Differences with Bonferroni Method
(p < 0.05) Computational
Simulations
Typical Development
Blocked
Schedule 11.6 (7,105), p < 0.001 Phase 1 vs: 2,3,4,5,6,7 Phase 8 vs: 2,3,4,5,6,7
Interleaved
Schedule 11.0 (7,105), p < 0.001 Phase 1 vs: 3,4,5,6,7 Phase 8 vs: 3,4,5,6,7
Phase 2 vs: 5
Down Syndrome
Blocked
Schedule 6.4 (7,105), p < 0.001 Phase 1 vs : 3,4,6,7 Phase 8 vs : 4,6
Interleaved
[image:24.595.76.515.506.776.2]Participants Development Schedule
Phase 8 vs:1,2,3,4,5,6,7
Interleaved
Schedule 9.5 (7,105), p < 0.001 Phase 1 vs: 5,6,7 Phase 8 vs: 2,3,4,5,6,7
Down Syndrome
Blocked
Schedule 9.7 (7,105), p < 0.001 Phase 1 vs: 3,4,5,6,7 Phase 8 vs: 3,4,5,6,7
Interleaved
Schedule 1.7 (7,105), p = 0.11 None
3.3.3 Individual differences in the SRT task 1
Due to the small sample size of our empirical study, we were interested in 2
analyzing to what extent the performance of each participant matched our 3
computational predictions. To do so we analyzed learning through the same repeated-4
measures ANOVA approach, but instead of using the mean RTs across participants for 5
each trial, we analyzed mean RTs across the 16 trials in each of the 8 phases for each 6
participant. Since the 5 TD and 5 DS participants were individually analyzed for the 7
interleaved and blocked schedules (i.e., 10 participants in 2 conditions), this resulted in 8
20 new analyses. 9
The computational simulations predicted learning of the sequences in both 10
schedules for TD participants, and learning of the sequences in DS participants during 11
the blocked schedule, but not during the interleaved schedule. The predictions were 12
confirmed in 17 of the 20 cases. Three outlier cases were: DS Participant 4 who showed 13
evidence of learning in one experimental phase of the interleaved schedule, DS 14
Participant 2 who did not show learning in the blocked schedule, and TD Participant 4 15
who did not show learning in the blocked schedule. 16
3.4. Discussion
1
We designed an empirical study and a fourth set of simulations to test 2
predictions of the TD and DS models. We evaluated learning of AC and BC 3
associations in DS and TD participants with an interleaved and a blocked schedule in a 4
SRT task. The participants performed as predicted by our model. The group of TD 5
participants showed learning in both schedules, and the group of DS participants learned 6
only under the blocked schedule. Remarkably, although the overall number of trials 7
between the blocked and interleaved presentation schedules remained the same, the two 8
protocols resulted in significantly different outcomes in DS participants, and this 9
outcome was predicted by the model. 10
Due to the small number of participants in our empirical study, special caution 11
should be taken when generalizing our set of results. The present data stresses a 12
difficulty to learn overlapping associations in interleaved schedules by DS participants. 13
Nonetheless, one participant with DS did show evidence of learning in the last phase of 14
interleaved sequences. Notwithstanding the number of participants tested, our empirical 15
study replicates previous findings of learning in SRT tasks by DS participants, by 16
showing well preserved abilities when the procedure requires learning of only one 17
sequence at a time (i.e., blocked schedules; Mosse & Jarrold, 2010; Stefano Vicari 18
et al., 2000, 2007). 19
To our knowledge, only one study has reported interference effects in a SRT 20
task in DS participants (Bussy et al., 2011); however, in this study interference resulted 21
from interleaving the target sequence with baseline random phases, and learning was 22
documented during the first presentations of the target sequence. Our study is the first 23
one to compare, in a SRT task, the effects of two schedules; blocked and interleaved, for 24
1
4. General Discussion
2
We explored, with a computational model, the link between altered synaptic 3
plasticity in Down syndrome and atypicalities in associative learning tasks. This model 4
was motivated by reports of increased LTD and decreased LTP found in animal models 5
of DS (Andrade-Talavera et al., 2015; Begenisic et al., 2014; Belichenko et al., 2009; 6
Kleschevnikov et al., 2004; Martínez-Cué et al., 2013; O’Doherty et al., 2005; Scott-7
McKean & Costa, 2011; Siarey et al., 1999, 1997, 2005). While an atypical LTD/LTP 8
balance has been correlated with cognitive and behavioral impairments, here we 9
explored a causal link from neurophysiological mechanisms to cognitive functions, 10
through neurocomputational modeling. 11
The learning process described by our model of DS varied from being delayed to 12
showing qualitatively different learning trajectories when compared with our model of 13
TD. Differences in learning between the simulated populations did not only depend on 14
the intrinsic properties of their learning mechanisms, but also on their interaction with 15
the environmental regularities and learning history, in this case, the sequence in which 16
stimulation was presented. As an implication for the conceptualization of intellectual 17
disability and cognitive development, this work is in accordance with developmental 18
approaches, since it highlights the interaction between learning mechanisms, biological 19
constraints and experience with the environment in shaping the learning trajectory 20
(Karmiloff-Smith, 1998; Mareschal et al., 2007; Westermann et al., 2007). 21
Our computational implementation shows that altered synaptic properties in DS 22
make it more difficult to learn and maintain information about stimulus regularities as 23
the complexity of the environment increases. While here we have focused on simple 24
atypicalities in domains where individuals with DS face more complex stimulation 1
regularities, as in the case of word learning. It has been argued that early word learning 2
relies on associative learning (McMurray, Horst, & Samuelson, 2012), and on this view, 3
difficulty in this domain in DS could be explained on the same basis as our results 4
presented here. 5
Our model also predicted correctly that adapting the learning schedule can 6
overcome some of the learning atypicalities observed in DS. This prediction was 7
confirmed in an empirical study evaluating performance in a SRT task. Our study is the 8
first one to analyze selective impairments in DS during this implicit learning task, and it 9
suggests that implicit learning in DS is susceptible to interference effects and selection 10
of the training schedule. We consider this finding as an important contribution for future 11
research on the design of behavioral interventions. Implicit learning has traditionally 12
been regarded as relatively well preserved in DS (Dierssen, 2012; Mosse & Jarrold, 13
2010; Vicari et al., 2007); however, our study stresses a sensitivity to interference 14
effects and supports the notion that teaching strategies should not only focus on 15
increasing the amount of stimulation and skills, but also make sure that previous skills 16
are well consolidated (Wishart, 1993). Our computational model also provides a tool to 17
explore what aspects of associative learning would benefit from pharmacological 18
therapies intended to normalize synaptic plasticity (Begenisic et al., 2014; Martínez-Cué 19
et al., 2013). 20
21
5. Conclusion
22
We have presented a neurocomputational model that provides a mechanistic 23
account of how increased LTD and limited LTP in Down syndrome have disruptive 24
making it more difficult to acquire and maintain information about stimulation 1
regularities. Our model suggests that, by using dedicated training schedules in these 2
kinds of learning tasks, individuals with DS nevertheless have the potential to establish 3
functional neural networks that can support information processing similar to that 4
observed in TD. Our model provides an integrative approach situated at the intersection 5
of research with mouse models and behavioral descriptions of intellectual disability. It 6
also has potential extensions for studying cognitive impairments in populations where 7
similar abnormalities in LTD/LTP are presumed from research with animal models, as 8
is the case in Fragile X syndrome and autism (Ebert & Greenberg, 2013; Huber, 9
Gallagher, Warren, & Bear, 2002; Meredith et al., 2007), Angelman syndrome (Jiang 10
et al., 1998), and Alzheimer’s disease (Moreno-Castilla et al., 2016). 11
12
6. Acknowledgments
13
This work was supported by a grant from UNAM (DGAPA-PAPIIT-IN304413). 14
The first author was supported by Secretaría de Ciencia, Tecnología e Innovación de la 15
Ciudad de México. We thank Fundación CTDUCA, teacher Blanca Aguilar, the 16
children and families who participated in the experimental study. 17
18 19 20 21
References
22
Abraham, W. C. (2008). Metaplasticity: tuning synapses and networks for plasticity. 23
Aizenstein, H. J., Stenger, V. A., Cochran, J., Clark, K., Johnson, M., Nebes, R. D., & 1
Carter, C. S. (2004). Regional brain activation during concurrent implicit and 2
explicit sequence learning. Cerebral Cortex (New York, N.Y.: 1991), 14(2), 199– 3
208. 4
Andrade-Talavera, Y., Benito, I., Casañas, J. J., Rodríguez-Moreno, A., & Montesinos, 5
M. L. (2015). Rapamycin restores BDNF-LTP and the persistence of long-term 6
memory in a model of Down’s syndrome. Neurobiology of Disease, 82, 516– 7
525. https://doi.org/10.1016/j.nbd.2015.09.005 8
Ayberk Kurt, M., Ilker Kafa, M., Dierssen, M., & Ceri Davies, D. (2004). Deficits of 9
neuronal density in CA1 and synaptic density in the dentate gyrus, CA3 and 10
CA1, in a mouse model of Down syndrome. Brain Research, 1022(1–2), 101– 11
109. https://doi.org/10.1016/j.brainres.2004.06.075 12
Bear, M. F. (1995). Mechanism for a sliding synaptic modification threshold. Neuron, 13
15(1), 1–4. 14
Begenisic, T., Baroncelli, L., Sansevero, G., Milanese, M., Bonifacino, T., Bonanno, G., 15
… Sale, A. (2014). Fluoxetine in adulthood normalizes GABA release and 16
rescues hippocampal synaptic plasticity and spatial memory in a mouse model of 17
Down Syndrome. Neurobiology of Disease, 63, 12–19. 18
https://doi.org/10.1016/j.nbd.2013.11.010 19
Belichenko, N. P., Belichenko, P. V., Kleschevnikov, A. M., Salehi, A., Reeves, R. H., 20
& Mobley, W. C. (2009). The “Down syndrome critical region” is sufficient in 21
the mouse model to confer behavioral, neurophysiological, and synaptic 22
phenotypes characteristic of Down syndrome. The Journal of Neuroscience: The 23
Official Journal of the Society for Neuroscience, 29(18), 5938–5948. 24
Bienenstock, E. L., Cooper, L. N., & Munro, P. W. (1982). Theory for the development 1
of neuron selectivity: orientation specificity and binocular interaction in visual 2
cortex. The Journal of Neuroscience: The Official Journal of the Society for 3
Neuroscience, 2(1), 32–48. 4
Bliss, T. V. P., Collingridge, G. L., & Morris, R. G. M. (2007). Synaptic plasticity in the 5
hippocampus. En P. Andersen, R. G. M. Morris, D. G. Amaral, T. V. P. Bliss, & 6
J. O’Keefe (Eds.), The Hippocampus Book (pp. 343–474). New York: Oxford 7
University Press. 8
Bussy, G., Charrin, E., Brun, A., Curie, A., & des Portes, V. (2011). Implicit procedural 9
learning in fragile X and Down syndrome. Journal of Intellectual Disability 10
Research, 55(5), 521–528. https://doi.org/10.1111/j.1365-2788.2011.01410.x 11
Costa, A. C. S., Stasko, M. R., Schmidt, C., & Davisson, M. T. (2010). Behavioral 12
validation of the Ts65Dn mouse model for Down syndrome of a genetic 13
background free of the retinal degeneration mutation Pde6b(rd1). Behavioural 14
Brain Research, 206(1), 52–62. https://doi.org/10.1016/j.bbr.2009.08.034 15
Costanzo, F., Varuzza, C., Menghini, D., Addona, F., Gianesini, T., & Vicari, S. (2013). 16
Executive functions in intellectual disabilities: a comparison between Williams 17
syndrome and Down syndrome. Research in Developmental Disabilities, 34(5), 18
1770–1780. https://doi.org/10.1016/j.ridd.2013.01.024 19
Davisson, M. T., Schmidt, C., Reeves, R. H., Irving, N. G., Akeson, E. C., Harris, B. S., 20
& Bronson, R. T. (1993). Segmental trisomy as a mouse model for Down 21
syndrome. Progress in Clinical and Biological Research, 384, 117–133. 22
Degonda, N., Mondadori, C. R. A., Bosshardt, S., Schmidt, C. F., Boesiger, P., Nitsch, 23
hippocampus and interacts with explicit associative learning. Neuron, 46(3), 1
505–520. https://doi.org/10.1016/j.neuron.2005.02.030 2
Dierssen, M. (2012). Down syndrome: the brain in trisomic mode. Nature Reviews. 3
Neuroscience, 13(12), 844–858. https://doi.org/10.1038/nrn3314 4
Dierssen, M., Benavides-Piccione, R., Martínez-Cué, C., Estivill, X., Flórez, J., Elston, 5
G. N., & DeFelipe, J. (2003). Alterations of neocortical pyramidal cell 6
phenotype in the Ts65Dn mouse model of Down syndrome: effects of 7
environmental enrichment. Cerebral Cortex (New York, N.Y.: 1991), 13(7), 758– 8
764. 9
Di Filippo, M., Tozzi, A., Ghiglieri, V., Picconi, B., Costa, C., Cipriani, S., … 10
Calabresi, P. (2010). Impaired plasticity at specific subset of striatal synapses in 11
the Ts65Dn mouse model of Down syndrome. Biological Psychiatry, 67(7), 12
666–671. https://doi.org/10.1016/j.biopsych.2009.08.018 13
Doyon, J., Gaudreau, D., Laforce, R., Castonguay, M., Bédard, P. J., Bédard, F., & 14
Bouchard, J. P. (1997). Role of the striatum, cerebellum, and frontal lobes in the 15
learning of a visuomotor sequence. Brain and Cognition, 34(2), 218–245. 16
Ebert, D. H., & Greenberg, M. E. (2013). Activity-dependent neuronal signalling and 17
autism spectrum disorder. Nature, 493(7432), 327–337. 18
https://doi.org/10.1038/nature11860 19
Eichenbaum, H. (2013). Memory on time. Trends in cognitive sciences, 17(2), 81–88. 20
https://doi.org/10.1016/j.tics.2012.12.007 21
Ellenbogen, J. M., Hulbert, J. C., Stickgold, R., Dinges, D. F., & Thompson-Schill, S. 22
L. (2006). Interfering with Theories of Sleep and Memory: Sleep, Declarative 23
Memory, and Associative Interference. Current Biology, 16(13), 1290–1294. 24
Ergorul, C., & Eichenbaum, H. (2006). Essential role of the hippocampal formation in 1
rapid learning of higher-order sequential associations. The Journal of 2
Neuroscience: The Official Journal of the Society for Neuroscience, 26(15), 3
4111–4117. https://doi.org/10.1523/JNEUROSCI.0441-06.2006 4
Fernandez, F., & Garner, C. C. (2007). Over-inhibition: a model for developmental 5
intellectual disability. Trends in Neurosciences, 30(10), 497–503. 6
https://doi.org/10.1016/j.tins.2007.07.005 7
Hofer, S. B., & Bonhoeffer, T. (2010). Dendritic Spines: The Stuff That Memories Are 8
Made Of? Current Biology, 20(4), R157–R159. 9
https://doi.org/10.1016/j.cub.2009.12.040 10
Huber, K. M., Gallagher, S. M., Warren, S. T., & Bear, M. F. (2002). Altered synaptic 11
plasticity in a mouse model of fragile X mental retardation. Proceedings of the 12
National Academy of Sciences of the United States of America, 99(11), 7746– 13
7750. https://doi.org/10.1073/pnas.122205699 14
Jiang, Y. H., Armstrong, D., Albrecht, U., Atkins, C. M., Noebels, J. L., Eichele, G., … 15
Beaudet, A. L. (1998). Mutation of the Angelman ubiquitin ligase in mice 16
causes increased cytoplasmic p53 and deficits of contextual learning and long-17
term potentiation. Neuron, 21(4), 799–811. 18
Karmiloff-Smith, A. (1998). Development itself is the key to understanding 19
developmental disorders. Trends in Cognitive Sciences, 2(10), 389–398. 20
https://doi.org/10.1016/S1364-6613(98)01230-3 21
Karmiloff-Smith, A., Al-Janabi, T., D’Souza, H., Groet, J., Massand, E., Mok, K., … 22
Strydom, A. (2016). The importance of understanding individual differences in 23
Down syndrome. F1000Research, 5. 24
Keele, S. W., Ivry, R., Mayr, U., Hazeltine, E., & Heuer, H. (2003). The cognitive and 1
neural architecture of sequence representation. Psychological Review, 110(2), 2
316–339. https://doi.org/10.1037/0033-295X.110.2.316 3
Kleschevnikov, A. M., Belichenko, P. V., Villar, A. J., Epstein, C. J., Malenka, R. C., & 4
Mobley, W. C. (2004). Hippocampal long-term potentiation suppressed by 5
increased inhibition in the Ts65Dn mouse, a genetic model of Down syndrome. 6
The Journal of Neuroscience: The Official Journal of the Society for 7
Neuroscience, 24(37), 8153–8160. https://doi.org/10.1523/JNEUROSCI.1766-8
04.2004 9
Lüscher, C., & Malenka, R. C. (2012). NMDA receptor-dependent long-term 10
potentiation and long-term depression (LTP/LTD). Cold Spring Harbor 11
Perspectives in Biology, 4(6), a005710. 12
https://doi.org/10.1101/cshperspect.a005710 13
Malenka, R. C., & Bear, M. F. (2004). LTP and LTD: an embarrassment of riches. 14
Neuron, 44(1), 5–21. https://doi.org/10.1016/j.neuron.2004.09.012 15
Mareschal, D., Johnson, M. H., Sirois, S., Spratling, M., Thomas, M. S. C., & 16
Westermann, G. (2007). Neuroconstructivism: Volume 1: How the Brain 17
Constructs Cognition. UK: Oxford University Press. 18
Martínez-Cué, C., Martínez, P., Rueda, N., Vidal, R., García, S., Vidal, V., … 19
Hernández, M.-C. (2013). Reducing GABAA α5 receptor-mediated inhibition 20
rescues functional and neuromorphological deficits in a mouse model of down 21
syndrome. The Journal of Neuroscience: The Official Journal of the Society for 22
Neuroscience, 33(9), 3953–3966. https://doi.org/10.1523/JNEUROSCI.1203-23
McMurray, B., Horst, J. S., & Samuelson, L. K. (2012). Word learning emerges from 1
the interaction of online referent selection and slow associative learning. 2
Psychological Review, 119(4), 831–877. https://doi.org/10.1037/a0029872 3
Meredith, R. M., Holmgren, C. D., Weidum, M., Burnashev, N., & Mansvelder, H. D. 4
(2007). Increased threshold for spike-timing-dependent plasticity is caused by 5
unreliable calcium signaling in mice lacking fragile X gene FMR1. Neuron, 6
54(4), 627–638. https://doi.org/10.1016/j.neuron.2007.04.028 7
Meredith, R. M., & Mansvelder, H. D. (2010). STDP and mental retardation: 8
dysregulation of dendritic excitability in Fragile X syndrome. Frontiers in 9
Synaptic Neuroscience, 2. https://doi.org/10.3389/fnsyn.2010.00010 10
Moreno-Castilla, P., Rodriguez-Duran, L. F., Guzman-Ramos, K., Barcenas-Femat, A., 11
Escobar, M. L., & Bermudez-Rattoni, F. (2016). Dopaminergic 12
neurotransmission dysfunction induced by amyloid-β transforms cortical long-13
term potentiation into long-term depression and produces memory impairment. 14
Neurobiology of Aging, 41, 187–199. 15
https://doi.org/10.1016/j.neurobiolaging.2016.02.021 16
Morris, J. K., Alberman, E., Mutton, D., & Jacobs, P. (2012). Cytogenetic and 17
epidemiological findings in Down syndrome: England and Wales 1989–2009. 18
American Journal of Medical Genetics Part A, 158A(5), 1151–1157. 19
https://doi.org/10.1002/ajmg.a.35248 20
Mosse, E. K., & Jarrold, C. (2010). Searching for the Hebb effect in Down syndrome: 21
evidence for a dissociation between verbal short-term memory and domain-22
general learning of serial order. Journal of Intellectual Disability Research, 23
Neves, G., Cooke, S. F., & Bliss, T. V. P. (2008). Synaptic plasticity, memory and the 1
hippocampus: a neural network approach to causality. Nature Reviews. 2
Neuroscience, 9(1), 65–75. 3
https://doi.org/http://dx.doi.org.ezproxy.lancs.ac.uk/10.1038/nrn2303 4
Nissen, M. J., & Bullemer, P. (1987). Attentional requirements of learning: Evidence 5
from performance measures. Cognitive Psychology, 19(1), 1–32. 6
https://doi.org/10.1016/0010-0285(87)90002-8 7
O’Doherty, A., Ruf, S., Mulligan, C., Hildreth, V., Errington, M. L., Cooke, S., … 8
Fisher, E. M. C. (2005). An aneuploid mouse strain carrying human 9
chromosome 21 with Down syndrome phenotypes. Science, 309(5743), 2033– 10
2037. https://doi.org/10.1126/science.1114535 11
O’Reilly, R. C., & Munakata, Y. (2000). Computational Explorations in Cognitive 12
Neuroscience: Understanding the Mind by Simulating the Brain (1 edition). 13
Cambridge, Mass: MIT Press. 14
O’Reilly, R. C., Wyatte, D., & Rohrlich, J. (2014). Learning Through Time in the 15
Thalamocortical Loops. arXiv:1407.3432 [q-bio]. Recuperado a partir de 16
http://arxiv.org/abs/1407.3432 17
Pennington, B. F., Moon, J., Edgin, J., Stedron, J., & Nadel, L. (2003). The 18
neuropsychology of Down syndrome: evidence for hippocampal dysfunction. 19
Child Development, 74(1), 75–93. 20
Rueda, N., Flórez, J., & Martínez-Cué, C. (2012). Mouse models of Down syndrome as 21
a tool to unravel the causes of mental disabilities. Neural Plasticity, 2012, 22
584071. https://doi.org/10.1155/2012/584071 23
Sattler, J. M. (2010). Evaluación infantil: Fundamentos cognitivos. (Fifth edition). 24
Schendan, H. E., Searl, M. M., Melrose, R. J., & Stern, C. E. (2003). An FMRI study of 1
the role of the medial temporal lobe in implicit and explicit sequence learning. 2
Neuron, 37(6), 1013–1025. 3
Scott-McKean, J. J., & Costa, A. C. S. (2011). Exaggerated NMDA mediated LTD in a 4
mouse model of Down syndrome and pharmacological rescuing by memantine. 5
Learning & Memory, 18(12), 774–778. https://doi.org/10.1101/lm.024182.111 6
Siarey, R. J., Carlson, E. J., Epstein, C. J., Balbo, A., Rapoport, S. I., & Galdzicki, Z. 7
(1999). Increased synaptic depression in the Ts65Dn mouse, a model for mental 8
retardation in Down syndrome. Neuropharmacology, 38(12), 1917–1920. 9
https://doi.org/10.1016/S0028-3908(99)00083-0 10
Siarey, R. J., Stoll, J., Rapoport, S. I., & Galdzicki, Z. (1997). Altered long-term 11
potentiation in the young and old Ts65Dn mouse, a model for down syndrome. 12
Neuropharmacology, 36(11–12), 1549–1554. https://doi.org/10.1016/S0028-13
3908(97)00157-3 14
Siarey, R. J., Villar, A. J., Epstein, C. J., & Galdzicki, Z. (2005). Abnormal synaptic 15
plasticity in the Ts1Cje segmental trisomy 16 mouse model of Down syndrome. 16
Neuropharmacology, 49(1), 122–128. 17
https://doi.org/10.1016/j.neuropharm.2005.02.012 18
Smith, P. L. (1995). Psychophysically principled models of visual simple reaction time. 19
Psychological Review, 102(3), 567–593. https://doi.org/10.1037/0033-20
295X.102.3.567 21
Usher, M., & McClelland, J. L. (2001). The time course of perceptual choice: the leaky, 22
Vicari, S., Bellucci, S., & Carlesimo, G. A. (2000). Implicit and explicit memory: a 1
functional dissociation in persons with Down syndrome. Neuropsychologia, 2
38(3), 240–251. 3
Vicari, S., Verucci, L., & Carlesimo, G. A. (2007). Implicit memory is independent 4
from IQ and age but not from etiology: evidence from Down and Williams 5
syndromes. Journal of Intellectual Disability Research: JIDR, 51(Pt 12), 932– 6
941. https://doi.org/10.1111/j.1365-2788.2007.01003.x 7
Westermann, G., Mareschal, D., Johnson, M. H., Sirois, S., Spratling, M. W., & 8
Thomas, M. S. C. (2007). Neuroconstructivism. Developmental Science, 10(1), 9
75–83. https://doi.org/10.1111/j.1467-7687.2007.00567.x 10
Wiseman, F. K., Alford, K. A., Tybulewicz, V. L. J., & Fisher, E. M. C. (2009). Down 11
syndrome—recent progress and future prospects. Human Molecular Genetics, 12
18(R1), R75–R83. https://doi.org/10.1093/hmg/ddp010 13
Wishart, J. G. (1993). The development of learning difficulties in children with Down’s 14
syndrome. Journal of Intellectual Disability Research: JIDR, 37 ( Pt 4), 389– 15
403. 16
Yang, J., & Li, P. (2012). Brain networks of explicit and implicit learning. PloS One, 17
7(8), e42993. https://doi.org/10.1371/journal.pone.0042993 18