Physiology with Slip-Ring CT
Leena M. Hamberg, George J. Hunter, Elkan F. Halpern, Bernard Hoop, G. Scott Gazelle, and Gerald L. Wolf
PURPOSE: To implement and validate spiral slip-ring CT for use in cerebrovascular studies. METHODS: Continuous data were acquired from an experimental, first-pass, iodine contrast, bolus study by unidirectional X-ray tube rotation, and images were reconstructed at 100-millisecond intervals. Functional maps of cerebral blood volume (CBV) and cerebral blood flow (CBF) were constructed with voxel-by-voxel gamma variate fitting. Reproducibility studies, different injection volumes and sites, and CO2challenge were applied to verify the technique. RESULTS: Average absolute cortical gray and white matter and basal ganglia results were reproducible within60.8 mL/100 g for CBV and620 mL/100 g per minute for CBF. CBV response to changing arterial CO2 tension was significant only in cortical gray matter and basal ganglia; CBF response was significant in gray and white matter, as well as in the basal ganglia. CONCLUSION: Functional CT and constructed functional maps provide an optimal, high-resolution tool with which to visualize cerebrovascular parameters and their changes.
Index terms: Animal studies; Cerebral blood flow; Computed tomography, technique
AJNR Am J Neuroradiol17:639 –650, April 1996
Developments in the quantitative imaging of
tissue vascular physiology represent an
impor-tant contribution to the clinical assessment and
care of patients. In many diseases, particularly
those of the cerebrovascular system, early
al-terations in physiological function may signify
the advent of morphological changes that are
less amenable to treatment. For this reason, the
use of quantitative vascular physiological
imag-ing at the outset of assessment for acute or
worrisome pathophysiological conditions has
been considered with great interest.
Quantita-tive physiological imaging has the capacity to
profile cerebrovascular states, establish a
clini-cal diagnosis, and map therapeutic response
throughout treatment.
Since medical practice was introduced to
computed tomography (CT) in the l970s,
con-siderable effort has been made to increase its
temporal resolution. An early objective of this
effort was the application of CT to studies of the
physiological problems that underlie clinical
manifestations. Although many researchers
have attempted to portray organ function by
using conventional CT (1–3), the technical
lim-itations in speed for this technique were
numer-ous and complex. A recent advance in the
de-sign of CT imagers consists of the use of
slip-ring technology to collect a continuous stream
of data, thereby overcoming the main
limita-tions of previous scanners for the study of
vas-cular dynamics.
Slip-ring imagers are third- or
fourth-genera-tion CT scanners that make use of slip-ring
technology to transmit power to the X-ray tube,
permitting its continuous unidirectional rotation
and data acquisition. The need for back rotation
is eliminated by this design, and imaging times
are remarkably decreased. If the table is moved
at a constant speed as the tube rotates, the
X-ray beam will describe a spiral path along the
Received July 13, 1995; accepted after revision October 19. Presented at the 33rd Annual Meeting of the American Society of Neuroradiology, Chicago, Ill, April 21–27, 1995.
From the Department of Radiology, Center for Imaging and Pharma-ceutical Research (L.M.H., G.J.H., E.F.H., G.S.G., G.L.W.), and the Pulmo-nary and Critical Care Unit, Medical Services (B.H.), Massachusetts Gen-eral Hospital, Boston.
Address reprint requests to Leena M. Hamberg, PhD, Department of Radiology, Center for Imaging and Pharmaceutical Research, Second Floor, Room 2329, Bldg 149, 13th Street, Charleston, MA 02129. AJNR 17:639–650, Apr 1996 0195-6108/96/1704 –0639
qAmerican Society of Neuroradiology
body. Owing to the volumetric nature of the
acquired information, volumetric reconstruction
of spiral CT data is possible. For this reason,
slip-ring scanners have generally been used for
volumetric or spiral imaging (4, 5). In the
present study, however, we modified the
appli-cation of slip-ring CT technology to facilitate
tracking of a bolus of X-ray attenuating contrast
agent during its first cerebral circulation in order
to generate quantitative maps of
cerebrovascu-lar physiology.
Our goals in this work were to exploit and
verify the capabilities of slip-ring CT technology
to be used in the construction of quantitative,
physiological cerebral images. In a rabbit
model, we evaluated methods for determining
cerebral blood volume (CBV) and cerebral
blood flow (CBF), measured the response of
these parameters to physiological challenge,
and showed that our results are reproducible.
To differentiate this technique clearly from
dy-namic CT applications performed with older,
conventional technology, we use the term
func-tional CT
to refer to physiological, or functional,
CT imaging with slip-ring technology.
Materials and Methods
CT Imaging
Continuous data acquisition and image reconstruction.
Slip-ring CT technology was used as follows. We continu-ously rotated the X-ray tube, but kept the table stationary. This allowed data of a high temporal resolution to be obtained from a single section of interest during the initial pass of a contrast agent through cerebral tissue. Each 3608 rotation took 1 second, and the total study acquisition time was 50 seconds, corresponding to 50 rotations. From the continuous raw data series thus obtained, it is possible to reconstruct 1-second images at arbitrary time intervals. That is, the reconstruction of each 1-second image can begin as quickly as 1 millisecond after the starting point for the image reconstruction of the previous image. In our study, the reconstruction of sequential images was begun at 100-millisecond intervals. This yielded an effective im-aging rate of 10 frames per second. This, in turn, allowed us to measure the changes in contrast agent concentration that occurred in each voxel over sequential 100-millisec-ond intervals. Another way to view this reconstruction technique is to consider it as a 1-second moving average updated at 100-millisecond intervals.
Brain CT protocol.Imaging was performed on a nutate/ rotate Toshiba (Tokyo, Japan) TCT-900S/X-II whole-body CT scanner according to the following imaging pro-tocol. The anesthetized animal was placed supine in the gantry of the scanner, and its position secured with a head holder. Coronal sections in the middle of the brain were
prescribed from a lateral scout image. The imaging pa-rameters for all the studies included 120 kV X-ray tube voltage, 150 mA tube current, and high-resolution imag-ing mode. This resulted in the collection of over 4 million data samples during a 3608tube rotation lasting 1 second. A 1-mm section thickness and a 12-cm field of view, together with a 512 3 512 image matrix, yielded 0.055 mm2 in-plane resolution. Continuous scanning by
unidi-rectional rotation of the X-ray tube around the object be-gan 5 seconds before the bolus injection of the contrast agent. Scanning was maintained during injection and con-tinued for a total of 50 seconds. Injections were adminis-tered with a power injector (Medrad Mark IV, Medrad, Pa).
Animal Model
Animal studies were conducted under the guidelines of the Massachusetts General Hospital Subcommittee on Re-search Animal Care. Ten healthy New Zealand white rab-bits (2.5 to 3.5 kg) were anesthetized by using a mixture of ketamine (40 mg/kg) and xylazine (5 mg/kg) injected intramuscularly. Anesthesia was maintained by hourly in-jections of pentobarbital (0.25 mg/kg). The left ventricle (via the carotid artery) and/or femoral vein was catheter-ized for administration of the contrast agent. The femoral artery was catheterized for blood gas determinations. Io-hexol (350 mg/mL) iodinated contrast agent (Nycomed, Wayne, Pa) was used for all studies.
Reproducibility studies.To confirm the reproducibility of the technique, we repeated the studies under similar physiological conditions. The same dose and injection site were used, and multiple injections were administered to the same animal. Three animals were used for these stud-ies. Two animals were given intravenous boluses of con-trast agent (1.5 mL/kg at 3 mL/s, and 1.7 mL/kg at 5 mL/s). One of these animals received three injections; the other received five. In the third animal, left ventricular injections (1.6 mL/kg at 3 mL/s) were repeated five times. In all cases, a 15-minute time interval was used between sequential first-pass studies. The absolute variation in vas-cular cerebral parameters was determined from the stan-dard deviation. The relative dispersion (ie, the coefficient of variation) was also determined.
Injection sites and injection volumes. The effects of different injection volumes and injection sites (venous and intraventricular) were studied in four animals. Venous in-jections were administered into the femoral vein; intraven-tricular injections into the left ventricle. Three of the four animals were given two intraventricular and two intrave-nous injections. The exception was given one intraveintrave-nous and two intraventricular injections. Intraventricular injec-tion rates were 10 mL/s, and contrast agent doses varied from 1.6 to 3.75 mL/kg of total body weight. Femoral venous injection rates were 3, 4, and 5 mL/s and the same dose range was used as that described for arterial injec-tions. The absolute and relative variation in vascular cere-bral parameters was determined.
changes in arterial carbon dioxide tension (PCO2) was
tested in four animals. The CO2 challenge was used
be-cause of its known effects on CBV and CBF (6 – 8). The test was performed by changing the inhaled gas mixture and by using hyperventilation and/or hypoventilation, facili-tated by mechanical ventilation. All contrast agent injec-tions were administered into the left ventricle. Three ani-mals received contrast agent doses of 1.4 mL/kg, and one animal received a dose of 1.9 mL/kg; all injections were administered at a rate of 3 mL/s. Two animals received four injections, one animal received five injections, and one animal received six injections.
Arterial blood samples were drawn immediately before and after every data collection, and the arterial tension of CO2and O2, as well as blood pH (378C), were measured
for each sample by using a blood gas machine (AVL990S, AVL, Graz, Austria). The average CO2 value from these
samples was used to represent the CO2 tension during
data acquisition. The achieved arterial CO2values ranged
from 24 to 75 mmHg. The relationships between arterial CO2and CBV and CBF were determined by using a
gen-eral linear model analysis for cortical gray matter, white matter, and basal ganglia. This method of analysis takes into account animal-to-animal variations.
The linearity of the measured signal changes as a func-tion of contrast agent concentrafunc-tion for our scanner was established, and signal intensity–time curves were con-verted into absolute iodine concentration–time curves by using external standards (9).
Data Analysis
Calculation of cerebral blood volume and blood flow.
The calculation of CBV and CBF is based on the use of an intravascular contrast agent and the central volume prin-ciple. (The Appendix provides a detailed derivation of the central volume principle, based on a stochastic approach.) This makes use of the concept of populations of fluid elements, each characterized by a distribution of times calculated from the instant when an element enters into the flow system under consideration.
In summary, the central volume principle states that blood flow (F) through a system is the ratio of the vascular volume (V) of the system and the mean transit time (t#) of contrast agent through the system
1) F5V
t¯.
In our study, we first determined the tissue blood volume on the basis of measured time– concentration curves by normalizing the tissue response function with the arterial input function, as detailed below. The blood flow was then calculated by using the mean cerebral transit time.
Derivation of absolute blood volume.Let us assume a closed system. That is, the total input flow is known; the distribution of distal vessels follows a self-contained branching tree structure; there are no tributaries; and the total output flow is also known. In such a closed system, it
follows by conservation of mass that the flows in the arte-rial input, capillary bed, and venous output are equal. Furthermore, the concentration of contrast agent in blood is also equal throughout the system. Let us assume further that our imaging interval is such that we do not observe the same particle of the contrast agent more than once. Then the following relationship is valid:
2)
E
0 `
CA(t)dt5
E
0 `
CC(t)dt5
E
0 `
CV(t)dt,
where CA, CC, and CVare the arterial, capillary, and venous
blood concentrations of contrast material, respectively. If CAis measured from a voxel that is pure blood, then we
can define CC in terms of the tissue voxel concentration
(CT) by introducing a factor, f, which is the fraction of
whole blood in a tissue voxel. That is, CT 5 f*CC, and
Equation 2 becomes
3)
E
0 `
CA(t)dt51 f
E
0`
CT(t)dt.
This in turn may be rearranged to
4) f5
E
0 `
CT(t)dt
E
0 `CA(t)dt .
This is the fractional blood volume in a voxel, expressed in terms of the area under the time– concentration curve in the tissue divided by the area under the time – concentra-tion curve in the arterial input. This fracconcentra-tional blood vol-ume may be converted into absolute blood volvol-ume (milli-liters of blood in 100 g of tissue) by using knowledge of the voxel volume. There are three caveats to these statements. First, Equation 4 is valid only for the initial passage of contrast material; recirculation must be eliminated from consideration. Second, an estimation of tissue density must be provided to convert voxel volume to voxel mass. Third, all the tissue enhancement is assumed to be caused by the contrast agent within the blood rather than by con-trast material extravasated from the vascular space. This assumption holds only if the blood-brain barrier is intact.
Derivation of absolute blood flow. According to the central volume principle, tissue blood flow (usually re-ferred to astissue perfusion) may be calculated by dividing the tissue blood volume (milliliters of whole blood per 100 g of tissue) by the mean transit time. In this study, we determined the mean cerebral transit time by measuring the difference in mean transit times observed in the com-mon carotid artery and sagittal sinus.
con-structed for each voxel. To remove the effect of recircula-tion, we fit gamma variate functions (9, 10) to these curves, and the area under each fitted curve was calcu-lated with custom software (First Pass, Elite Software Co, Halisham, East Sussex, United Kingdom). In those cases in which the contrast agent remains entirely intravascular, the area under each fitted curve is proportional to the tissue blood volume fraction in the corresponding voxel, as indicated in Equation 4. By presenting the areas as a parametric image, we generated a regional relative CBV map.
In an ideal case, in which injection of the indicator is at the input and its observation is at the output of the system under investigation, the time – concentration curves ob-served at the output represent frequency distributions of the contrast agent’s transit times through the system (11, 12). The first moment of such a transit time frequency distribution gives the mean transit time through the system (13). This measurement is not available to us. In our experiments, we observe the tissue response of a particu-lar voxel rather than its output. If we calculate the first moment of the tissue response curve, we obtain the sum of well-understood time intervals with the zero time point as the start of image acquisition. Thus, we observe the
dura-tion of baseline imaging before the contrast agent is in-jected, followed by the duration of time when the contrast material travels from the injection site to the voxel of interest, and finally the duration of residency of the con-trast material within the voxel under study. The first two components cannot usually be separated without addi-tional, independent information. However, the residency time may be obtained from our analysis. This is achieved by independently calculating the arrival time of contrast material in the voxel and subtracting it from the first mo-ment of the voxel (14). This process is performed for each voxel, and the resulting tissue residency time is presented as a color-coded functional map. If we assume that the actual input to each voxel is derived from a common input (an assumption that is valid in the context of a closed system as described above), then differences in voxel res-idency times reflect relative differences in tissue transit times (tTT). For each voxel, if we divide the CBV by the tTT, we can obtain an index of relative CBF (CBFi). This index of CBF reflects local variations in blood flow within the brain, and may also be presented as a functional im-age.
[image:4.612.205.555.88.452.2]The relative CBV map can be converted into an abso-lute measurement by applying Equation 4, if the contrast
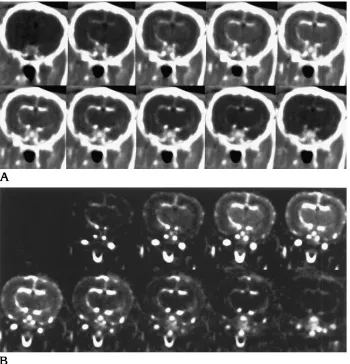
Fig 1. Temporal series of 1-sec-ond conventional (HU) images with a 1-second time interval between sequential images.
A, The distinction between gray and white matter caused by differ-ences in blood volume and flow be-comes apparent when the contrast agent concentration in the blood is highest.
concentration in the arterial input can be identified in the imaged section. The image-based definition of the arterial input function makes the functional CT method noninva-sive, apart from the contrast agent injection. We were able to identify the common carotid, internal carotid, and mid-dle cerebral arteries in all animals studied, allowing con-version to absolute units to be performed.
Results
An example of a timed image series is
pre-sented in Figure 1A. Each image is
recon-structed from raw data obtained during
1-sec-ond rotation of the X-ray tube, with a 1-sec1-sec-ond
time interval between sequential images. From
these studies, the distinction between gray and
white matter becomes apparent as the bolus of
contrast agent passes through the brain.
Re-gional differences in signal intensities are
caused by variable iodine concentrations that
result from different blood volume and blood
flow values in gray and white matter voxels.
Figure 1B shows the conversion of the temporal
image series into a series that reflects actual
iodine concentration in the voxels. This is
achieved by constructing an average baseline
reference image from those images in the series
acquired before the arrival of the contrast
ma-terial and by subtracting this reference image
from each subsequent image. The differences in
the behavior of the contrast material in differing
vascular structures are better appreciated in
these reference-subtracted (
D
HU) images than
in conventional (HU) images.
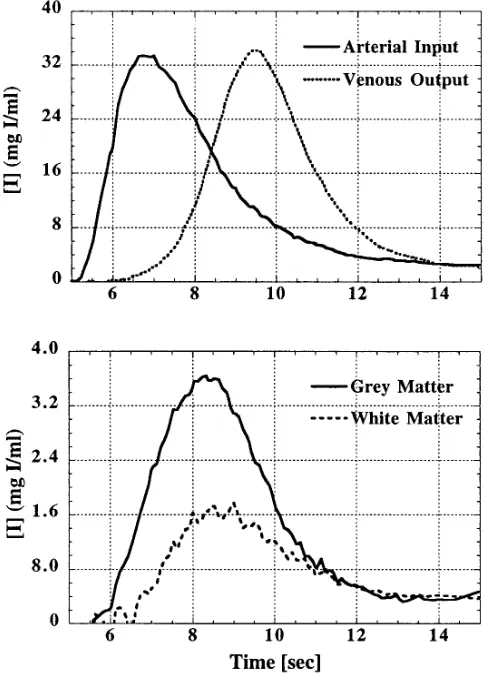
Figure 2 shows a representative set of time–
concentration curves obtained from gray and
white matter, as well as from the middle
cere-bral artery and sagittal sinus. Here, the time
interval between sequential points on the curves
is 100 milliseconds. This figure illustrates that
the tissue phase of the passage of contrast
ma-terial through the brain lies between the arma-terial
and venous phases, as expected.
Reproducibility Studies
There were 13 data sets from three animals, as
described above. The average cerebral mean
transit time was 2.3 seconds
6
0.5, with a 14%
coefficient of variation. The calculated mean and
standard deviations for absolute blood volume
and flow determinations, together with their
rela-tive dispersions, are shown in Table 1. The
mea-surements of absolute blood volume were
repro-ducible within 0.4 mL/100 g in each of the tissues
studied. The blood flow range (95 to 112 mL/
100 g per minute) and average variation (19 mL/
100 g per minute) that we observed are
compa-rable to the microsphere studies reported in the
literature for this species (8, 15).
Injection Sites and Injection Volumes
[image:5.612.316.558.90.427.2]In Figure 3 the data for intravenous and
in-traarterial injections are shown for CBV (Fig 3A)
and CBF (Fig 3B) in cortical gray matter, white
matter, and basal ganglia. There was no
differ-ence in CBV or CBF between the two injection
sites in any of the anatomic regions studied.
Variability in our data (0.5 mL/100 g in CBV and
17 mL/100 g per minute in CBF) was observed
to be similar to values obtained in our
reproduc-ibility studies. This indicates that data
quantita-tion is independent of injecquantita-tion site, and that the
effects of changing injection volumes can be
corrected. There were 15 data sets in four
ani-mals, as described earlier. The average cerebral
mean transit time of the contrast agent was 2.9
seconds
6
0.9, with an average coefficient of
variation of 12%. The mean and standard
devi-ations calculated for absolute blood volume and
flow determinations, together with their relative
dispersions, are shown in Table 2.
Physiological Challenge
In Figure 4, the responses observed in
cere-bral
vascular
parameters
subsequent
to
changes in systemic arterial CO
2tension are
shown for different regions of the brain. CBV
was significantly correlated with P
CO2in cortical
gray matter (P
,
.0001) (Fig 4A) and in the
basal ganglia (P
,
.02) (Fig 4C). In white
mat-ter, there was no significant correlation between
CBV and P
CO2(P
,
.09) (Fig 4B). There was
also no evidence of animal-to-animal variation
in the relationship between CBV and P
CO2.
Re-gression lines for percentage of CBV responses
to the changes in systemic arterial CO
2tension
were as follows (slope and intercept estimates
are followed by their standard deviation): CBV
5
0.08 (
6
0.01) P
CO21
3.61 (
6
0.61) for gray
matter; CBV
5
0.02 (
6
0.01) P
CO21
3.02
(
6
0.48) for white matter; and CBV
5
0.04
(
6
0.02) P
CO21
3.64 (
6
0.80) for the basal
gan-glia.
The pooled data showed that CBF was
signif-icantly correlated with P
CO2in all three
ana-tomic locations: gray matter (P
,
.0009), white
matter (P
,
.02), and basal ganglia (P
,
.002)
(Fig 4D–F). However, a significant
animal-to-animal variation was noted in the slopes of this
relationship in gray matter (P
,
.01) and in the
basal ganglia (P
,
.04). In gray matter, the
slopes of the regression lines for the four
ani-mals were 4.7
6
0.7, 4.1
6
1.4, 1.8
6
1.0, and
0.3
6
1.4 mL/100 g per minute. Similarly, in the
basal ganglia, the slopes were 2.8
6
1.3, 0.4
6
1.3, 1.3
6
0.9, and 3.4
6
0.6 mL/100 g per
minute. The regression line for CBF responses
in white matter was CBF
5
1.2 (
6
0.5) P
CO22
15.7 (
6
21.0). The CBF regression line,
calcu-lated from pooled data, for gray matter was 3.1
(
6
0.8) P
CO22
10.9 (
6
36.1); for the basal
gan-glia it was 2.1 (
6
0.6) P
CO21
5.6 (
6
26.8).
Functional Maps
Figure 5 shows two sets of functional images.
The first set (Fig 5A) provides an example of
CBV, the CBF index, tissue residency time, and
arrival time maps constructed from a bolus
tracking, first-pass imaging study. Note the
dif-ferences in the arrival times between the left and
right sides of the brain. In this animal, the
arte-rial catheter was placed in the right common
carotid artery, which may have resulted in a
partial delay in the delivery of contrast agent to
the right hemisphere. The second set (Fig 5B)
illustrates the changes observed in absolute
blood volumes, following alteration in P
CO2lev-els, in a single animal. Here, the shift toward
higher values in the frequency histograms of
blood volume occurs when the P
CO2increases
from 24 mmHg to 62 mmHg.
Discussion
We have presented an implementation of
spi-ral, slip-ring CT, which we have called
func-tional CT. We have shown that funcfunc-tional CT is
a valuable tool with which to obtain dynamic
studies of cerebrovascular physiology and that
the technique is able to demonstrate the rapid
changes in CBF and CBV resulting from the
manipulation of arterial carbon dioxide tension.
The derived functional maps provide images of
quantitative regional parameters and offer a
powerful diagnostic tool for the investigation of
vascular disorders.
[image:6.612.55.555.102.163.2]The technique was reproducible, as indicated
by the 9% variation in CBV and the average 18%
coefficient of variation in measured CBF. These
results compare favorably with data obtained by
other researchers who used other techniques
(8, 15). Further, no significant variation was
TABLE 1: Reproducibility of cerebral blood volume (CBV) and cerebral blood flow (CBF) measurements (n513)
Gray Matter White Matter Basal Ganglia
CBV, mean6SD (mL/100 g) 4.1 60.4 3.3 60.4 3.9 60.4
Coefficient of variation 9% 12% 11%
CBF, Mean6SD (mL/100 g per minute) 111.7 621.5 95.0 614.7 108.9 621.7
observed in these numbers for differing injection
sites or volumes of injectant.
In our results, a change in CBV of 0.07 mL/
100 g, 0.02 mL/100 g, and 0.04 mL/100 g per
mmHG changes in arterial P
CO2was observed
for gray matter, white matter, and basal ganglia,
respectively. Further, our CBF and CBV
re-sponse curves matched the results from several
studies reported in the literature (7, 8, 16). In
particular, direct comparison of results from
identical regions (gray matter, white matter,
and basal ganglia) was possible with MR
imag-ing data reported by Moseley et al, and revealed
similar CO
2reactivity values, reflected in the
slopes of the respective CBV and CBF lines,
calculated from their raw data (17). In general,
the results we report are from more
homoge-neous regions of interest because the superior
spatial resolution of functional CT (0.05 mm
2in
plane) permitted us to exclude confounding
large vessels from our analysis and to separate
interdigitating areas of gray and white matter
with greater accuracy.
The imaging of vascular physiology with
functional CT is now feasible through the use of
sophisticated CT technology, greatly improved
temporal resolution in CT scanners, and
state-of-the-art computing capability. The
quantita-tion of temporal funcquantita-tional CT data, however, is
based on an application of tracer kinetic theory.
In general, tracer kinetic techniques may be
applied to any dynamic series of images to
ob-tain quantitative or semiquantitative
physiolog-ical parameters if five key conditions are
satis-fied (11). The first of these is that the spatial
resolution of the instrument must be sufficiently
high to permit local anatomy of interest to be
identified separately from undesired
surround-ing or overlysurround-ing tissues. Second, the temporal
resolution of the detection system must be able
to resolve time-variant changes in the
physio-logical process under study. The third condition
requires that the relationship between the
mea-sured signal and tissue contrast concentration
be uniquely defined. Fourth, the indicator that is
used must reflect the physiology of interest
without perturbing it. Finally, the physiological
process under study should be in a steady state
throughout the period of measurement.
[image:7.612.67.549.88.253.2]Functional CT of the brain fully meets all of
the
tracer
kinetic
requirements
described
above, except for the condition that requires an
indicator to reflect physiology without
perturb-ing it, which it only partially satisfies. Violation
Fig 3. Cerebral blood volume (CBV) (A) and cerebral blood flow (CBF) (B) intravenous and intraarterial injection values, obtained under the same physiological conditions. No difference based on injection site was observed in either the CBV or the CBF values for any anatomic region studied (gray matter, white matter, basal ganglia).
TABLE 2: Reproducibility of cerebral blood volume (CBV) and cerebral blood flow (CBF) measurements with intraarterial and intravenous bolus injections (n515)
Gray Matter White Matter Basal Ganglia
CBV, mean6SD (mL/100 g) 4.3 60.6 3.1 60.4 3.9 60.5
Coefficient of variation 14% 13% 13%
CBF, Mean6SD (mL/100 g per minute) 100.8623.4 72.7615.3 91.2611.3
[image:7.612.57.556.333.394.2]of this condition may occur, for example, if a
large dose of hyperosmolar contrast agent is
used, resulting in a transient alteration in the
distribution of tissue water due to the high
os-molar gradients. This effect can be minimized,
however, and in most situations is effectively
eliminated, by the use of isoosmolar contrast
agents.
Currently, functional CT is limited to the
ac-quisition of a single section, although
simulta-neous multisection capability is already
avail-able
in
some
manufacturers’
spiral
CT
scanners. In addition, multiple sections can be
imaged through sequential data collections and
contrast agent boluses. The time window for
one continuous functional CT data acquisition,
as well as the time interval required between
sequential studies, is limited in these cases by
the X-ray tube heat capacity and its cooling
properties. The system used in the present
[image:9.612.57.563.90.453.2]Fig 4,opposite. Gray matter (A), white matter (B), and basal ganglia (C) responses in cerebral blood volume (CBV) as a function of changing arterial CO2. In the areas of gray matter (P,.0001) and basal ganglia (P,.002), a significant response can be seen. In the white matter, however, no significant correlation between CBV and PCO2could be measured (P,.09). The cerebral blood flow (CBF) was significantly correlated with changing arterial CO2tension in all three anatomic locations. In cortical gray matter (D) and basal ganglia (F), a significant animal-to-animal variation in the response was noted. In white matter (E), the response was the same for all four animals. The high spatial resolution permitted with functional CT (in this study, 0.05 mm3) allowed us to avoid larger vessels in the analysis, resulting in data that reflect cerebral vascular physiology occurring at the capillary level.
study had an X-ray tube with a 3.5-MHU heat
capacity and a 732 kHU/min cooling rate; this
made it possible to perform 50-second
contin-uous data acquisitions with a 150-mA tube
cur-rent. However, for clinical cerebral studies, a
higher current would be needed to achieve an
acceptable signal-to-noise ratio. Increases in
tube current would affect the available data
ac-quisition time window in an inverse manner: the
higher the current, the shorter the time window.
New high-heat-capacity X-ray tubes will
allevi-ate this constraint.
Because safe, approved CT agents are
avail-able for use as indicators, functional CT may be
easily adopted for clinical use. Multiple
injec-tions may also allow sequential studies to be
performed. In organ systems other than the
brain, the extravasation of contrast agent
mol-ecules into the extravascular, extracellular
space occurs with the use of currently approved
contrast agents. Where this occurs, the
quanti-tation of blood volume and flow becomes more
complicated, as the model must account for
capillary permeability and movement of the
contrast agent through the capillary membrane.
The availability of intravascular agents would
allow the techniques described in this work to
be applied to first-pass investigations of organs
that exhibit capillary permeability to current,
clinically available contrast agents.
Obvious comparisons between susceptibility
contrast MR imaging and functional CT can be
made easily with respect to presence or
ab-sence of ionizing radiation, relative risks of
ga-dolinium-based and iodine contrast agents,
section orientation, and scanner availability.
Any of these factors may be crucial in
determin-ing the appropriate technique for a specific
study. However, the superior spatial and
tem-poral resolution provided by functional CT,
to-gether with the fully understood physics of CT
and the linearity this technique provides
be-tween signal changes and tissue contrast
con-centration, make functional CT the desirable
method to use in the quantitative evaluation of
intracranial vascular physiology.
At present, functional CT may easily be
ap-plied in clinical studies. On the basis of the
results of our investigation, we conclude that
this new imaging technique is highly suitable for
situations in which particular spatial accuracy
and/or quantification of vascular parameters is
required. Obvious clinical applications for
func-tional CT include investigations of vascular
pathophysiology, studies of tumor vascularity,
demonstration of acute stroke, and
measure-ment of vascular parameters in small localized
areas (18). The technique is especially suitable
for experimental models that are used to
inves-tigate new drug therapies or temporal responses
in vascular pathophysiology. As effective
ther-apies for stroke become available, and the
dis-tinction between hemorrhagic and occlusive
stroke is thus made more critical, the ability to
quantitate lesion volume and monitor perfusion
changes will become more important.
Func-tional CT, because it is based on the
measure-ment of blood flow, has the potential to provide
the earliest indication of cerebral occlusion and
its distribution. The technique may also
demon-strate perfusion gradients as well as the
pres-ence or abspres-ence of stroke penumbra. Finally,
functional CT may prove useful in situations in
which the manipulation of P
CO2levels is used to
improve cerebral perfusion so as to minimize
the volume of ischemic tissue, such as after
trauma to the head.
In conclusion, we have demonstrated a new
method for the in vivo measurement of
cerebro-vascular physiology by using existing CT
tech-nology that is based on spiral, slip-ring CT. We
have shown that the results are reproducible
and are valid in an animal model. Further
stud-ies will help evaluate the utility of functional CT
in a clinical setting.
Acknowledgments
We express our appreciation for the contributions on behalf of this work made by Diane Kierstead and Kathy Tabor McEwan, and for the fine efforts of the entire tech-nical staff at the Center for Imaging and Pharmaceutical Research. We also thank JoAnne Fordham for her invalu-able help in preparing the manuscript.
Appendix
Derivation of the Central Volume Principle
distributions, where the age of a particle of contrast agent is defined as the time that has elapsed since it has entered a flow system (12).
Model used. We define our general flow system as a region of space that is bounded by a surface (imaginary or real) through which mass transport occurs by bulk flow. We assume that the flow rate is sufficiently high to consider as negligible the effects of mass transport by diffusion, and thus to omit them from the calculations. Let us consider a branching system that consists of one common input, many intermediate flow paths, and one common output. If there are many inflows, either they all must meet and mix at the input to the system, or the amount of tracer injected into the different inflows must be in proportion to the flow rate at a given inflow. The latter is the concept of equiva-lent labeling, and we may assume it to hold true for func-tional CT studies (as it does for microsphere studies). Thus, the assumption of a single common input is not strictly necessary under these circumstances. Detection of the residue function allows the system to be treated as a single-outlet system (11).
Let Vo be the volume fraction of the system through which there is a steady flow rate, Fo. New fluid continually displaces old fluid from the system. Time zero is set to be the time when a contrast element enters the system; age is calculated from this moment. Any fluid element that enters Vo after time zero is called new; old fluid is the fluid that was already present in the system at time zero.
We then make use of probability density functions of age; namely, the internal age distribution function, I(t), and the external age distribution function, E(t). The internal age distribution function, I(t), is the probability density function of ages of fluid elements within the system; and the external age distribution of fluid from a system, E(t), is the probability density function of the ages of fluid ele-ments that have flowed through and just exited the system. Since I(t) and E(t) are defined as probability density func-tions, by definition they are normalized such that
1)
E
0 `
I(t)dt5
E
0 `
E(t)dt51.
The mean transit time may therefore be calculated as the first moment of E(t), as follows:
2)
E
0 `
tE(t)dt5t¯.
The actual derivation of the central volume principle may be performed by using the relations between internal and external age distribution functions along the lines of Larson (12). At time t5t9, the amount of the new fluid in the volume Vo is Vo*0tI (t9)dt9. The rate at which the new
fluid has been accumulating in the system may be ob-tained by differentiation, giving VoI(t). Simultaneously, when new fluid is pouring into the system, old fluid is
leaving at the volumetric rate, which is equal to the new fluid accumulation rate:
3) VoI(t)5Fo
E
0 `E(t’)dt’.
An equivalent relationship may be obtained by differenti-ation of Equdifferenti-ation 3:
4) dI(t)
dt 5 2 Fo
VoE(t).
In order to express t#in terms of system parameters Vo and Fo, we multiply Equation 4 by t and integrate it, giving
5)
E
0 ` tdI(t) dt 52 FoVo
E
0`
tE(t)dt.
Equation 5 may be written
6)
E
0 `
tdI(t) dtdt52
Fo
Vot¯.
By integrating, the left-hand side by parts, we obtain
7)
E
0 `
tdI(t)
dt dt5tI(t)?0
`2
E
0 `
I(t)dt5 21.
As the value of tI(t) is 0 when t approaches infinity, we may write Equation 6 as
8) t¯5Fo
Vo,
which is the central volume principle.
References
1. Dobben GD, Valvassori GE, Mafee MF, Berninger WH. Evaluation of brain circulation by rapid rotational computed tomography.
Radiology1979;133:105–111
2. Berninger WH, Axel L, Norman D, Napel S, Redington RW. Func-tional imaging of the brain using computed tomography. Radiol-ogy1981;138:711–716
3. Norman D, Axel L, Berninger WH, et al. Dynamic computed tomography of the brain: techniques, data analysis, and applica-tions.AJNR Am J Neuroradiol1981;2;1–11
4. Rigauts H, Marchal G, Baert AL, Hupke R. Initial experience with volume CT scanning.J Comput Assist Tomogr1990;14:675– 682 5. Fishman EK, Jeffrey RB.Spiral CT: Principles, Techniques and Clinical Applications.New York, NY: Raven Press, 1995:1–227 6. Kety SS, Schmidt CF. The effects of altered arterial tensions of
carbon dioxide and oxygen on cerebral blood flow and cerebral oxygen consumption of normal young men.J Clin Invest1948; 27:484 – 492
7. Grubb RL, Raichle ME, Eichling JO. The effects of changes in PaCO2on cerebral blood volume, blood flow, and vascular mean
transit time.Stroke1974;5:630 – 639.
9. Thompson HK, Stramer CF, Whalen RE, McIntosh HD. Indicator transit time considered as a gamma variate.Circ Res1964;14: 502–515
10. Axel L. Cerebral blood flow determination by rapid-sequence computed tomography.Radiology1980;137:679 – 686. 11. Lassen NA, Perl W.Tracer Kinetic Methods in Medical Physiology.
New York, NY: Raven Press, 1979:1–186
12. Larson KB. Physical principles of tracer kinetics, In: Larson KB and Cox JR, eds.Computer Processing of Dynamic Images from an Anger Scintillation Camera. New York, NY: The Society of Nuclear Medicine, 1971:70 –94
13. Lindgren BW.Statistical Theory.New York, NY: Macmillan Pub-lishing Co, 1968:50 –160
14. Hamberg LM, MacFarlane R, Tasdemiroglu E, et al. Measurement of cerebrovascular changes in cats after transient ischemia using dynamic magnetic resonance imaging.Stroke1993;24:444 – 451
15. Lo EH, Sun G-H, Steinberg GK. Effects of NMDA and calcium channel antagonists on regional cerebral blood flow.Neurosci Lett
1991;131:17–20
16. Traystman RJ. Microcirculation of the brain, In: Mortillaro NA, ed.
The Physiology and Pharmacology of the Microcirculation.New York, NY: Academic Press, 1983:237–298
17. Moseley ME, Chew WM, White DL, et al. Hypercarbia-induced changes in cerebral blood volume in the cat: a1
H MRI and intra-vascular contrast agent study.Magn Reson Med1992;23:21–30 18. Hamberg LM, Kristjansen PEG, Hunter GJ, Wolf GL, Jain RK. Spatial heterogeneity in tumor perfusion measured with functional computed tomography at 0.05ml resolution.Cancer Res1994;54: 6032– 6036
19. Jacquez JA.Compartmental Analysis in Biology and Medicine.