Takashi Kaneda, Manabu Minami, Kaoru Ozawa, Yoshiaki Akimoto, Tomonori Kawana, Hiroyuki Okada, Hirotsugu Yamamoto, Hiromi Suzuki, and Yasuhito Sasaki
PURPOSE: To evaluate the MR appearance of normal and pathologic states of the submandibular gland. METHODS: MR images of 22 healthy subjects and 21 patients with histopathologically confirmed disorders of the submandibular gland (five pleomorphic adenomas, two hemangiomas, two malignant lymphomas, one adenoid cystic carcinoma, one squamous cell carcinoma, and 10 cases of sialadenitis) were reviewed. RESULTS: All normal submandibular glands showed higher signal intensity than surrounding muscle but lower intensity than fat on T1-weighted and T2-weighted images. Postcontrast images showed moderate enhancement of the gland. All the tumors had lower signal intensity than the normal submandibular gland on T1-weighted images and had intermediate to high (n58) or high (n53) signal intensity relative to the normal submandibular gland on T2-weighted images. Six of seven benign tumors were well defined, and three of four malignant tumors were poorly defined. In all cases of sialadenitis, the submandibular gland showed diffusely different signal intensities from the normal gland on both T1-weighted and T2-weighted images. Eight cases of chronic sialadenitis showed lower T2-weighted signal intensities than the normal gland, and this can be explained histopathologically by marked fibrosis and cellular infiltration. CONCLUSIONS: MR imaging can show the presence, extent, margins, and signal intensity changes of pathologic conditions of the submandibular gland.
Index terms: Salivary glands, magnetic resonance; Salivary glands, neoplasms
AJNR Am J Neuroradiol17:1575–1581, September 1996
The submandibular gland is the second larg-est salivary gland, about half the size of the parotid gland (1). Eighty percent of all salivary gland tumors arise in the parotid gland, 10% in the submandibular gland, and the remaining 10% in the minor salivary gland and sublingual gland (2). The proportion of malignant tumors differs among the various salivary glands. In the parotid gland, about 20% of all tumors are ma-lignant, whereas in the submandibular gland, 45% are malignant (2). Moreover, the subman-dibular gland is susceptible to stone formation, inflammation, and sialectasia because the
di-rection of salivary flow is against gravity. There-fore, the differential diagnosis among benign and malignant neoplasms and inflammation is important for patients with problems in the sub-mandibular gland.
Magnetic resonance (MR) imaging can delin-eate various kinds of soft tissues clearly with high contrast resolution. Recently, MR imaging has been used in the diagnosis of many patho-logic conditions of the parotid gland (3–7). The purpose of this study was to evaluate MR find-ings depicting normal and pathologic states of the submandibular gland and to correlate the MR findings with histopathologic observations.
Materials and Methods
We reviewed the MR images of the submandibular gland obtained in 12 women and 10 men (mean age, 42 years; range, 22 to 54 years) who were examined by precontrast and postcontrast MR imaging for various prob-lems of the face and neck not related to the submandibular gland or to the floor of the mouth. These problems in-cluded odontogenic cysts in the maxilla (11 patients), maxillary sinusitis (five patients), and postoperative max-Received June 6, 1995; accepted after revision February 22, 1996.
From the Departments of Radiology (T.Kan., K.O., H.S.), Oral Surgery (Y.A.,T.Kaw.), and Pathology (H.O., H.Y.), Nihon University School of Dentistry at Matsudo, Chiba, and the Department of Radiology, University of Tokyo Hospital, Tokyo (M.M.,Y.S.), Japan
Address reprint requests to Takashi Kaneda, DDS, PhD, Department of Radiology, Nihon University School of Dentistry at Matsudo, 2– 870 –1, Sakaecho-Nishi, Matsudo, Chiba 271, Japan.
AJNR 17:1575–1581, Sep 1996 0195-6108/96/1708 –1575
qAmerican Society of Neuroradiology
illary cysts (six patients). The submandibular gland in these patients was considered to be representative of that in healthy subjects from the viewpoint of clinical signs and symptoms and radiologic findings. The signal intensities of the gland were compared with those of fat and muscle on T1-weighted images and with those of cerebrospinal fluid and muscle on T2-weighted images.
Separately, 34 patients with suspected submandibular gland lesions have been studied prospectively with MR imaging since March 1992. Their clinical symptoms in-cluded swelling (n 5 12), pain (n 5 12), and painless palpable masses (n 5 10) in the submandibular region. Among them, 21 patients whose diagnoses were con-firmed pathologically by specialists in oral pathology were chosen for this study. This group comprised 14 women and seven men (mean age, 51 years; range, 18 to 83 years). Fourteen of them had surgery or open biopsy, and seven had fine-needle aspiration biopsy after MR exami-nations. The pathologic specimens were classified accord-ing to guidelines established by the World Health Organi-zation (8).
MR examinations were performed on a 0.2-T perma-nent magnet system with a head coil. Axial T1-weighted images were obtained using the spin-echo technique. The scanning parameters were as follows: 363/20/2 (repetition time/echo time/excitations), 256 3 256 matrix, 300 3 300-mm field of view, 7-mm section thickness, and 8.4-mm section interval. Axial T2-weighted images were also acquired using the spin-echo technique at 3000/120, with other parameters identical to those for T1-weighted images. In addition, coronal or sagittal T1-weighted im-ages were obtained with the same pulse sequence as that used for axial T1-weighted images. In 10 of 21 cases, enhanced studies were performed with the same sequence as the precontrast T1-weighted images after intravenous injection of 10 mL (5 mmol) of gadopentetate dimeglu-mine.
MR signal intensity and its heterogeneity of the normal submandibular gland were evaluated by two radiologists on weighted, T2-weighted, and postcontrast T1-weighted images. MR images of the pathologic lesions in the submandibular gland were evaluated by two radiolo-gists in terms of presence, margination, heterogeneity of internal structures, T1-weighted and T2-weighted signal intensities, and contrast enhancement of the lesions before histopathologic examinations. The signal intensities of the lesions seen on T1-weighted and T2-weighted images were compared with those of normal submandibular gland tissue and other standards used in the healthy subjects. For this purpose, a five-point grading system was applied: on T1-weighted images, grade 1 represented almost the same signal intensity as muscle; grade 2, higher signal intensity than muscle and lower signal intensity than nor-mal submandibular gland; grade 3, the lesion was isoin-tense with the gland; grade 4, higher signal intensity than the normal submandibular gland and lower signal intensity than fat; and grade 5, almost the same signal intensity as fat. On T2-weighted images, grade 1 represented almost the same signal intensity as muscle; grade 2, higher signal intensity than muscle and lower signal intensity than nor-mal submandibular gland; grade 3, the lesion was isoin-tense with the gland; grade 4, the lesion and fat were isointense; and grade 5, almost the same signal intensity as cerebrospinal fluid.
Results
The normal submandibular gland (n 5 44) appeared homogeneous (24/44) or heteroge-neous (20/44) in signal intensity on both T1-and weighted images. On both T1- T1-and T2-weighted images, the signal intensity of the gland was higher than that of surrounding
[image:2.612.43.541.523.700.2]cle but lower than that of fat tissue. After ad-ministration of contrast material, the normal submandibular gland showed moderate homo-geneous enhancement in all cases (Fig 1).
The pathologic diagnoses and MR imaging findings are summarized in the Table. Seven lesions were histopathologically diagnosed as benign tumors, four as malignant tumors, two as acute sialadenitis, and eight as chronic sialadenitis. All 11 tumors could be easily de-tected as focal abnormalities with sparing of some portions of normal parenchyma on MR images. They appeared as low signal intensity masses on T1-weighted images and intermedi-ate to high (n 5 8) or high (n 5 3) signal intensity masses on T2-weighted images. Six of seven benign tumors were well defined. All ple-omorphic adenomas appeared as well-defined masses, and three of them showed marginal lobulations (Fig 2). One of two hemangiomas and three of four malignant tumors had poorly defined margins. The MR findings on margin-ations were in close agreement with the his-topathologic findings in all tumors. Heteroge-neous internal architecture was found in six of seven benign tumors and in all malignant tu-mors, so heterogeneity of signal intensity was not useful for differentiating between benign and
malignant tumors. In two cases, malignant lym-phoma invaded the submandibular gland and was associated with lymphadenopathy sur-rounding the gland (Fig 3). Adenoid cystic car-cinoma (Fig 4) and squamous cell carcar-cinoma were not associated with lymphadenopathy in the current study.
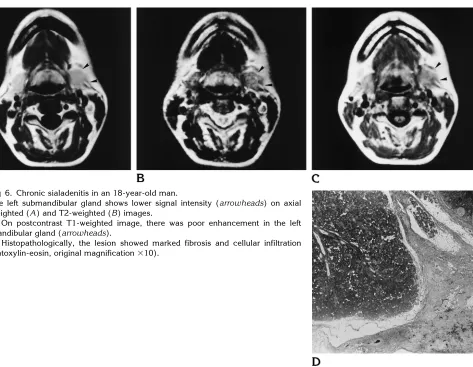
In sialadenitis, the normal signal intensity of the submandibular gland was diffusely replaced on both T1- and T2-weighted images. All cases of acute sialadenitis had higher signal intensity than normal on T2-weighted images (Fig 5), whereas seven of eight cases of chronic sialad-enitis had lower signal intensity than normal on T2-weighted images. Histopathologically, chronic sialoadenitis showed marked fibrosis and cellular infiltration (Fig 6).
Discussion
It is essential that the differential diagnosis establish whether a lesion is located within or outside the submandibular gland, because about half of all intraglandular tumors are ma-lignant. Extraglandular lesions are mostly lymph node abnormalities and include metas-tasis and lymphoma as well as benign enlarge-ment (2, 9). It is also critical for proper treat-Histopathologic and MR imaging data of submandibular gland lesions in 21 cases
Patient Age, y/Sex Diagnosis Margins Heterogeneity
Signal Intensity Grade on T1-Weighted
Images
Signal Intensity Grade on T2-Weighted
Images
Degree of Contrast Enhancement
1 50/F Pleomorphic adenoma Well defined Heterogeneous 1 4 to 5 1
2 43/F Pleomorphic adenoma Well defined Heterogeneous 1 4 to 5 . . . 3 67/F Pleomorphic adenoma Well defined Heterogeneous 1 4 to 5 1
4 48/M Pleomorphic adenoma Well defined Heterogeneous 1 4 to 5 1
5 52/M Pleomorphic adenoma Well defined Homogeneous 1 5 . . . 6 66/M Hemangioma Well defined Heterogeneous 1 4 to 5 1 1
7 79/F Hemangioma Poorly defined Heterogeneous 1 5 . . . 8 59/M Malignant lymphoma Poorly defined Heterogeneous 2 4 to 5 6
9 33/F Malignant lymphoma Well defined Heterogeneous 2 4 to 5 6
10 83/M Adenoid cystic carcinoma Poorly defined Heterogeneous 1 to 2 3 to 4 . . . 11 67/F Squamous cell carcinoma Poorly defined Heterogeneous 1 to 2 3 to 4 1
12 45/F Acute sialadenitis Well defined Heterogeneous 1 4 to 5 . . . 13 51/F Acute sialadenitis Poorly defined Heterogeneous 1 4 to 5 . . . 14 40/F Chronic sialadenitis Well defined Heterogeneous 2 2 to 3 6
15 18/M Chronic sialadenitis Poorly defined Heterogeneous 2 2 to 3 6
16 59/F Chronic sialadenitis Well defined Homogeneous 2 2 . . . 17 53/F Chronic sialadenitis Well defined Heterogeneous 2 2 . . . 18 28/M Chronic sialadenitis Well defined Heterogeneous 1 2 . . . 19 42/F Chronic sialadenitis Well defined Heterogeneous 1 2 . . . 20 50/F Chronic sialadenitis Well defined Heterogeneous 2 2 to 3 . . . 21 43/F Chronic sialadenitis Well defined Heterogeneous 1 2 to 3 . . .
Fig 2. Pleomorphic adenoma in a 50-year-old woman.
A, Axial T1-weighted MR image shows a well-defined focal mass of heterogeneously low signal intensity, lower than normal submandibular gland, in the right submandibular gland (arrowheads). The residual glandular tissue is displaced medially (arrow).
B, On the T2-weighted image, the lesion appears well defined with heterogeneously high signal intensity. The lesion is isointense with fat.
C, On the postcontrast T1-weighted image, there is moderate enhancement in the lesion.
D, Pleomorphic adenoma was proved histopathologically, and photomicrograph shows it surrounded by a thin layer of fibrous connective tissue (arrowheads) (hema-toxylin-eosin, original magnification310).
Fig 3. Malignant lymphoma in a 59-year-old man.
A, Axial T1-weighted MR image shows a poorly defined mass of low signal intensity in the left submandibular gland (arrows). Note small amount of normal gland medial to lesion.
[image:4.612.46.542.504.685.2]ment to define the lesion’s extent in the submandibular region (9).
Sialography, which is the best method for visualizing the salivary ductal system, is an in-vasive examination (1). Computed tomography (CT) shows the submandibular gland as a struc-ture of similar density to muscle (at 35 to 60 Hounsfield units), so evaluation of extension of disease around the gland is sometimes difficult (10). Yasumoto et al (11) reported that 27 of 35 submandibular gland tumors could not be seen clearly on precontrast CT scans. Sialographic CT can demonstrate the major ductal anatomy and intraglandular lesions as a defect, but is still invasive (12).
Concerning the frequency of malignant tu-mors in the submandibular gland, Spiro et al (13) reported that 96 (44%) of 217 tumors in their study were benign and 121 (56%) were malignant. The most frequently occurring
be-nign lesions in that study were mixed tumors (43%). Eneroth et al (14) reported that among 157 submandibular gland tumors, 95 (61%) were benign and 62 (39%) were malignant. The three most common malignant tumors in both studies were adenoid cystic carcinoma (19% and 40%, respectively), mixed tumors (11% and 24%), and mucoepidermoid carcinomas (10% and 11%). In the current study, although the series of malignant tumors was slightly unusual and the total number was limited, all the neo-plastic lesions had focal abnormalities of differ-ent signal intensity from that of the normal sub-mandibular gland on T1-weighted or T2-weighted images, making the tumor extension in the gland distinct. However, MR imaging could not differentiate between benign and ma-lignant tumors, and was not useful in his-topathologic diagnosis. Seifert et al (2) reported that histopathologic criteria for malignant tu-Fig 4. Adenoid cystic carcinoma in an 83-year-old man.
A, Axial T1-weighted MR image shows a poorly defined mass (arrows) of low signal intensity in the left submandibular gland.
B, On the T2-weighted image, the lesion is revealed as a heterogeneous mass of intermediate to high signal intensity (ar-row).
Fig 5. Acute sialadenitis in a 45-year-old woman.
A, Axial T1-weighted MR image shows lower signal intensity entirely in the right (as compared with the left) submandibular gland (arrowheads).
[image:5.612.42.374.84.468.2]mors of the salivary gland include the presence of infiltration, vascular invasion, perineural spread, and metastasis. Mandelblatt et al (15) reported that the most reliable MR feature of malignant parotid gland tumors is poorly de-fined margins. In keeping with this observation, we found poorly defined tumor margins in nine of 11 cases of malignant tumor. Vogl et al (16) reported that postcontrast MR imaging was helpful in delineating tumorous lesions and in differentiating between benign and malignant lesions. However, another study found that even enhanced MR imaging could not differentiate malignant from benign lesions (17). In the cur-rent study, tumor enhancement was useful in delineating tumor extension, but clear differen-tiation between benign and malignant lesions was not possible, even on postcontrast images. Further research on this point will be necessary. Clinically, painful enlargement of the sub-mandibular gland may be produced by two dif-ferent circumstances: inflammation or infection
[image:6.612.67.540.83.450.2]of the gland caused by ductal occlusion and infection not preceded by ductal obstruction (18). Isacsson et al (19) found that salivary calculi caused inflammation in the submandib-ular gland in 83% of patients who had pain in the region, and radiography was 92% accurate in the diagnosis of salivary calculi. In the present study, all patients with sialoadenitis had dif-fusely abnormal signal intensity in the subman-dibular gland, which was different from focal abnormalities of neoplasms. However, MR im-aging is less sensitive than radiography and CT in detecting calcifications like sialolithiasis. In addition, chronic sialadenitis without sialolithi-asis is often difficult to differentiate from such neoplasms as high-grade malignant tumors in clinical situations (20). At MR imaging, high-grade malignant tumors in the parotid gland are reported to show low T2-weighted signal inten-sity as well as poorly defined margins, making their appearance similar to chronic sialoadenitis if they replace the gland diffusely.
Fig 6. Chronic sialadenitis in an 18-year-old man.
The left submandibular gland shows lower signal intensity (arrowheads) on axial T1-weighted (A) and T2-weighted (B) images.
C, On postcontrast T1-weighted image, there was poor enhancement in the left submandibular gland (arrowheads).
In conclusion, MR imaging was able to show an abnormality of the submandibular gland with different intensity from that of normal gland. Although the signal intensity itself is nonspe-cific, MR images showed the margins of the lesions, which correlated well with pathologic findings.
References
1. Som PM, Bergeron RT.Head and Neck Imaging.2nd ed. St Louis, Mo: Mosby-Year Book; 1991:284 –286
2. Seifert G, Miehlke A, Haubrich J, Chilla R. Diseases of the Salivary Glands: Pathology-Diagnosis-Treatment-Facial Nerve Surgery. Stuttgart, Germany: Thieme Verlag; 1986:5– 6, 110 –12, 171–291 3. Schaefer SD, Maravilla KR, Burns DK, Close LG, Merkel MA, Suss RA. Evaluation of NMR versus CT for parotid masses: a prelimi-nary report.Laryngoscope1985;95:45–950
4. Teresi LM, Lufkin RB, Wortham DG, Abemayor E, Hanafee WN. Parotid masses: MR imaging.Radiology1987;163:405– 409 5. Casselman JW, Mancuso AA. Major salivary gland masses:
com-parison of MR imaging and CT.Radiology1987;165:183–189 6. Minami M, Tanioka H, Oyama K, et al. Warthin tumor of the
parotid gland: MR-pathologic correlation.AJNR Am J Neuroradiol 1993;14:209 –214
7. Joe VQ, Westesson PL. Tumors of the parotid gland: MR imaging characteristics of various histologic types.AJR Am J Roentgenol 1994;63:433– 438
8. Seifert G.Histological Typing of Salivary Gland Tumours.2nd ed. Berlin, Germany: Springer-Verlag; 1991:8 –38
9. Batsakis JG.Tumors of the Head and Neck: Clinical and Patho-logical Considerations.2nd ed. Baltimore, Md: Williams & Wilkins; 1979:1–75
10. Bryan RN, Miller RH, Ferreyro RI, Sessions RB. Computed tomog-raphy of the major salivary glands.AJR Am J Roentgenol1982; 139:547–554
11. Yasumoto M, Shibuya H, Susuki S, et al. Computed tomography and ultrasonography in submandibular tumours. Clin Radiol 1992;46:114 –120
12. Stone DN, Mancuso AA, Rice D, Hanafee WN. Parotid CT sialog-raphy.Radiology1981;108:393–397
13. Spiro RH, Hajdu SI, Strong EW. Tumors of the submaxillary gland. Am J Surg1976;132:463– 468
14. Eneroth CM, Hjertman L, Moberger G. Malignant tumors of the submandibular gland.Acta Otolaryngol1967;64:514 –536 15. Mandelblatt SM, Braun IF, Davis PC, Fry SM, Jacobs LH, Hoffman
JC Jr. Parotid masses: MR imaging.Radiology1987;163:411– 414
16. Vogl TJ, Dresel SH, Spath M, et al. Parotid gland: plain and gadolinium-enhanced MR imaging. Radiology 1990;177: 667– 674
17. Chaudhuri R, Gleeson MJ, Graves PE, Bingham JB. MR evalua-tion of the parotid gland using STIR and gadolinium-enhanced imaging.Eur Radiol1992;2:357–364
18. Wood NK, Goaz PW.Differential Diagnosis of Oral Lesions.3rd ed. St Louis, Mo: Mosby; 1985:632– 653
19. Isacsson G, Isberg A, Haverling M, Lundquist PG. Salivary calculi and chronic sialoadenitis of the submandibular gland: a radio-graphic and histologic study.Oral Surg1984;58:622– 627 20. Som PM, Biller HF. High-grade malignancies of the parotid gland: