P. C. Oavis1 J. C
.
Hoffman, Jr.1 T. Spencer' G. T. Tindall2 Ira F. Braun1This article appears in the January/February 1987 issue of AJNR and the April 1987 issue of AJR.
Received December 30. 1985; accepted after revision June 10, 1986.
, Department of Radiology /Neuroradiology, Emory University School of Medicine, 1365 Clifton Road, N.E., Atlanta, GA 30322. Address reprint requests to P. C. Davis. .
2 Department of Neurosurgery, Emory University
School of Medicine, 1365 Clifton Road, N.E., At-lanta, GA 30322.
AJNR 8:107-112, January/February 1987
0195-6108/87/0801-0107
© American Society of Neuroradiology
MR Imaging of Pituitary
Adenoma:
CT, Clinical, and
Surgical Correlation
Twenty-five patients with suspected pituitary adenoma were evaluated prospectively with CT and MR. Nine patients underwent transsphenoidal surgery, and three of these showed a documented decrease in size of mass on bromocriptine therapy. CT was more sensitive than MR for detecting focal lesions (seven vs three) and sellar-floor erosion (12 vs six). MR was superior to CT in identifying infundibular abnormalities (seven vs six), focal abnormalities of the diaphragma sellae (10 vs seven), cavernous sinus invasion (four vs two), and optic chiasm compression (six vs zero). Thus, MR may be the procedure of choice for optimal identification and localization of macroadenoma. For patients with suspected microadenoma, however, this preliminary series indicates that CT remains the radiographic procedure of choice.
CT is currently the accepted radiographic technique for evaluating patients with
suspected pituitary adenoma. Macroadenomas are readily identified with CT;
however, identifying microadenomas with this technique may be difficult. The
classic appearance of microadenoma on contrast CT is that of a discrete focal hypodense lesion measuring less than 10 mm in diameter with or without associated
elevation of the diaphragma sellae, infundibulum displacement, and sellar-floor
erosion [1,2]; however, microadenomas may reveal few or no abnormalities on CT
[3,4].
MR is likewise useful in evaluating macroadenomas [5-8] while its value in
identifying microadenomas is unproven [9]. This prospective study compares the
roles of MR and CT in evaluating patients suspected of harboring a pituitary
adenoma. The accuracy of both imaging techniques were subsequently compared
with surgical results.
Materials and Methods
From November 1984 to September 1985, 41 patients were referred for radiographic
evaluation for clinically and endocrinologically suspected pituitary adenoma. An attempt was
made to evaluate all patients with both CT and MR; however, six studies were incomplete.
Five patients had had prior transsphenoidal surgery or radiation therapy, and five had other
diagnoses, leaving 25 patients for evaluation in this study. This group included 16 patients
with elevated prolactin (PRL), with a mean prolactin of 817 ng/ml (range 64 to 6000 ng/ml).
Four had increased adrenocorticotropic hormone (ACTH), of whom two had ACTH levels
greater than 600 ng/ml and two had abnormal dexamethasone tests. One patient had elevated growth hormone (GH 16.6 ng/ml), and four had symptoms of hypopituitarism and/
or optic chiasm compression. The group included 18 women and seven men, ranging in age
from 19 to 64 years old.
All patients were evaluated with high-resolution CT scanning and intravenous contrast administration. After a lateral scout view, scanning was completed immediately after a bolus of 100 ml of 60% intravenous contrast (28.2 g I), followed by a drip infusion of 30% contrast (42.3 g I) during the rest of the study. Dynamic scans were not performed. Twenty-three patients had direct coronal images with 1.5- to 3-mm collimation, af)d two patients with
108 DAVIS ET AL. AJNR:8, January/February 1987
MR studies were acquired with a 1.5 T superconducting system (Philips) operating at 0.5 T. All images were acquired and displayed with a 256 x 256 matrix. T1-weighted sequences were performed with a spin-echo technique using a TR of 500 to 600 msec and TE of 30 and 60, or 50 and 100 msec. Initially, contiguous 5.0-mm
coronal images were obtained (four excitations, 0-1-mm tissue gap); subsequently, 2.0-mm volume acquisitions were obtained (14 pa-tients). One patient had a technically suboptimal T1-weighted
se-quence due to motion. For comparison purposes, the first-echo study (TE 30 or 50) was considered the T1-weighted image. T2-weighted
sequences were obtained with a spin-echo technique using a TR of 1500 to 2000 msec, TE of 30 and 60, or 50 and 100 msec, and 5.
0-mm contiguous coronal images (two excitations, 0-1-mm tissue gap).
Five T2-weighted sequences were unsuccessful because of patient motion or equipment malfunction. For comparison purposes, the
second-echo study (TE 60 or 100 msec) was considered the
T2-weighted image.
CT and MR images were independently and blindly evaluated. CT parameters evaluated included height of intrasellar contents, status of the sellar floor, presence of a focal lesion, configuration of the diaphragma sellae, infundibulum position, cavernous sinus invasion,
and optic chiasm compression. Cavernous sinus invasion on CT was
suspected when the lateral margin of the cavernous sinus bowed outward or was grossly asymmetrical. MR parameters evaluated included height of intrasellar contents, cavernous sinus invasion, position of the infundibulum, diaphragma sellae configuration, optic
chiasm compression, sellar-floor erosion, and presence of a focal lesion. The intensity of the intrasellar contents with MR was compared
with that of the adjacent cortex. By MR, cavernous sinus invasion
TABLE 1: MR vs CT for Suspected Pituitary Adenoma
was suspected on the basis of displacement of the lateral margin of the cavernous sinus, displacement of the cavernous internal carotid
artery, or a change in intensity pattern of the cavernous sinus tissue
to one similar to the adjacent sellar mass (10).
Nine patients underwent surgical evaluation using a transsphe-noidal approach. Operative and histologic results were noted. Three additional patients with hyperprolactinemia had a documented
de-crease in size of intrasellar mass on bromocriptine therapy.
Results
A comparison of MR and CT findings in all patients studied is given in Table 1. As shown by Wiener et al. [11], MR and CT were generally in agreement for height of intrasellar con-tents; thus, this criterion was used somewhat artificially to divide the non operated patients into micro- and macroade-noma categories.
In this series, 17 patients were suspected of having micro-adenoma (six with transsphenoidal exploration for suspected microadenoma, and 11 with a height of intrasellar contents of less than or equal to 10 mm). In the surgically evaluated microadenoma group (six patients), CT abnormalities were identified in three patients (Table 2). Focal lesions were noted in two cases and sellar-floor erosion in one case. A generally convex diaphragma sellae, with a gland height less than 10 mm (three cases) was considered normal [12]. One focal lesion seen with CT was not identified with MR, and was
Focal Sellar- Infundibulum Diaphragma Cavernous Optic
Floor Sellae Sinus Chiasm
Lesion
Erosion Abnormality
MR Cr- MR CT MR CT
Microadenoma:b
PRL (n
= 13)
3 6 1 4 3 2ACTH (n
=
4) 0 0 0 0 0 0Macroadenoma:
PRL (n
=
3) 0 0 1 3 2 2GH (n
= 1)
0 0 1 1 0 0Nonfunctioning (n
=
4) 0 1 3 4 2 2Total (n
=
25) 3 7 6 12 7 6• 12 patients with suspected microadenoma had normal MR and 10 others had normal CT images. bOne focal lesion on CT was opposite the microadenoma at surgery.
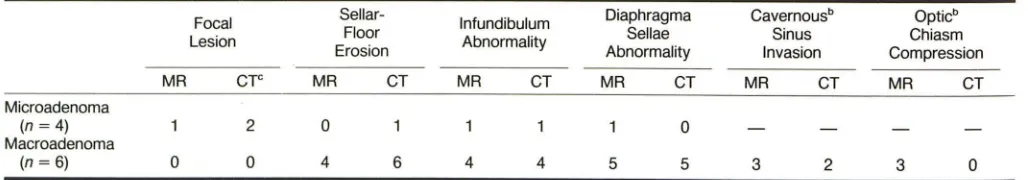
TABLE 2: Proven" Pituitary Adenomas: MR and CT Findings
Focal Sellar- Infundibulum
Lesion Floor Abnormality
Erosion
MR CTc MR CT MR CT
Microadenoma
(n =4) 2 0
Macroadenoma
(n = 6) 0 0 4 6 4 4
Abnormality
MR CT
2 0
1 0
3 3
0 0
4 4
10 7
Diaphragma Sellae Abnormality
MR CT
0
5 5
Invasion
MR CT
1 1 2 4 Cavernousb Sinus Invasion 0 1 1 2
MR CT
3 2
Compression
MR CT
2 0
0 0
4 0
6 0
Opticb
Chiasm Compression
MR CT
3
o
• Proof based on surgery or decreased mass on bromocriptine therapy. Two patients explored for suspected microadenoma with negative MR. CT, and surgical findings are not included. b Cavernous sinus invasion and optiC chiasm compression are not surgically proven owing to difficulty in visualizing these structures via a transsphenoidal approach.
[image:2.612.53.561.425.561.2] [image:2.612.50.564.622.712.2]opposite the site of a surgically proven prolactin microade-noma. The second focal lesion identified with CT was also identified with MR (Fig. 1), and was a surgically proven prolactin-secreting microadenoma containing a cyst from old hemorrhage. One patient with sellar-floor erosion on CT scan-ning had no abnormality on MR, and had an 8-mm midline microadenoma at exploration (Fig. 2). In one patient, MR showed focal bulging of the diaphragma sellae as the only imaging abnormality. This was not shown on CT, and surgery proved the patient to have an ACTH-secreting microadenoma. Two patients with normal MR and CT studies were strongly suspected of harboring an ACTH microadenoma, but had negative surgical exploration.
Eleven patients had CT and MR studies for a suspected microadenoma; however, they elected medical therapy or no treatment. The height of intrasellar contents for all patients in this category was less than or equal to 10 mm. In this group,
four focal lesions were identified with CT, yet only two were
A
B
Fig. 1.-A, Direct coronal CT after intravenous contrast shows hypo-dense midline focal lesion occupying most of intrasellar contents.
B, With T1-weighted sequence (spin-echo technique, TR 500, TE 30, 2.0-mm slice thickness), intrasellar contents are approximately isointense
Fig. 2.-Surgically proven midline 8-mm pro-lactin microadenoma could not be seen with CT or MR. Shown are a short TR image (TR 600, TE 30, 2.0-mm slice thickness) (A) and a long TR image (TR 1500, TE 50, 5-mm slice thickness)
(B) in this patient. The sellar floor sloped slightly
downward toward the right, a normal variant.
A
shown on MR. By MR, both were hyperintense relative to cortex on T2-weighted sequences. With T1 weighting, one was hypointense and one was hyperintense relative to cortex.
The remaining patients had intrasellar contents that were approximately isointense to cortex with both T1- and T2-weighted sequences, with normal CT and MR.
Eight patients were suspected of harboring a macroade-noma; of these, three had surgically proven macroadenomas and three had documented decrease in size of pituitary mass with bromocriptine therapy. In all six of these patients, intra-sellar masses were isointense with cortex with T1 weighting.
With T2-weighted sequences, one was hyperintense relative to cortex, four were isointense, and in one this imaging was unsuccessful due to motion. In one patient, CT identified a calcified adenoma, but on MR it was indistinguishable from the other macroadenomas studied (Fig. 3). MR and CT find-ings in these patients are charted in Tables 1 and 2.
In two patients, macroadenomas were evaluated with CT
c
with brain. Note noisy image due to thin collimation and short TR. C, With T2 weighting (TR 2000, TE 60, 5-mm cOllimation), surgically
proven adenoma is readily identified by its increased intensity compared
with cortex.
[image:3.612.54.565.307.489.2] [image:3.612.185.550.550.739.2]110 DAVIS ET AL. AJNR:8, January/February 1987
A
B
Fig. 3.-Calcified macroadenoma was identified by CT (A) in this patient with a prolactin level of 866 ng/ml. With MR, in spite of dense calcification,
the adenoma was indistinguishable from noncalcified adenomas. Shown
A
B
c
are a T1-weighted image (TE 30, TR 500, 2.0-mm slice thickness) (B) and a T2-weighted image (TE 30, TR 2000, S.O-mm slice thickness) (C).
c
Fig. 4.-Cavernous sinus involvement by macroadenoma is demonstrated in two cases.
A, Case 1. Intensity pattern in left cavernous sinus was identical to that of intra sellar mass and asymmetrical when compared with right cavernous sinus. Note displacement superiorly of optic chiasm by intra sellar mass.
B, Case 2. Right cavernous sinus appears involved by intrasellar mass based on both abnormal intensity pattern, compared with left, and displacement
laterally of ascending portion of cavernous carotid artery (arrow).
C, Involvement of right cavernous sinus correlated well with sellar asymmetry (arrow) on this axial 3-mm contrast-enhanced CT.
and MR, but there was no surgical or medical confirmation. Both were suspected of harboring nonfunctioning adenomas; both masses were isointense relative to cortex with T1 and T2 weighting.
Extension of adenoma into the cavernous sinus (Fig. 4) was suspected by MR in four patients, compared with two patients who were suspected of having cavernous sinus abnormalities by CT. Cavernous sinus invasion was not sur-gically confirmed due to inaccessibility of the cavernous sinus from a transsphenoidal approach.
Optic chiasm compression was identified convincingly in six patients with MR (Fig. 4). In several cases, chiasmal
compression was suspected with CT on the basis of size of the adenoma; however, the optic chiasm was not adequately defined with CT for confirmation.
Discussion
[image:4.613.55.568.87.270.2] [image:4.613.53.563.323.513.2]using a multiplicity of field strengths, slice thicknesses, and pulse sequences has been well demonstrated [13]. In that
series, the predominant signal from the intrasellar contents was isointense relative to brain on all pulse sequences eval -uated. The appearance of a pituitary adenoma on MR is largely unproven, particularly for smaller lesions.
For microadenoma evaluation, our preliminary data suggest that MR may not be as sensitive as CT for identifying discrete focal lesions within the minimally enlarged or normal-sized pituitary gland. This is not surprising, since an adenoma is a benign proliferation of a cell type normally found in the pituitary gland. As noted in prior CT studies [3, 4], an adenoma may
not result in anatomic abnormalities sufficient to distinguish it
from the surrounding pituitary gland. Indeed, in this series,
two surgically proven microadenomas showed no abnormality on MR. Focal bulging of the diaphragma sellae was seen
better with MR than with CT, but this is an infrequent abnor-mality. Identification of sellar-floor erosion was problematic with MR in patients with well-aerated sphenoid sinuses, due to the absence of signal from both air and calcium.
Sellar-floor abnormalities were more readily seen with CT.
Abnor-malities of the sellar floor with CT, however, lack specificity
for localization of microadenoma [11-18].
Anatomic abnormalities from mass effect of macroadeno-mas were seen with both MR and CT. As expected from our previous experience with CT, focal lesions were infrequently
identified in macroadenomas. Most macroadenomas in this series were isointense with cortex on T1- or T2-weighted sequences. The normal gland was indistinguishable from adenomatous tissue. As previously described for microade-nomas, sellar-floor erosion was better seen with CT than with MR. Abnormalities of the diaphragma sellae and pituitary infundibulum were equally apparent with both imaging tech-niques. Cavernous sinus invasion was suspected more often with MR than with CT, but it was not surgically proven because the cavernous sinus was surgically inaccessible from
a transsphenoidal approach. The optic chiasm and chiasmal
compression were well seen with MR, particularly with
T1-weighted sequences. With CT, chiasmal compression was suspected based on the extent of a large suprasellar mass; however, the chiasm itself is not commonly visualized without metrizamide.
With the exception of the three patients with identifiable focal lesions on MR, adenomas of all types were
radiograph-ically similar on MR and CT. No specific intensity pattern was present to distinguish adenoma from normal gland.
Although the appearance of parasellar and suprasellar masses has been described [19], the appearance of other
intrasellar masses by MR is not well known. Presumably, high
flow in intrasellar aneurysms would result in areas devoid of signal by MR, thus alerting the radiologist to this possibility. It is possible, however, that a densely calcified mass (i.e., intrasellar craniopharyngioma or adenoma) might resemble
an aneurysm on MR because of the absence of signal from calcium [20, 21]. Since the MR intensity pattern of meningi-omas is variable [22], an intrasellar meningioma might mimic an adenoma on MR.
In summary, MR and CT were approximately equivalent for
identifying and localizing macroadenomas. As with CT,
mac-roadenomas of secretory and non secretory types were similar in appearance on MR. The normal gland could not be
distin-guished from adenomatous tissue. For microadenoma
eval-uation in this small series, CT was more sensitive for
identi-fying focal lesions. Whether the superiority of CT for
micro-adenoma evaluation will persist as further refinements in MR
technique develop is uncertain. A decrease in slice thickness
on T2-weighted studies or use of paramagnetic contrast
agents may improve the sensitivity of MR for microadenoma
detection. MR has the inherent advantage of requiring no radiation or iodinated contrast; thus, MR may be the proce-dure of choice for identifying and following the macroadenoma
patient. At this time, however, CT remains the imaging
tech-nique of choice for patients suspected of having a
microade-noma.
ACKNOWLEDGMENT
The authors gratefully acknowledge the expert assistance of Fran -cine Hollowell and photographer Joe Jackson.
REFERENCES
1. Hemminghytt S, Kalkhoff RK, Daniels DL, Williams AL, Grogan
JP, Haughton VM. Computed tomographic study of hormone-secreting microadenomas. Radiology 1983;146:65-69 2. Syvertsen A, Haughton VM, Williams AL, Lusick JF. Computed
tomographic appearance of the normal pituitary gland and pitui-tary microadenomas. Radiology 1979;133:385-391
3. Davis PC, Hoffman JC, Tindall GT, Braun IF. Prolactin secreting pituitary microadenomas: inaccuracy of high-resolution CT im -aging. AJR 1985;144:151-156, AJNR 1984;5:721-726
4. Davis PC, Hoffman JC, Tindall GT, Braun IF. CT-surgical corre-lation in pituitary adenomas: evaluation of 133 patients. AJNR 1985;6:711-716
5. Hawkes RC, Holland GN, Moore WS, Corston R, Kean OM, Worthington BS. The application of NMR imaging to the evalu-ation of pituitary and juxtasellar tumors. AJNR 1983;4:221-222
6. Bilaniuk LP, Zimmerman RA, Wearley FW, et al. Magnetic
reso-nance imaging of pituitary lesions using 1.0 to 1.5 T field strength. Radiology 1984;153:415-418
7. Oot R, New PFJ, Buoanno FS, et al. MR imaging of pituitary adenomas using a prototype resistive magnet: preliminary as-sessment. AJNR 1984;5:131-137
8. Kaufman B. Magnetic resonance imaging of the pituitary gland.
Radiologic Clinics of North America 1984;22:795-803 9. Lee BCP, Deck MDF. Sellar and juxtasellar lesion detection with
MR. Radiology 1985;157: 143-147
10. Daniels DL, Pech P, Mark L, Pojunas KL, Williams AL, Haughton VM. Magnetic resonance imaging of the cavernous sinus. AJNR 1985;6:187-192
11. Wiener SN, Rzeszotarski MS, Droege RT, Pearlstein AE, Shafron M. Measurement of pituitary gland height with MR imaging. AJNR 1985;6:717-722
12. Swartz JD, Russell KB, Basile BA, O'Donnell PC, Popky GL.
High-resolution computed tomographic appearance of the intr a-sellar contents in women of child bearing age. Radiology
1983;147: 115-117
13. Mark L, Pech P, Daniels 0, Charles C, Williams A, Haughton V.
The pituitary fossa: a correlative anatomic and MR study. Ra
-diology 1984;153:453-457
112 DAVIS ET AL. AJNR:8, January/February 1987
Normal variants of the sella turcica. Radiology 1979;131 :99-104
15. Dubois PJ, Orr DP, Hoy RJ, Herbert DL, Heinz ER. Normal sellar variations in frontal tomograms. Radiology 1979;131 :105-110 16. Kricheff II. The radiologic diagnosis of pituitary adenoma. An
overview. Radiology 1979;131 :263-265
17. Taylor CR, Jaffe CC. Methodological problems in clinical
radiol-ogy research: pituitary microadenoma detection as a paradigm.
Radiology 1983;147:279-283
18. Raji MR, Kishore PRS, Becker DP. Pituitary microadenoma:
a radiological-surgical correlative study. Radiology 1981;139:
95-99
19. Lee BCP, Deck MDF. Sellar and juxtasellar lesion detection with
MR. Radiology 1985;157:143-147
20. Holland BA, Kucharcyzk W, Brant-Zawadzki M, Norman D, Haas DK, Harper PS. MR imaging of calcified intracranial lesions.
Radiology 1985;157:353-356
21. Oot R, New PFJ, Buonanno FS. MR imaging of pituitary adeno-mas using a prototype resistive magnet: preliminary assessment (abstr). Radiology 1985;154: 856
22. Zimmerman RD, Fleming CA, Saint Louis LA, Lee BCP, Manning JJ, Deck MDF. Magnetic resonance imaging of meningiomas.