Corporate Social Responsibility:
A review of Dutch Sustainability Reports
Master Thesis
Business Administration
Track: International Management School of Management and Governance Universiteit Twente
P.O.Box 217 7500 AE Enschede The Netherlands
Author:
Paulo dos Santos Calslaan 24 – 4 7522 MC Enschede The Netherlands
Telephone: + 31 61 470 2052
E-mail: p.j.dossantosjunior@student.utwente.nl
Supervisor Committee:
1st supervisor: Mr. D. Kensah
2nd supervisor: Dr. M. Asif
i
Acknowledgment
This master thesis is the outcome of several months of constant research on Dutch Sustainability
reporting practices. Although a master thesis is mostly a solitary project, its successful completion
would have been impossible without the support of several individuals to whom I express my
most sincere gratitude below.
Firstly, I am grateful to Dr. Kensah for his encouragement and guidance during difficult stages of
this project and to Dr. Asif for his availability and willingness to discuss improvements on the
thesis at any time. Secondly, I am also grateful to thank Mr. Silva not only for the scholarship
provided but also for relevant insights during the past year.
I would like to thank also my flatmates and friends for so many special moments spent together. I
could never forget my parents, sisters and nieces who introduced me a new meaning to the word
“family”. I feel honoured and grateful every day of my life for being part of this family. I also owe
special thanks to my lovely fiancé for her patience, help and unconditional support during the
period which great part of my time was pointed towards this thesis.
Enschede, March 2010
ii
Summary
The past twenty years has been marked by an increase in societal awareness of sustainability
issues. This increase in societal awareness has led to societal interest in the activities of firm’s. The
result is the emergence of an ongoing dialogue between firms and societal actors, whereby firms
communicate their sustainability practice and activities to society. Firms do so using an
instrument known as a Sustainability Report.
The practice of sustainability reporting using Sustainability Reports has evolved over the last
twenty years to become an important channel whereby firms disclose their sustainable practices.
In its infancy, Sustainability Reports primarily contained environmental issues. This has changed
over the years in the sense that Sustainability Reports also now include financial and social issues.
In spite of such developments, the practice of disclosing sustainability practice remains voluntary.
An implication of this voluntary practice is that little is known about factors that actually influence
the choice of what to disclose in Sustainability Reports.
This research examines this shortfall in the current understanding of sustainability reporting. To
that end, it is the objective of this thesis to assess the extent to which a firm’s resources
(employees, revenue and international operations) influence its reporting practices. This is
addressed in thirty two Sustainability reports from Dutch organizations using the methodology of
content analysis. To address the objective of examining the effect of firms’ resources on reporting
patterns, a comparison is made of companies of different sizes.
The outcome of this analysis shows that a firms’ reporting practice is not directly influenced by its
resources. Rather, it was observed that most of firms did not want to deal with sensitive issues
(such as bribery). It was further observed that firms did not indicate any future content of their
reporting practice.
This thesis thus concludes that sustainability practice, while it is intended to gear current business
practices toward a future orientation, is in fact merely an ongoing dialogue on current affairs. The
analysis found little evidence of the future orientation of current business practices. This is
thought to be due to the voluntariness of reporting, and a consequence of a framework to follow
in Sustainability Report. While the thesis sought to contribute to the literature on CSR with
regards to the extent to which firms resources have on their reporting practices, there was little
evidence to show that this was actually the case. The contribution of this thesis is that different
iii
Table of content
Acknowledgment ... i
Summary ... ii
Table of content ... iii
1 Introduction ... 1
1.1 Background ... 2
1.2 Research objective ... 4
1.3 Research question ... 4
1.4 Research strategy ... 5
2 Literature review ... 6
2.1 CSR history and concept ... 6
2.2 Sustainability report ... 8
2.3 Global Reporting Initiative ... 9
2.4 Previous research on Sustainability reporting practices ... 10
2.5 Research model ... 13
3 Research methodology ... 15
3.1 Sample selection ... 15
3.2 Content analysis ... 16
3.3 Data collection ... 17
4 Findings ... 19
4.1 General pattern of reporting... 19
4.1.1 Indicators ... 19
4.1.2 Sensitive Issues ... 23
4.1.3 CSR governance system ... 25
4.1.4 What to report ... 26
4.1.3 Third party assurance... 27
4.1.4 Board endorsement ... 28
4.1.5 Supply chain ... 29
4.1.6 Public policy ... 30
4.1.7 Time horizon ... 31
4.1.8 Awards and recognitions ... 32
4.1.9 Future directions... 32
iv
4.2 Effect of Size on Reporting Patterns ... 33
4.2.1 Total Revenue ... 34
4.2.2 Number of employees... 36
4.2.3 International operations ... 38
5 Conclusions ... 40
Bibliography... 43
Appendix 1 – List of firms according to their total revenue ... 47
Appendix 2 – List of firms according to their number of employees ... 48
1
1
Introduction
Sustainability is a global concern that entails the future orientation of current practices (Rattner,
1999). From the standpoint of a firm, this means that it is necessary to ensure that current
business practices do not negatively impact resource supplies for future generations. There has
been an increase in societal awareness to that end, giving rise to an increase in the pressure from
a variety of stakeholders (Primolan, 2004). The result is the emergence of ongoing dialogue
between a variety of actors and firms on the adoption of business practices that equally take into
account economic issues as well as environmental and social concerns (Elkington, 1994). The
practice whereby firms contribute in a society is essentially voluntary and is defined as corporate
social responsibility (CSR) (Carroll, 1991).
A major means by which firms address CSR is through the disclosure of sustainability related
initiatives to the general public and stakeholders (Davis & Searcy, 2010). This means of
communicating is known as sustainability reporting. It is a process whereby firms disclose their
economic, environmental and social activities to both stakeholders and the general public using a
publicized document. In keeping to societal awareness of sustainability issues, sustainability
reporting has gained in importance in the past couple of years through the use of an instrument
known as a Sustainability Report (Primolan, 2004).
A Sustainability Report is a type of publication that contains voluntary sustainable practices
embraced by a firm. There is evidence to show that firms use sustainability reporting for different
purposes. On the one hand, firm rely on the publication of a Sustainability Report as an important
channel for the maintenance of their ongoing dialogue on sustainability with their stakeholders
(Clarkson, 1995; KPMG, 2008). Firms engage with their key stakeholders in a dialogue to improve
their CSR activities as well as maximize the benefits obtained from those activities (Burke &
Longson, 1996). On the other hand, it has also been noted that sustainability reporting serves
other purposes for firms. Indeed, some authors have observed that Sustainability Reports have
become firms´ business cards whilst in others instances it is used as a tool to gain a competitive
advantage (Heikkurinen, 2010).
Irrespective of the reason for reporting on sustainability practices, the past two decades have
witnessed a boom in the number of firms that publicize their Sustainability Report. This boom has
nonetheless occurred voluntarily in the sense that CSR continue to be practiced in the absence of
2 qualitative and quantitative information sought by a target audience. This issue is well
acknowledged and has gave rise to academic work to investigate reasons why firms report in a
particular manner (Farneti & Guthrie, 2009), the content of their reports (Visser, 2002), the
quality of the data included in their reports (Skoloudis et al., 2010) and the trends among
reporting practices (Kolk, 2003). These studies however have failed to create a consensus on the
issue of diversity, due to the newness of Sustainability reporting practices. Therefore, little is
known about the issue of the diversity of and in reporting practices. It is therefore the objective of
this thesis to analyze the issue of diversity in the reporting practices, based on the effect that a
firms’ size has on their reporting practice.
In order to accomplish the above goal, this thesis has the following structure: In chapter one, an
introduction of corporate social responsibility (CSR) is given, from which the objective, problem
statement and research question are derived. This is followed by chapter two where the concept
of CSR is explained, taking into account the relevance of reporting. Therein previous studies
provide guidelines for the conduct of reporting and frameworks for the analysis of such reports.
This thesis examines reporting using such framework. The methodology for doing so is described
in chapter three where the research design is elaborated on along with the content analysis of
Sustainability reports. The findings of this analysis are presented in chapter four, from which
conclusions are drawn and summarized in chapter five.
1.1
Background
The importance of sustainability is influenced by factors such as the prominent lack of natural
resources, global warming and consumer awareness. According to Primolan, 2004, these are key
drivers that forces firms to adopt sustainable ways to conduct their business activities as a result
of the emergence of different stakeholders who are also aware of sustainability issue. In doing so,
firms they are supposed to pay more attention to the extent to which their long-term business
objectives and commercial continuity can be achieved through sustainable practices. Such firm
practices are voluntarily performed under the concept known as CSR, and the nature CSR practice
has changed over the years and continues to evolve in terms of the (i) the change in the nature of
communicating CSR; (ii) the content of the reporting of CSR; and (iii) the change to the number of
firms practicing CSR.
The changes to the nature of CSR are underscored by the manner in which firms communicate to
3 communication by firms to the maintenance of an ongoing dialogue though the disclosure by
firms of their CSR practices to the general public. This change is encouraged by increasing
stakeholder pressure that is a result of their awareness of sustainability issues (Burke & Longson,
1996).
The first Sustainability report contained a summary of a firm’s CSR practices and was created in
1989 (Kolk, 2004). Since then, sustainability reporting has evolved over the years with the help of
initiatives such as the Global Reporting Initiative (GRI), a non-governmental organization (NGO)
that seeks to improve the quality of sustainability reporting. Within the timeframe of twenty
years, Sustainability Reports have evolved from the inclusion of data concerning environmental
issues in the first report to cover social and financial aspects of sustainability practice in current
reports (Siltaoja, 2006).
It is not only the content of the reports that has changed, but the number of firms that practice
CSR or sustainability reporting has also become widespread. It is now estimated that sustainability
reporting is practiced by 71% of the firms included in the list of Fortune Global 250 in 2005 (Kolk,
2010). While this may draw attention to the fact firms size influences their willingness to
voluntarily report their sustainable practices, there is also a counterargument that show that the
practice is widespread and generally practiced. Indeed, there are a high number of companies
publishing Sustainability reports; approximately two thousand in the year of 2004 (GRI, 2010).
Due to the newness of CSR practice and constant changes of the nature of its practice, there is a
lack of a consensus on a lot of importance issues concerning the nature of CSR. Several studies
have been conducted to resolve such issues , these include studies that assess sustainability
reporting practices by looking into the relationship between firms clustered within the same
industrial sector and their reporting practices (Gallego, 2006; Langer, 2006); investigate reasons
why firms report in a particular manner (Farneti & Guthrie, 2009), the content of their reports
(Visser, 2002), the quality of the data included in their reports (Skoloudis et al., 2010) and the
trends among reporting practices (Kolk, 2003). However, such studies are diverse and thus fail to
create a consensus on a given issue. For example, there is little information regarding the extent
to which important factors such as a firm’s size affects their reporting practices.
The effect that firms’ size has on their reporting practice is currently inconclusive and remains
elusive. While 71% of firms list on Fortune Global 250 in 2005 (Kolk, 2010) reported their
4 found to be widespread and generally practiced; approximately two thousand in the year of 2004
(GRI, 2010). The lack of evidence on the effect that firm size has on reporting practice is the result
of an absence of comparison of firms’ size to see if there are any differences in their reporting
practice.
Given that CSR is communicated and reported publicly by a large number of firms, it becomes
possible to examine if there is any variation in the extent to which firm size has on reporting
practices. The focus of this study, therefore, lies in the analysis of the Sustainability reporting
practices by firms of different sizes. Therein, it is the objective to examine the existence of
patterns among the Sustainability reports due to a firms’ size. Size is here measured according to
firm’s total revenue; total number of employees; and international operations.
1.2
Research objective
Given that sustainability reporting practices are voluntary, firms are not obliged to report and
when they do report do so freely according to their chosen criteria. Although some level of
standardization among the reports can be found (mainly with regards to the inclusion of social,
financial and environmental activities within the reports), there is a wide range and variety of
known indicators that can be found in a firms’ description of their activities towards CSR.
This thesis uses the range and variety of known indicators that appear in their sustainability
reporting as a means to examine the extent to which a firm’s size influences its CSR. This is
achieved by comparing the firms that are localized in Europe and with less revenue against firms
that have high revenues and operate internationally.
The objective of this research is thus to look at the relationship between elements included in the
Sustainability reports and firms’ size. This entails an examination of whether the size of the firm
influences the range and variety of known indicators that can be found in a firms’ description of
their activities towards CSR; their Sustainability Report. The existence of patterns is assessed
among firms of a similar size.
1.3
Research question
Based on the objectives discussed above, the research question for the thesis is formulated as
follows:
5 To answer this question, the relationship between size and sustainability reporting practices of
firms is examined in the disclosure by firms of their sustainability practice.
1.4
Research strategy
With the purpose of accomplishing the objectives and answering the research question presented
above, the thesis follow the processes of first conducting an extensive literature review on
sustainability reporting practices. From the literature review, it was possible to identify known
items in Sustainability Report and why certain methodologies are employed in the assessment of
such items. This review also served to identify gaps in the previous literature, namely the issue of
firm size. The assessment also provided the most suitable method to undertake this study;
content analysis. Finally, a preliminary analysis was also conducted to determine and select the
firms that are most suitable for the empirical analysis. The selection of firms was based on the
availability of Sustainability Reports and the possibility to find further information from other
6
2
Literature review
This chapter starts with an introduction on CSR and how this concept has evolved since its origin
back in 1938. This is followed by a discussion on Sustainability report, an instrument used by firms
to communicate their sustainability practices. The origin and evolution of Sustainability Report
over the years is also discussed, together with it has been shaped by the Global Reporting
Initiative (GRI), a non-governmental organization (NGO) that seeks to improve the quality of
sustainability reporting. The importance of GRI, the most relevant framework for sustainability
reporting, is introduced and its relevance is also discussed. The chapter ends with a review of
previous studies, their conclusions and the presentation of the research framework.
2.1
CSR history and concept
The true beginning of CSR practice is unknown. Carroll (1999), one of the most renowned
researchers in this field, argues that the first voices claiming for CSR in the literature dates back
from 1938, when Chester Barnard launched “The function of executives”. The responsibility for
CSR at that time rested on the attitudes of businessmen towards society. Carroll (1999) asserts
that in the year of 1953, when “Social Responsibilities of Businessman” by Howard R. Bowen was
published, CSR became part of corporations’ responsibility rather than something that was carried
out only by businessmen. The following three decades saw an increase in the number of studies
on CSR. Yet, it was only in the 1990s, when Carroll (1991) and Elkington (1994) contribution to the
dissemination of CSR theories that focus on firms, did CSR reach the mainstream literature.
Carroll (1991) presented the famous pyramid (figure 1) of corporate social responsibility, where
four elements are suggested to constitute CSR: Economic (firms must be profitable); Legal (firms
must obey the law and play according to the rules); Ethical (firms must do what is right and avoid
[image:12.595.183.396.588.695.2]harm); Philanthropic (firms must be a “good citizen” and contribute to a better society).
7 John Elkington was another important scholar who helped to disseminate more theories to
improve CSR practices. In 1994, he coined the famous term triple bottom line (TBL), which means
that firm’s activities should encompass financial, social and environmental aspects. Shell was the
first firm to adopt this term by adapting the TBL to what they called “3 Ps”, people (social aspect),
planet (environmental aspect) and profit (financial aspect) in its first non-financial report
(Henriques & Richardson, 2004).
Also during the 1990s, stakeholders gained special attention in the literature in practice and
became key factors to be incorporated in firms’ CSR practices (Carroll, 1991; Burke & Longson,
1996). Clarkson (1995) defines stakeholders as “… persons or groups that have, or claim,
ownership, rights, or interests in a corporation and its activities, past, present, or future. Such
claimed rights or interests are the results of transactions with, or actions taken by, the
corporation, and may be legal or moral, individual or collective” (Clarkson, 1995, p. 106). The
stakeholders can be either internal (shareholders, employees and trade unions) or external
(suppliers, government, customers, civil society, competitors and local community). Burke &
Longson (1996) have encouraged firms to seek their key stakeholders and engage with them in a
dialogue in order to improve their CSR activities as well as maximize the benefits obtained from
those activities. This “stakeholder dialogue” helps firms to improve the process of
decision-making by establishing a two-way channel seeking for resolution of shared concerns towards CSR.
As a result, firms enjoy “…reputation benefits; impact of reputation on share price; increase in
staff pride and in loyalty to the company; competitive advantage in the (international) market
place; improved internal data collection and reporting systems; and, improved social and
environmental performance” (Adams & Frost, 2008, p. 299).
Currently, it can be said that CSR has become a large and comprehensive concept where firms
need to contribute on a voluntary basis to both the environment and society and at the same
time be ethical and profitable, and all these aspects are highly influenced by key stakeholders.
With the current over-reach of communication channels, an increase in stakeholder awareness
and the pressures they assert, the need to communicate a firm’s activities concerning CSR has
risen considerably (Morhardt et al., 2002). In order to fulfill this need, companies are producing
the Sustainability reports, a channel whereby they can provide stakeholders with their CSR
8
2.2
Sustainability report
The number of firms that are willing to expend resources to compile information and create
Sustainability Report increases per year and is set to rise. Such firms vary in size and also in terms
of the display of range and variety of known indicators that can be found in a firms’ description of
their activities towards CSR (Kolk, 2010; GRI, 2010).
The practice of voluntarily reporting on activities towards CSR started back in 1989, when the first
non-financial report was launched (Kolk, 2004). The pioneering report was released by Kodak, and
was brought to the attention of the general public as a summary of activities regarding the firm’s
environmental practices in the previous two years of its publication. Since then, the Sustainability
report has changed substantially and the range and variety of indicators that are included has
significantly broadened to cover the three aspects included in the TBL (Palenberg et al., 2006).
In fact, Kolk (2010), one of the most renowned authors when it comes to Sustainability reporting,
claims that nowadays in order to be called “Sustainability report” a report must cover all the
aspects presented in the TBL. Any report missing one or more aspects cannot be labeled as such.
For countries such Sweden, Norway, France and the Netherlands, the environmental aspect of
their disclosure is in some cases required by law (Kolk, 2005); therefore, the firms must fulfill this
requirement in order to obtain or continue the license to operate.
Firms have become more aware of the distinction (at least the largest ones) between following
legal obligations and voluntary practices, given that 71% of the non-financial reports publicized by
the firms included in the list of Fortune Global 250 in 2005 cover all the three aspects of the TBL.
Fulfilling this requirement and criteria of what constitute a Sustainability report has increased
from 15% in 2002 to the current 71% (Kolk, 2010). Multinationals like Shell, Coca-Cola, Unilever,
Procter and Gamble are few examples of firms publicizing their Sustainability reports instead of
merely relying on environmental or social reports.
However, voluntariness is an essential element of CSR practice, which leaves firms with the tricky
decision on what facts and figures must be included in their reports. In contrast to other types of
reporting, such as financial reports, where firms are obliged by regulation to provide a certain
kind of information e.g. statement of income and cash flows, the sustainability reporting
essentially lacks regulation. The result of this voluntariness is a divergence among reporting
practice, which leads to difficulties in benchmarking, comparison or drawing inferences. In order
9 both qualitative and quantitative data included in the Sustainability reports, the Global Reporting
Initiative (GRI) was created.
2.3
Global Reporting Initiative
The end of the 1990s experienced a boom in the number of firms that decided to make their CSR
activities public (Kolk, 2004; Waddock, 2008). Although these reports presented important data related to firms’ activities towards CSR, there was the lack of a standardized practice regarding
their content (Kolk 2004). As a result, firms reported according to their own interests and the
publicized reports for the most part lacked qualitative and quantitative data sought by a target
audience.
With the aim to improve the Sustainability reporting practices, the GRI was established in 1997
(Hedberg & Malmborg, 2003). GRI was intended to provide guideline and a list of comprehensive
indicators to be included in sustainability reports; indication of what was considered relevant to
firms (independent of the industrial sector, nationality or size). After a few years of its set-up, in
the year 2000, the first set of guidelines (G1) was published and fifty firms adopted the GRI
guidelines in their Sustainability Reports (GRI, 2010). Since then, the number of registered firms
using the GRI guidelines has increased to more than one thousand and three hundred (GRI, 2010).
According to Palenberg et al. (2006), in 2004 the number of firms producing Sustainability reports
(either in accordance or not with the GRI guidelines) reached a total of one thousand and nine
hundred. The set of guidelines has been updated twice and the latest (currently in use) set of
indicators is the G3, launched in 2006 (GRI, 2010).
All of these numbers support the theory that GRI has become the most influential framework in
shaping Sustainability reports (Etzion & Ferraro, 2006). According to Brown et al. (2009) two
elements have been the key drivers of the GRI’s triumph. The first element is timing. The GRI
guidelines took off at the same time when companies started to focus their attention on a more
sustainable business model. The second element refers to its revolutionary framework. Brown et
al. (2009) argue that GRI framework is a win-win solution for shared problem of information
management with an efficient gain for all actors with a one-size-fits-all approach. In other words,
the GRI innovative approach towards all of the actors included in this cluster (NGOs,
Governments, firms and stakeholders) benefits all of them by acting as a channel connecting them
10
2.4
Previous research on Sustainability reporting practices
After examining the origins of CSR, why sustainability reports is practiced by firms’ and the
influence of GRI on such reporting practice, the subsequent studies in the literature are devoted
to assessing Sustainability Reports themselves (Kolk, 2003; Gallego, 2006; Langer 2006; Daub,
2007; Vormedal & Ruud, 2009). There are five key studies (examining Sustainability reporting
practices) that were conducted in the last ten years. Four of them are country-specific and are
limited to the European developed economies. The only exception is an article devoted to the
assessment of how sustainability report practices is addressed by the 250 biggest companies in
the world (according to the Global Fortune list). This indicates that practices are embedded within
the richest companies and access to or possession of resources is essential to the development of
best practices. A summarized version of these studies is presented in the form of a table at the
end of this chapter; Table 1.
Study 1: Trends in sustainability reporting by the Fortune Global 250. (Kolk, 2003).
Kolk (2003) investigates the scenario of non-financial reports of the 250 largest companies in the
world (according to Global Fortune list) between 1998 and 2001. The author found that the
number of companies publicizing reports including financial, environmental and social aspects
(TBL) has increased considerably. The author also points out that small countries like Switzerland
and the Netherlands have a high number of firms making their CSR activities public. As a final
remark, the author refers to an increase of the standardization among the non-financial reports.
Due to projects like the GRI guidelines, most of non-financial can be labeled as Sustainability
reports.
Study 2: Comparability of Sustainability Reports. A comparative content analysis of Austrian
sustainability reports. (Langer, 2006).
Langer (2006) explores Sustainability reports within Austrian medium-sized companies as well as
multinationals. A content analysis and also a survey were employed by the author to conduct this
research. The result indicates that the content of the reports is shaped according to firms’
particular issues and predilections. Therefore, benchmarking among multinationals and Austrian
firms was not possible. However, the author found convergence in reporting patterns among
industries within the industrial sector. The author also found out that GRI guidelines are
considered by Austrian managers the most influent aspect to shape the structure and content of
11 Study 3: The use of economical, social and environmental indicators as a measure of sustainable
development in Spain. (Gallego, 2006).
Gallego (2006) addressed her study to portray the main features of the Spanish Sustainability
reports. Through a content analysis, it was verified what elements are reported. The author
developed a checklist based on GRI guidelines to check the main indicators used by firms included
in the IBEX-35 (stock market index listing the thirty five most liquid companies in Spain) to check
financial, environmental and social figures. As an example, the author observes that 100% of the
companies included the breakdown of workforce in the social section of their reports. The final
conclusion exposes similarities among the reports of companies within the same industrial sector.
Study 4: Assessing the quality of sustainability reporting: an alternative methodological
approach. (Daub, 2007).
An examination of Sustainability reports within Switzerland is the central focus of Daub (2007).
The author carried out a quantitative and qualitative analysis along with semi-structured
interviews to understand the reporting practices in that country. The sample was derived from a
list that included the 100 largest companies (by turnover). The GRI guidelines were used as a base
to create a checklist to examine the reports. Each element determined received a score varying
from zero (when the topic was not mentioned) to three (full information available). As a result, he
pointed out companies´ high awareness to stakeholders (Maon et al., 2009) and that companies
often fail to incorporate available sustainability data to the reports. Firms argued they do not
want to be perceived as “too social”. During the data collection, Daub (2007) decided to assess
not only the non-financial reports but also any kind of non-financial data displayed on company’s
web site, magazine or newspaper.
Study 5: Sustainability reporting in Norway – an assessment of performance in the context of
legal demands and socio-political drivers. (Vormedal & Ruud, 2009).
Vormedal & Ruud (2009) examined the situation of the Sustainability reports in Norway.
Following Daub (2007), they also decided to score the reports. The scoring system ranged from
zero (when the aspect was not mentioned) to four (very satisfactory). It is relevant to mention
that the study split the reports in two groups. The first contained mandatory reports (only
financial reports) while the second only voluntary reports (both financial and non-financial
reports). To conduct the assessment of the reports, the author made use of different
frameworks. Mandatory reports were checked based on the “Norwegian Accounting Act”; on the
12 consultancy company specialized in sustainability affairs). The conclusion stresses that
non-financial reports in Norway are surprisingly inconsistent with the SustainAbility framework.
Furthermore, only 10% of the companies that publish environmental reports are in accordance
with the law. The authors consider the Government as responsible for this due to the lack of both
clear regulation and framework with regards to Sustainability reports.
These five studies provide a relevant background to undertake an assessment of the Sustainability
reports. All of these authors established the importance of having the appropriate criteria to
perform the sample selection. In most cases, the sample includes top class companies or the
richest companies in the respective countries; as a result, the sample provides the companies
with more resources to have the best CSR practices. Moreover, it can be concluded that there is
no unique or definitive approach to assess the reports. The scoring system used and types of
documents assessed vary greatly from study to study.
Author Research
Methodology
Conclusion
Kolk, 2003 Content analysis The increase of standardization due to GRI framework; TBL becomes the foundation upon which the
Sustainability reports are based on.
Langer, 2006 Content analysis & survey
Divergent practices among Austrian and multinationals; Similarities were found only within medium-sized Austrian and multinationals of the same industrial sector.
Gallego, 2006 Content analysis Likewise Langer (2006) similarities can be found within reports of the same industrial sector.
Daub, 2007 Content analysis & interviews
Divergence among the content of the reports;
Companies fail to incorporate sustainability data to the reports.
Vormedal &
Ruud, 2009
Content analysis Reports are not-consistent with the framework they adopt;
[image:18.595.74.506.335.731.2]13
2.5
Research model
It can be concluded from the literature review that the origins of CSR, it’s practice by firms and
the development of best practice is influenced by resources. Indication of the influence of
resources can be found in the localization of reporting practice; Country-specific and often limited
to developed economies (Kolk, 2003; Gallego, 2006; Langer 2006; Daub, 2007; Vormedal & Ruud,
2009). While the previous literature may point to practices embedded within the richest
companies located in developed economies, there is also evidence to show that sustainability
reporting is also practice by firms with limited resources (Kolk, 2010; GRI, 2010). In other words,
size effect remains a sticking point in the resource-dependent argument and there been no real
comparison of firms’ sizes to see if there are any differences in their reporting practice.
The research model thus looks at the effect of resources, based on indicators of size, and uses
measures for the assessment of the content of reporting practices according to the method of
content analysis. The model (Figure 2) is operationalized as: size is measured according to the
number of employees, firms’ revenue and extent of international operations; and reporting
practices and patterns is assessed by looking at the content of key areas of investigation that has
emerged over the years for the assessment of the content of sustainability reporting (Kolk, 2003;
[image:19.595.127.451.463.716.2]Gallego, 2006; Langer 2006; Daub, 2007; Vormedal & Ruud, 2009; Kolk, 2010; GRI, 2010).
14 Patterns were deduced using content analysis as a research method to reinterpret information in
Sustainability Reports (Moraes, 1999); methodologically conforming to the application field for
this type of study and the nature of the reading (Janeira, 1972) using the key areas on
investigation as developed in the Literature.
The key areas of investigation can be summarized as:
1) What indicators are used to describe sustainability dimensions?
2) Do companies address sensitive or corrective issues in the Sustainability reports?
3) Is there a formal CSR governance system? Is responsibility for CSR clearly defined? Who is
responsible for preparing Sustainability reports?
4) Is there information on how the company decides on what to include in reports?
5) Do Sustainability reports include third party assurance?
6) Do CEOs or board of management endorse the report?
7) Do companies specify their standards in managing CSR along the supply chain?
8) Are the reports linked to public policy goal setting?
9) Are the sustainability reports published on annual basis?
10)Do companies mention sustainability awards and recognitions for their CSR practices?
15
3
Research methodology
The aim of this chapter is to present and describe the research methods employed during this
study. Firstly, an explanation on how the sample was selected is presented. This is followed by an
introduction on the research method employed in this study and a detailed explanation on how
the research was conducted.
The thesis suffers from the same problem as previous studies; the lack of a general accepted
framework. As a result, this research had to develop its own approach to undertake the
assessment of reports. This is however based on similar approach adopted by previous studies.
Such studies have either used a checklist of information to be assessed or a semi-structured
interview (Kolk, 2003; Gallego, 2006; Langer 2006; Daub, 2007; Vormedal & Ruud, 2009; Kolk,
2010; GRI, 2010). Over the course of time, it has emerged that reporting practices and patterns
can be assessed by looking at the content of key areas of sustainability reporting. This thesis
follows the same procedure, choosing a structured checklist as the best method to gather the
data needed. This decision was made because it is the purpose of this research to check what
elements are included in the Sustainability reports; therefore, it is the most suitable method to
collect the data.
3.1
Sample selection
In order to undertake the research, the first step was to define the sample to be assessed. With a
clear focus to compare firms of different sizes according to their total revenue, number of
employees and international operations, the first goal was to obtain a list of firms that publicize
their Sustainability Reports. After an extensive preliminary study, the GRI database was chosen as
the source to obtain such a list. This is because of two reasons. The first is that the GRI has its
framework based on the TBL, which is in line with the definition of Sustainability report developed
by Kolk (2010) and presented in chapter two. The second is the fact that GRI is the most
important and influential framework for Sustainability reports (Etzion & Ferraro, 2006).
On its web site (http://www.globalreporting.org), the GRI offers a list of companies that publicize
Sustainability Reports according to the GRI framework. To allow for a comparison of size, a
distinction was drawn between the location of firms’ operations, number of employees and total
revenues. In the case of this study, which was conducted from the Netherlands, it is worth
mentioning that the firms were Dutch and what constituted “Dutch” was defined as a company
16 firms that were selected were based in the Netherlands, but were distinguished by the whether
their operations were localised to the Netherlands, The European Union, or globally according to
the number of continents. According to these criteria, the firms’ websites also served as a source
of information to scan for further information. This was done for all the firms that were
indentified from the preliminary study.
The use of GRI as a criterion for the sample selection proved to be very efficient in the sense that
it gave the research a broader scope across different sectors, size, etc. This is due to the fact that
the GRI frameworks can be adopted by any company independently of any of those factors (GRI,
2010).
The preliminary study gave rise to the first samples, which included forty reports. However, due
to language constraints, only reports in English were analyzed. Hence, seven reports (17% of the
previous sample), only available in Dutch, were excluded, generating a number of thirty three
reports. One report had to be excluded because there was no further information related to the
firm’s size to be found. Therefore, the final sample included a total of thirty two reports; 31 from
2009 and one from 2008.
3.2
Content analysis
To appropriately assess the Sustainability Reports, the methodological approach employed
throughout the study was content analysis. This is a tool to assess the content of non-financial
reports and for the purpose of content validity (Moraes, 1999). This study followed a similar
approach as previous studies (Kolk, 2003; Gallego, 2006; Langer 2006; Daub, 2007; Vormedal &
Ruud, 2009; Kolk, 2010; GRI, 2010).
The methodology of content analysis allows the description and interpretation of the content of
all sorts of documents and texts; i.e. articles, reports, entire books, newspapers, and so on. This
serves the purpose of permitting a systematic analysis of descriptions, for qualitative or
quantitative purposes, and helps to reinterpret messages in order comprehend their meaning at a
level that goes beyond the normal reading (Moraes, 1999). As an investigation method, it entails
the use of special procedures to process data and thus serves as a tool and a practical guide for
the action, to tackle the diversity of matters and issues investigated (Janeira, 1972).
As a practical guide for action in the description and interpretation of data, content analysis was
17 reports. This was done by looking at the content of key areas of investigation that has emerged
over the years for the assessment of the content of sustainability reporting (Kolk, 2003; Gallego,
2006; Langer 2006; Daub, 2007; Vormedal & Ruud, 2009; Kolk, 2010; GRI, 2010).
These key areas of investigation can be summarized as:
A) What indicators are used to describe sustainability dimensions?
B) Do companies address sensitive or corrective issues in the Sustainability reports?
C) Is there a formal CSR governance system? Is responsibility for CSR clearly defined? Who is
responsible for preparing Sustainability reports?
D) Is there information on how the company decides on what to include in reports?
E) Do Sustainability reports include third party assurance?
F) Do CEOs or board of management endorse the report?
G) Do companies specify their standards in managing CSR along the supply chain?
H) Are the reports linked to public policy goal setting?
I) Are the sustainability reports published on annual basis?
J) Do companies mention sustainability awards and recognitions for their CSR practices?
K) Do firms describe the future directions of the report focus?
3.3
Data collection
Following the definition of sample and the methodology to assess the content of reports, this
section presents how the rest of the research was conducted. Firstly, each of 32 suitable samples
report determined from the preliminary study, the final sample, was scrutinized based on the
checklist presented above. The final samples were organized according to size measures. The
results of this organization are presented in the form of tables along with quotations extracted
from the reports to provide the reader with a better understanding on how the author conducted
the research. These provide a general overview of the Sustainability reporting practices of Dutch
18 The next step was to develop tables where firms were distinguished according to their size. In
order to do so, it was necessary to create three charts. The first chart, referred to as total revenue
chart, contains the firm’s total revenue. The second chart contains the number of employees,
whilst the last one contains the number of continents where the firm operates. Additional
information included in the charts was collected from either the company’s website or its annual
report.
- Size chart # 1 lists firms from highest to lowest total revenue;
- Size chart # 2 lists firms from highest to lowest net income;
- Size chart # 3 lists firms from highest to lowest number of continents where the firm
operates.
[Please refer to the charts in the Appendix]
In order to look for patterns among firms of different size, firms were clustered into groups. The
first two charts divided firms into three groups (large, small and medium) and listed them in
descending order according to their total revenue and the number of employees. The last chart
(international operations) follows the same structure and is also available in descending order.
However, the firms are clustered into five groups according to the number of continents where
the firm operates.
After the completion of all the three charts, graphs were plotted to illustrate the relation between
19
4
Findings
This chapter presents an interpretation of the content analysis on key areas of investigation
presented in the chapter three. To relate the effect of size on reporting pattern, the results for the
analysis is divided into two parts. Firstly, the general reporting pattern is described for each key
area of investigation. This is presented according to both the numbers of reports and percentage
from the total sample assessed that reported on an area of investigation. Each key area is also
illustrated by extracts from the reports.
In the second part, the effect of firm size is linked to reporting patterns. Size is measured
according to firms’ total revenue, number of employees and international operations. The effect
that these have on reporting pattern is deduced from the key areas of investigation to determine
the influence of size on reporting practices. Of the 11 key areas of investigation, one in particular
(key area “indicators”) showed a tremendous divergence in the way it was reported in the 32
reports. This divergence was expected as the number of items contained in Sustainability reports
continues to rise year by year (Siltaoja, 2006). While the sheer number of items in the list did not
permit a thorough analysis, indications of size was deduced from the indicators and a comparison
was made thereof to other key areas of reporting practices. In other words, the key area
“indicator” was used to deduce proxies of size- number of employees, firms’ revenue and extent
of international operations.
4.1
General pattern of reporting
4.1.1
Indicators
What indicators are used to describe sustainability dimensions?
The assessment of this key area follows the GRI guidelines. The guidelines specify indications
according to the triple bottom line dimensions (Elkington, 1994): financial, social and
environmental information. Information on these three dimensions was assessed using the
methodology of content analysis in all the reports (Refer to Chapter 3). The results (Table 4)
shows that the indicators used to describe firms’ activities towards every dimension vary
tremendously from report to report.
The financial dimension had 89 different indicators among the reports and less than half
of these indicators appear in more than one report. These indicators are, in general,
industry specific, e.g. number of retail lease contracts and volume of milk processed.
20 firms was the result before tax. This indicator was found in 11 reports, (33 percent of the
totals) and was followed by the firms’ net results and total revenue (present in ten
reports). Operational cash flow and total income are presented in a high number of
reports (eight times each). The complete list of indicators can be found in Table 2.
financial indicators frequency financial indicators frequency financial indicators frequency
result before tax 11 barrels produced per day (NC) 1 annual retail income 1
net results 9 capital and reserves 1 portfolio value retail 1
Revenue 9 value creation 1 audit FEE 1
operational cash flow 8 group equity as % of assets 1 fraud prevention 1
total income 8 volume of milk processed 1 shareprice (Eur) at the year end 1
operating result 7 volume of milk supplied by members
1 market capitalisation at the year end
1
earnings per share 7 value of new business 1 payments to governments 1
net Sales 4 total assets under management 1 economic value retained 1
number of employees 4 total SRI assets under management 1 order intake 1
operating costs 4 SRI as % of total assets 1 gross investments in heat grids (€ million)
1
total assets 3 purchase of goods and services 1 percentage of shareholders ownership
1
balance sheet 3 ITDA 1 joint ventures and other participations
1
turnover 3 capital expenditure 1 payment to shareholders 1
shareholders' equity 3 net debit 1 total capitalization 1
total amount donated 3 % of eco-premium solutions sales 1 return on capital employed (%) 1
total sales 2 market share 1 return on equity 1
gross profit on sales 2 long-term debt 1 dividend cash flow 1
total dividend per share 2 petabytes memory per 1 million EUR ASML sales
1 training expenditure 1
employment expenses (sSalaries) 2 amortization of in-process of R&D costs
1 solvency (%) 1
r&d investments, costs, net of credits 2 SG&A costs 1 return on average equity (%) 1
employees wages and bennefits 2 number of shopping centers 1 interest cover 1
payment to providers of capital 2 gross leasable area (m2) 1 Loans 1
community investments 2 footfall (million EUR) 1 number of depository receipt holders
1
order booked 2 occupancy rate retail 1 funds entrusted 1
equity 2 number of retail lease contracts 1 number of accounts 1
shareholder return 1 pipeline add. M2 1 funds under management 1
exploration resource additions 1 gross rental income 1 total assets under management 1
key projects -post final investment decision
1 net service charges 1 major shareholders (%) 1
% of world's oil and gas production 1 property operare expenses 1 geographical spread of shareholders
1
[image:26.595.59.524.161.675.2]total capital investment (NC) 1 net retail income 1
Table 2: financial indicators
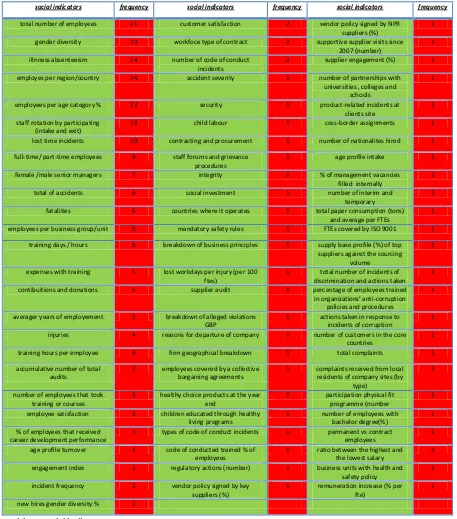
With regards to the social dimension, 76 different indicators were present in the sample
21 employees, included in 21 reports or 64 percent of the total. The second most reported
indicator was gender diversity, included in 19 reports, followed by number of employees
per region and illness absenteeism, both presented in fourteen reports.
social indicators frequency social indicators frequency social indicators frequency
total number of employees 21 customer satisfaction 2 vendor policy signed by NPR suppliers (%)
1
gender diversity 19 workfoce type of contract 2 supportive supplier visits since 2007 (number)
1
illnness absenteeism 14 number of code of conduct incidents
2 supplier engagement (%) 1
employes per region/country 14 accident severity 1 number of partnerships with universities , colleges and
schools
1
employees per age category % 13 security 1 product-related incidents at clients site
1
staff rotation by participating (intake and exit)
13 child labour 1 coss-border assignments 1
lost time incidents 10 contracting and procurement 1 number of nationalites hired 1
full-time/ part-time employees 9 staff forums and grievance procedures
1 age profile intake 1
female /male senior managers 7 integrity 1 % of management vacancies filled internally
1
total of accidents 6 social investment 1 number of interim and temporary
1
fatalities 6 countries where it operates 1 total paper consumption (tons) and average per FTEs
1
employees per business group/unit 6 mandatory safety rules 1 FTEs covered by ISO 9001 1
training days / hours 6 breakdown of business principles 1 supply base profile (%) of top suppliers against the sourcing
volume
1
expenses with training 5 lost workdays per injury (per 100 ftes)
1 total number of incidents of discrimination and actions taken
1
contibuitions and donations 5 supplier audit 1 percentage of employees trained in organizations’ anti-corruption
policies and procedures
1
averager years of employement 5 breakdown of alleged violations GBP
1 actions taken in response to incidents of corruption
1
injuries 4 reasons for departure of company 1 number of customers in the core countries
1
training hours per employee 4 firm geographical breakdown 1 total complaints 1
accumulative number of total audits
3 employees covered by a collective bargaining agreements
1 complaints received from local residents of company sites (by
type)
1
number of employees that took training or courses
3 healthy choice products at the year end
1 participation physical fit programme (number
1
employee satisfaction 3 children educated through healthy living programs
1 number of employees with bachelor degree(%)
1
% of employees that received career development performance
3 types of code of conduct incidents 1 permanent vs contract employees
1
age profile turnover 3 code of conducted trained % of employees
1 ratio between the highest and the lowest salary
1
engagement index 2 regulatory actions (number) 1 business units with health and safety policy
1
incident frequency 2 vendor policy signed by key suppliers (%)
1 remuneration increase (% per fte)
1
[image:27.595.63.520.142.661.2]new hires gender diversity % 2
Table 3: social indicators
A small number of reports (seven) reported on the number of women in senior management
positions. Some other aspects like ratio between highest and lowest salary, number of employees
22 report. The indicators that appeared in a single report represented 60 percent of the total number
of indicators related to the social aspect. The complete list can be found below in Figure 5.
The last dimension, the environmental dimension, was represented by 68 different
indicators and only 23 of them (thirty four percent of the total) appeared in two or more
reports (Table 4). The most common indicator is CO2 emissions, and was presented in 27
reports (85 percent of the total). Energy consumption is also a very common indicator
included in the reports, it appears in 20 of them and it is followed by total waste,
presented in 17 reports and water consumption, (presented in thirteen reports).
enviromental indicators frequency enviromental indicators frequency enviromental indicators frequen cy co2 emissions 27 investments in alternative energy (NC) 1 total VOC emissions and per
ton production
1
total energy consumption 20 % of suppliers that signed up sustainability safeguards
1 nox emissions and per ton production
1
total waste 17 waste water treatment plants Africa & Middle East Region
1 sO2 emissions 1
water consumption 13 production units with water consumption higher than 7 helictolitres of water per helicolitre
beer + soft drinks + cider
1 total Sox emissions and per ton production
1
green house gas emissions 8 environmental and safety complaints 1 r&d investment in green products (%) of total
1
eletricity consumption 7 carbon emissions 1 investments in renewable energy capacity (eur)
1
paper consumption 7 hazardous-non reusable waste and per ton production
1 sources of heat for supply to customers
1
co2 emissions by source 4 operational carbon footprint for logistics (tons)
1 cooling water intake energy per production plants
1
recycled waste 4 charitable contribuition 1 production of renewable energy (GWH)
1
gas consumption 4 KWh purchased derived from wind, solar or water power
1 renewable production capacity installed (MW)
1
sites with ISO 14001 or OHSAS 18001 certification
4 business travel 1 investments in renewable production capacity (€
million)
1
fuel consumption 4 travelper average FTE (km) 1 fuel mix power production in (%) by type of fuel
1
carbon emissions 2 co2 emissions from air travel per employee
1 market share of "grey" and "green" products offered by
the company
1
other emissions 2 packaging footprint (by type) % 1 total supply of "green" products for customers and
small biz customers
1
source of green house gas emissions
2 environmental prosecutions & fines (number)
1 annual supply of "green" products
1
spills and discharges 2 ozone-depleting potential kg/ton of production
1 total net production of electricity and heat (TWh/Pj)
1
water discharge (m3) 2 lease cars by energy label in the Netherlands
1 reduction of soot emission 1
purchased eletricity 2 materials usage 1 total birds incidents 1
use of recycled paper (% of total) 2 type of energy 1 frequency of service interruption
1
Flaring 1 certified organic products at the year end
1 commuting per means of transport (% of total)
1
energy intensity 1 leakage of refrigerant substances per volume (tons)
1 total co-workers (fte and externals)
1
acid gases and VOCs 1 leakage of refrigerant substances efficiency (as a % of total refrigerants)
1 buildings (surface m2 and volume in m3)
1
[image:28.595.66.515.252.733.2]ozone depleting emisisions 1 % of sites with sustainable fresh water 1
23 Other indicators such as those relating to financial aspects, due to their specificity (e.g. total
number of incidents with birds (Schiphol Group, 2010), could not be addressed in all reports. This
was because the indicator was not same for all the firms. Indicators that were similar for the
sample of firms included for example production of renewable energy. While this could be
reported, most of the firms were found to leave this out of their reports.
The results indicate an inconsistency in the manner of reporting and in particular the labelling of
items that were reported. For example, an item that is considered an environmental indicator in
one report could also be considered social indicator in another report. An illustration of this
example is the case for the total paper consumption indicator, referred to as social indicator by
DHV while it is considered an environmental indicator by 7 reports (AEGON, ING, Delta Lloyd
Groep, Tennet, Triodo, Witteven+Bos and Wolters Kluwer).
4.1.2
Sensitive Issues
Do companies address sensitive or corrective issues in the SRs?
Category number of reports % of total reports
sensitive issues 5 16%
The above result shows the presence of sensitive issues in reports and the percentage of firms
from the total sample that included this in their report. The result shows a very low number of
firms that are willing to discuss sensitive issues in their Sustainability Reports. There were 5 firms
that were explicit on sensitive issues in their reports. These were: Shell, KPN, Nutreco, DHV and
EADS. This was expected because sensitive issues are difficult to present in reports and firms are
not expected by the GRI guidelines to publish this kind of information.
Shell is one of the few firms that discussed problematic issues of the past and also presented
actions that the firm had taken to resolve them. Two pages of the Shell report addressed issues in
Nigeria, where the firm faced security problems and issues related to oil spills. The report was
explicit on problem that arose between Shell and the families of the Ogoni activists, a problem
that resulted in the arrest and execution of activist by the Nigerian Government in 1995. The
activists, led by Ken Saro-Wiwa, conducted a pacific campaign against Shell. Their claim was
anchored on the local view of the non-sustainability exploitation of oil and gas in the Niger Delta.
24 of great concern. Their case was heard in court and a resolution was found in the end, as
presented in the extract below.
“In June, Shell reached a legal settlement with the families of Ken Saro-Wiwa, the Ogoni activist, and eight
others who were convicted and executed in 1995 by the military government. Although at the time both
Shell and SPDC tried to persuade the government of the day to grant clemency and avoid such a tragic
outcome… As part of the settlement Shell contributed funds towards the setting of an independent trust
fund for Ogoni people that will support initiatives in education and agriculture” (Shell, 2010, p. 23).
Unlike issues faced by Shell, which related to an entire community, sensitive issues was discussed
where they only related to the internal activities of the firm. For example, The KPN and Nutreco’s
Sustainability reports were reports that dealt with sensitive issues. Here, the issues related to the
sourcing andthe use of raw materials respectively.
With regard to the sourcing of raw materials, KPN states that although the firm does not play a
major role in the global market, it is also not willing to sell mobile phones that were made using
coltan (a scarce raw material used to manufacture phones). Their explicit position centres on the
avoidance of conflict in Africa, especially raw materials from Congo, where the mining of coltan is
a source of conflicts.
In the case of Nutreco’s, their report described an incident where the packaging of raw materials
in Poland caused a dust explosion and a small fire. After conducting an internal investigation on
the incident, the firm discovered that the reason for this incident was the use of an inappropriate
package. The firm therefore took action to avoid this from happening again and has set new rules
to make sure suppliers provide the material with the proper package and also provide their
personnel with more training. An extract from their report is presented below.
“Following the review, site personnel received extra training on handling fine particle materials and
the dangers of dust explosions” (Nutreco 2010, p. 44).
Two other firms’ also included how they have dealt with sensitive issues in their reports. These
firms were DHV and EADS. Both reports indicate some issues the firms dealt with during the
25 The general pattern from the results indicate that firms are typically not willing to disclose on
sensitive issues. When they do however, the reports tend to elaborate of how the firms have also
taken steps to resolve such issues.
4.1.3
CSR governance system
Is there a formal CSR governance system? Is responsibility for CSR clearly defined? Who is
responsible for preparing Sustainability reports?
Category number of reports % of total reports
CSR governance system 23 72%
A large number of reports presented information that was related and relevant to the CSR
governance system within firms. Firms perceive the need to clarify for stakeholders how CSR is
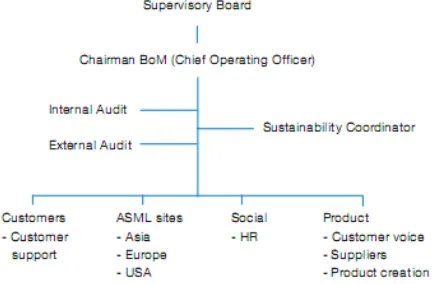
embedded within the organization. A good example of a report that explicitly provides the reader
with the firm’s CSR governance system is the one published by EADS. Here, the firm presented in
a clear manner a chart that was possible to understand on how CSR is structured within the
company using a figure called “Corporate Responsibility & Sustainability Organisation”. The figure
displays the departments and their roles concerning CSR. Another example was the ASML’s
report, which described the existence of a “Sustainability Board” responsible for setting and
following-up the targets and measuring the results (figure 3). Moreover, the ASML report
highlights the number of specialists (14) employed to monitor and manage “Sustainability issues”,
an indicator of their effort to ensure that their sustainability practice is not only reported but also
[image:31.595.184.400.563.705.2]implemented.
26 The remaining reports with information regarding CSR governance system follow a similar
approach, in the sense that the Sustainability reports offer statements on how CSR is structured
and explain how CSR is embedded into the firms’ structure. An example is the report publicized by
FrieslandCampina. FrieslandCampina (2010) offers a statement explaining how CSR is embedded
into the company’s structure. Besides indicating who the members of the CSR board are and their
functions within the board, it also describes the department responsible for CSR.
“FrieslandCampina’s CSR policy falls under the responsibility of the Corporate Environment &
Sustainability Department and the Corporate Social Responsibility Board. The Corporate Environment &
Sustainability Department reports to the Corporate Public & Quality Affairs Department and is responsible
for” (Friesland, 2010, p. 18).
In general there was a lack of consistence in the manner in which firms gave indication of their
commitment to CSR. Most of the reports showed how they use governance structures to support
the implementation of CSR within the firm. There was nonetheless little indication of how
![Figure 1: The pyramid of Corporate Social Responsibility [Source: Caroll (1999)]](https://thumb-us.123doks.com/thumbv2/123dok_us/1199335.643312/12.595.183.396.588.695/figure-pyramid-corporate-social-responsibility-source-caroll.webp)