Quantitative and Efficient Usability Testing
in High Risk System Development:
Under diversity of user groups
Quantitative and Efficient Usability Testing in High Risk System
Development
Under Diversity of User Groups
Master’s thesis
Author: Wendy Marijke Vos
Student number: s0189480
Date: April 20, 2011
Study: Master of Psychology Specialization: Cognition & Media Institution: University of Twente
Graduate Committee:
Prof. Dr. J.M.C. (Jan Maarten) Schraagen
TNO Behavioral and Societal Sciences
Dr. M. (Martin) Schmettow
Faculty of Behavioral Science
University of Twente
Drienerlolaan 5 7522 NB Enschede
TNO Soesterberg Kampweg 5
Abstract
Infusion pumps are involved in 30% of reported (irreversible) incidents on the ICU and OR, as being dynamic and complex environments characterized by high activity, cognitive strain, extensive use of technology, and time stress (Bogner, 1994). Most designated ‘causes’ involve a variety of user errors, materializing from poorly designed user interfaces. Through evaluation studies, it is widely recognized that poorly designed user interfaces do induce latent errors (Lin, 1998), and operating inefficiencies, even when operated by well-trained, competent users. In the current study, a prototype infusion pump was submitted to a quantitative and efficient usability evaluation test in which our goal was twofold. First, we wanted to gain reliable quantified insights into its safety level, shaped through usability testing and triage heuristics in data analysis. Second, we focused on the quality of the current design with regard to the origin of problems found and if designing for both user groups was possible, respectively using a list of ergonomical and cognitive design principles and problem distribution analysis. With respect to the first research goal, we established that, for reliable quantitative estimates (implementing confidence intervals and variance of defect visibility) of numbers of problems expected, one needs large sample sizes (n). With the use of the LNBzt model we established that even 34 participants did not render an 85% standard for D, as proposed by Nielsen. We only reached an 80% level. Only when eliminating possible false positives (making our data set more efficient) that we reached our goal of 90% for D. Further, by using heuristics, we showed that, contrary to current belief, ‘false positives’ occur when using Retrospective Task Analysis in testing, jeopardizing the high face validity of this method in usability testing. Removing false positives as not being usability problems after all, helped to make progress more favorable (efficient). As to the second research objective, based on Human Factors Engineering principles, we
concluded the current modular, split screen design to be a very good basis for further
Samenvatting
Infuuspompen zijn betrokken bij 30% van gemelde (onomkeerbare) incidenten op de IC en OK, beide dynamische en complexe omgevingen, gekenmerkt door een hoog activiteit- en cognitief niveau, uitgebreid technologiegebruik, en tijdsdruk (Bogner, 1994). Voornaamst aangewezen 'oorzaken' betreft verscheidenheid van gebruikersfouten, uitgelokt door slecht ontworpen user interfaces. Vanuit evaluatiestudies is erkend dat slecht ontworpen gebruikers-interfaces relateren aan latente fouten (Lin, 1998), niet onafhankelijk zichtbaar tijdens evaluaties, en aan operationele inefficiënties, ook bij bediening door goed opgeleide competente gebruikers. Ter voorkoming hiervan werd een huidig prototype infuuspomp onderworpen aan een kwantitatieve en effectieve usability evaluatie test met een tweeledige focus. Ten eerste het verkrijgen van betrouwbare inzichten in het veiligheidsniveau, gebruik makend van usability testing en triage heuristieken bij data analyse. Aanvullend is gefocust op de kwaliteit van het huidige design en op de mogelijkheid te komen tot één ontwerp voor beide betrokken gebruikersgroepen, hierbij gebruik makend van een lijst met cognitieve en ergonomische ontwerpprincipes en de
probleemdistributie tussen beide groepen. Resultaten toonden dat voor kwantitatief
Index
Abstract ... 3
Samenvatting... 4
List of tables ... 7
List of figures ... 8
1. Introduction ... 9
2. Method... 18
2.1 Usability Evaluation method... 18
2.2 Participants ... 18
2.3 Procedure... 19
2.4 Focus of study ... 20
2.5 Tasks... 21
2.6 Questionnaires... 21
2.7 Apparatus ... 22
2.8 Data Analysis ... 22
2.8.1 Coding data ... 22
2.8.1.1 Video and voice recordings... 22
2.8.1.2 Coding of post questionnaire ... 23
2.8.1.3 Post questionnaire issues related to coded problems ... 23
2.8.2 Survey for ‘definitely not usability problems’... 23
2.8.2.1 Triage CTA ... 24
2.8.2.2 Triage Questionnaires ... 25
2.8.2.3 Triage Expert Judgment ... 25
2.8.2.4 Combined Triage... 26
2.8.3 Progress Efficiency... 26
3. Results... 28
3.1 Progress estimates for full data set... 28
3.2 Progress estimates for stripped data set... 30
3.3 Contribution of problems detected only once ... 32
3.4 Problem frequency in group diversity... 33
3.4.2 Defect frequency analysis stripped data set ... 34
3.4.3 Design principles and improvements... 35
3.4.4. Design for both ... 38
3.5 CTA experience and Exterior appearance... 39
4. Discussion ... 40
4.1 Problem detection rate, reliability and group diversity effects ... 40
4.2 Redesign recommendations and design for both... 43
7. References ... 49
8. Explanatory list... 55
Appendix I Images prototype & usability lab... 58
I.1 Image used prototype infusion pump ... 58
I.2 Image used usability lab... 58
Appendix II Tasks & Questionnaires ... 59
II.1 Task list ... 59
II.2 Pre Questionnaire (demographics) ... 61
II.3 Post Questionnaire CTA-experience... 62
II.4 Post Questionnaire Exterior appearance ... 62
II.5 Post Questionnaire Design Features... 63
Appendix III Pre & Post questionnaire analyses... 65
III.1 Results demographic questionnaire... 65
III.2 Box plots CTA-experience & exterior appearance OR + ICU... 66
III.3 Box plots CTA-experience & exterior appearance OR... 67
III.4 Box plots CTA-experience & exterior appearance ICU ... 68
III.5 Box plots used design features ... 69
Appendix IV Triages box plots... 70
IV.1 Results TRIAGE box plots CTA-experience & exterior appearance ... 70
Appendix V Progress figures & binomial differences ... 71
V.1.1 Results LNB-fit & process analysis full data set observations; phase1 ... 71
V.1.2 Results LNB-fit & process analysis full data set observations; phase 2 ... 72
V.1.3 Results LNB-fit & process analysis full data set observations; phase 1&2 ... 73
V.1.4 Table with complete results of the raw data set ... 74
V.2.1 Results LNB-fit & process analysis stripped data set; phase 1 ... 75
V.2.2 Results LNB-fit & process analysis stripped data set; phase 2 ... 76
V.2.3 Results LNB-fit & process analysis stripped data set; phase1&2... 77
V.2.4 Table with complete results of the stripped data set ... 78
V.3.1 Results Binomial Difference Analysis full data set observations ... 79
V.3.2 Results Binomial Difference Analysis stripped data set ... 80
V.4 Contribution once found problems in full data set... 81
Appendix VI: (Re-) design Issues ... 82
VI.1 Problem categories scored per user groups ... 82
VI.2 List with ergonomical and cognitive design principles... 84
VI.3 List design issues related to definite usability problems... 88
VI.4 List of definite usability problems not related to design issues ... 89
VI.5 Overview problems to cognitive/ergonomical design principle ... 90
VI.6 List with redesign alternatives... 91
List of tables
Number Page
Table 1 Overview preset coding categories……….….…………...……….23
Table 2 Classification Model Box Plot results……….………25
Table 3 Decision tree end triage………...………..………26
Table 4 Example response matrix……….…...27
Table 5 Progress Analysis FULL data set……….…29
Table 6 Progress Analysis STRIPPED data set……….. ……….31
List of figures
Number Page
Figure 1 Signal detection Model………..………..13
Figure 2 Virzi’s Model of Geometric Series………..………14
Figure 3 Quantitative Control Models………...15
Figure 4 Bar graph for contribution problems found only once (X=1)….………...32
Figure 5 Example Flower Plot………...33
1. Introduction
Medical error reports from the Institute of Medicine (Kohn et al., 1999) greatly increased people’s awareness about the frequency, magnitude, complexity, and seriousness of medical accidents. As the eighth leading cause of death in the US, ahead of motor vehicle accidents, breast cancer and AIDS, preventable medical errors figure prominently (Zhang et al., 2003). As many as 100,000 deaths or serious injuries each year in the US result from medical accidents, of which a significant number relates to the incorrect operation (user errors) of medical devices, including human error (Lin, 1998), numbers that are supported by the 1999 Institute of Medicine report. In France, authorities report incidents involving medical devices used in anesthesia and intensive care units, in which 30% of all reported cases were related to infusion equipment (Beydon et al., 2001). In many of these cases, user errors stem from medical devices having poorly designed user interfaces, which therefore make them difficult to use. The FDA data, collected between 1985 and 1989, demonstrated that 45-50% of all device recalls originated from poor product design (FDA, 1998; Sawyer et al., 1996). It is recognized that such poorly designed user interfaces induce errors and operating
inefficiencies (Lin, 1998), even when operated by well-trained, competent users. Because of this, our focus was on a quantitatively controlled usability evaluation process for a new prototype infusion pump. For safety reasons, we are especially interested in the number of initially remaining design problems.
Background
problems (Obradovich and Woods, 1996; Lin et al., 1998). This recognition of the role of good design has resulted in a number of studies investigating the usability of medical devices, most notably infusion pumps (Garmer et al., 2002; Liljegren et al., 2000; Lin et al., 1998; Obradovich and Woods, 1996). User interfaces of medical equipment demand a high level of reliability in order to create prerequisites for safe and effective equipment operation,
installation and maintenance (Sawyer, 1996). Poorly designed human-machine interfaces in medical equipment increase the risk of human error (Hyman, 1994; Obradovich and Woods, 1996), as well as incidents and accidents in medical care. If all medical equipment is designed with good user interfaces, incidents and accidents should be reduced together with the time required to learn how to use the equipment. Medication errors are estimated to be the major source in those errors that compromise patient safety (Audit Commission, 2001; Vicente et al., 2001; Department of Health, 2004; Cohen, 1993, Leape, 1994; Webb et al., 1993). These, together with other common problems with infusion pump design, may predispose health care professionals to commit errors that lead to patient harm (Dain, 2002). The most common cause in erroneous handling during drug delivery tasks stems from the fact that operators have to remember (recall) everything that was previously entered, as well as detecting and
recovering from errors in confusing and complex programming sequences, which in turn increases the working memory load and cognitive load (Obradovich and Woods, 1996; Martinet al., 2008). Not surprisingly, most reported problems are identified as originating from lack of feedback during programming, even though interfaces should function as an external mental map (cognitive artefact) in supporting monitoring and decision making processes (Martin et al., 2008). Infusion pumps, used when drugs have to be administered intravenously to patients and in which the dosage needs to be accurately regulated and
continuously monitored over time, contain numerous modes of functioning, and often present poor feedback about the mode in which they are currently set. Also, buttons are often
illogically placed and marked (Garmer, Liljegren, Osvalder, & Dhalman, 2002b). Previous research indicated that causes for programming and monitoring difficulties resulted from infusion device complexity (flexibility), hidden behind simplified pump interfaces not
While manufacturers have already introduced some design changes to reduce associated risks and cutting down on errors, all parties agree that more needs to be done. Successful
development of safe and usable supportive medical devices and systems requires application of Human Factors Engineering (HFE) principles throughout the product design cycle,
meaning the application of knowledge about human capabilities and limitations to the design and development of supporting devices and systems (ANSI/AAMI HE75; Carayon, 2010). Doing so will help reduce use error and simultaneously enhance patient safety. Knowledge of HFE principles and successful application of these principles in the design of infusion pumps is critical to the safety, efficiency and effectiveness of the medical device.
Usability testing through think-aloud protocol
Taking the above into account, usability evaluation has been shown to be important in order to identify in advance any usability problems related to the design of the user interface and thereby to reduce erroneous handling from development onwards (Norman, 1983). In order to specify usability problems more precisely, usability testing is a suitable evaluation method, involving end-users for identification of user requirements and usability problems (Nielsen, 1993). During usability tests, observations and verbal protocols (concurrent or retrospective) (Nielsen, 1993) are important tools for uncovering problems while complementary interviews and questionnaires are used to collect participants’ opinions about improvements. Obradovich and Woods (1996) and Lin et al. (1998) used Think Aloud protocols (TA) to provide
information for the design of new infusion pumps by identifying problems in existing ones. TA protocols are methods commonly used in HCI to gain insight into how people work with a product or interface (Guan et al, 2006; Ericsson, 1993), something considered to provide high face validity. The most commonly practiced version is the Concurrent Think Aloud protocol (CTA), in which people work on typical tasks while simultaneously verbalizing their thoughts and actions. As Nielsen (1993) commented “thinking aloud may be the single most valuable usability engineering method”. However, there are some constraints in the use of CTA. It might affect task performance, it may distract the subject’s attention and concentration, and it could change the way the user attends to task components. Therefore, the Retrospective Think Aloud protocol (RTA) became more preferable (Guan et al., 2006), being a method asking users first to complete the whole task set and only afterwards to verbalize their process, sometimes stimulated by replaying recorded video data. Guan et al. (2006) reported that, nowadays, RTA is frequently used for usability testing. In choosing between CTA and RTA for usability evaluation, both are considered to result in comparable sets of usability problems (Haak et al., 2003), the only difference being that in RTA problems are detected by means of post hoc reflection on task performance, while in CTA they are detected by means of
with ‘expert found problems’. This is in contrast tousability testing where the usability of the interface is evaluated by testing it on real users. Usability inspections can generally be used early in the development process by evaluating prototypes or specifications for the system that can't be tested on users. When comparing these usability inspection results to later real user found problems from usability testing, currently observed problems can, related to these previous expert found problems’ be placed in four categories as described by Signal Detection Theory (Terris et al., 2004): (1) a hit, in that an observation is in line with the experts found problems, (2) a miss, in which an observation remains absent, but should have been present according to the expert found problems, (3) a correct rejection, in which no expert found problems was present and no observation was made, and (4) a false positive, in which there was no expert found problem but an observation materialized (see figure 1).
Figure 1: Signal Detection Model: The better the response (detection) to signal (problem) ratio the more hits and the less false alarms (type I error: responding as being a signal present when in fact there is none).
Usability testing is currently considered to be robust against the presence of such false
positives. In fact, identifying them is a recommended approach. However, in previous studies, high variance and large numbers of defects detected only once have been seen, resulting in a large distortion in the prediction of the remaining unseen events, leading us to wonder whether this could be the result of the presence of false positives in the data set (Schmettow, 2009). In usability testing, false positives are known as those events predicted by usability inspection, but not materializing during the usability testing phase. In this case, the evaluation testing result is leading, resulting in the additional assumption that, if something is in fact observed (materialized) during this testing phase, it is a true event (Woolrych et al., 2004; Sears, 1997, Hartson et al., 2000). But all of this was put forward before RTA became
One interesting question arising from this is whether the high face validity assumption currently adhered to also applies to RTA. In those cases where safety is critical, high validity (real problems found/issues identified as problem) in testing is essential (Sears, 1997), making the question not only interesting, but also more relevant in principle.
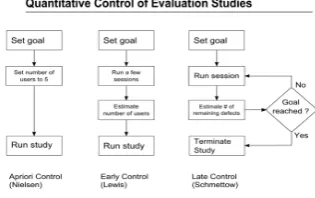
Late control usability evaluation in high-risk systems
Independent of the chosen usability test (CTA or RTA) and in cases where usability is a mission critical system quality, it is becoming essential to know whether an evaluation study has identified the majority of existing defects and valid numbers of the remaining problems in the design that jeopardize usability. Therefore, all available evaluation methods must pose the question as to how effectively they are achieving this. Previous work has shown that
procedures for estimating the progress of evaluation studies have to take into account the variation in defect visibility; otherwise, bias will occur. In planning usability evaluations, two management strategies are commonly used concerning the sample size required, both based on Virzi’s geometric model (1992); the outcome of an evaluation process will follow a geometric series (figure 2). The main assumption in this model is that adding new trials will not, in the end, elicit many more new events.
Figure 2: Curve of diminishing returns in which the relative outcome of the process is a function of the process size n (independent trials) and the detection probability p (average p=0.35). Trial 6 only elicits 1 new problem.
Results of the estimate are compared to preset goals for D and only then is it decided whether to quit or to pursue. In this strategy, no prior estimates of sample sizes are included.
Figure 3: overview of currently existing quantitative control management strategies for the use in evaluation studies.
Hereby reliable quantitative control for a usability evaluation process under variance of defect visibility is presented, allowing practitioners to control evaluation studies towards a preset goal. It accounts for varying defect visibility, required to prevent harmfully overoptimistic estimates of problem detection rate D.
It is also easily adaptable for estimating the required number of sessions and it relates to concepts such as confidence interval use, which is a particular advantage compared to GT smoothing of the binomial model, also widely ignored in previous studies and resulting in severe uncertainty of effectiveness through small sample size estimation. Schmettow (2009) claims that, when taking into account CIs in the probability p for predicting required sample size in early control, this affects the accuracy of the estimation. The larger the confidence interval, the wider the range in required sample size, when calculated from small sample size progress. When planning a study, based on these estimates from small sample size progress, this would not render much trust in the chosen sample size, especially when concerning high-risk systems in which one needs to underpin statistically the number of (not) observed problems.
All this is recapitulated in the main research goals for the present study. Our research interests are twofold: (1) the defect detection rate, the level of certainty concerning this detection rate, the number of ‘definitely usability problems’ in this rate, and whether diversity in user groups matters in variance of defect visibility; (2) the origin of the detected usability problems with regard to cognitive and ergonomical design principles, alternatives for redesign, and whether we could settle on a design for all user groups.
In order to back our first research goal concerning detection rate, we formulated the following subgoals.
1. Efficiency of usability testing on a medical device
2. False Positives Survey
We want to explore whether RTA protocol is as robust for false positives (maintaining high face validity) as currently adhered to think-aloud methods (CTA and RTA). Removing possible ‘false positives’ should render a more favorable progress in D and high validity. For the survey, a medical segregation method called ‘triage’ (Terris et al., 2004; Dong et al., 2005) will be used, separating the events observed into ‘definitely not problems’ (e.g., possible false positives), ‘possible problems’ and ‘definite problems’. Following this, the scrutinized data that has been reset is analyzed using the above-mentioned LNBzt model. The triage method is based on heuristics and is by nature qualitative.
3. Variance in Defect Visibility
Virzi (1992) indicated that subjects differ in the number and nature of usability defects detected, due to differences in experience (e.g., knowledge), not further researched. In this study, we tried to analyze the role of diversity of users on the effect of individual problems encountered (e.g., variance in defect visibility); we wanted to gain insight into whether diversity in users (different professions) revealed different patterns in defect frequencies, indicating variance in defect visibility during testing. We used an exact unconditionally pooled Z test on binomial differences (Berger, 1996) in analyzing our data.
In order to back our second research goal concerning the origin of detected problems, we formulated the following subgoals.
4. Design principles and improvements
With consideration of cognitive and ergonomical constructs in evaluating major problems in the current prototype, we were interested in the quality of the current design and in possible alternative options for design improvement. We used ergonomical and cognitive design principles, also serving as a base for the post-task questionnaire, and as ground for the expert opinion, used in the triage method as mentioned above.
5. Effect of diversity of user groups on design choices
Consider whether, based on current data as to problems discovered, we could come to one design for both user groups. In doing so, we elaborated on the distribution of problems found between both user groups as displayed in flower plots, resulting from the exact
2. Method
2.1 Usability Evaluation method
In this study, we evaluated an interface of a prototype infusion pump (Appendix I.1) designed by TNO Behavioural and Societal Sciences developed through an extensive Usability
Engineering Process (Dutch NEN-norm, 2008). The prototype interface was initially developed by two students from the Hogeschool Utrecht (Hitters & Wakanno, 2009) who gathered user requirements through interviewing , and subsequently modified and
implemented by a third student from the Hogeschool Utrecht (van Assen, 2010). In the evaluation study, a usability testing study was executed, this being the most appropriate choice in detecting remaining usability problems. Some of the basic requirements include the use of representative samples of end-users, representative tasks, observations during actual use, a collection of quantitative and qualitative data and, finally, elaborating on redesign alternatives, proposed for redesign.
2.2 Participants
Within two professional fields, OR anesthesiologists (N=18) and ICU nurses (N=18), were recruited as a convenience sample (14 males, 22 females) Complete and accountable video data from 34 subjects were available for analysis, excluding two participants due to
incomplete video data. Educational levels varied between WO1 (26.4%), HBO2 (61.8%) and MBO3 (11.8%), whereby the OR subjects surpassed the ICU subjects by more than three times, based on WO level. Distribution across age categories was as follows: 20-29 years (n=13, 38.2%), 30-39 years (n=10, 29.4%), 40-49 years (n=7, 20.6%), and 50-59 years (n=4, 11.8%). There were no subjects in the age category ≥ 60 years. The age category 20-29 years contained one third of all subjects (N=34). The number of years of infusion pump experience varied between half a year up to 30 years (with a total average of almost 12 years; an ICU average of 14.16 years and an OR average of 9.81 years). In both user groups men were, on average, more experienced than women. All accountable OR subjects (NOR=17) were
experienced with the Arsena Alaris infusion pump and 35.3% of them were also experienced in handling the Braun infusion pump. For the ICU subjects, all accountable subjects
(NICU=17) were experienced in handling the Braun infusion pump and 5.9% were also
All subjects had normal or corrected to normal vision. All gave their written consent prior to the test trial and were informed about the goals of the experiment. No rewards were given for participation. Subjects participated on behalf of their work-related involvement. Further demographic characteristics are logged in Appendix III.1. (1=MA; 2=BA; 3=Intermediate Vocational Training).
2.3 Procedure
The usability testing study was conducted in a hospital setting (Appendix I.2), in a closed room with regular artificial lighting and in the presence of the person conducting the
experiment, who observed and took notes. Subjects were seated in front of a table on which the apparatus was placed. On the display of the touch-screen computer, the simulation of the infusion pump was presented on a blue background. Eleven independent tasks (see 2.5 Tasks, below) were programmed into the simulation and task instructions were presented on paper. Each subject was instructed to perform a complete set of 11 tasks (Appendix II.2) with the use of the touch-screen prototype and to think aloud concurrently during the performance of the task. No clues about the tasks were given beforehand or during the task. The facilitator was also present during the sessions, but subjects were instructed not to turn to the facilitator for support or advice during the performance of a task. Additional instructions, concerning the concurrent think-aloud protocol, were given to the subjects. With their consent, video and audio data were gathered from each subject during the experiment to capture task slips and mistakes made by subjects. Screen captures were also recorded. Task performances of individual trials were not auto-saved in the simulation. In this way, each task could be presented to the next subject in exactly the same way. After completing each task, subjects were requested to give performance opinions in a Retrospective Think Aloud protocol, in order to prevent interference from learned responses or omissions in completing the whole of the task set. In this, subjects had to independently reflect aloud on their previous task
performance, without guidance of the experimenter. There was one minute for giving their retrospective feedback and then the next task was loaded for completion. All eleven tasks were presented and evaluated this way. In conducting the usability test, first the
prototype and (3) handling the pump during task performance. The latter one related to applied cognitive and ergonomical design principles. Due to the fact that the simulation was run on a dated type of touch-screen display, including ‘only’ five reference points for calibration, the outlining was not very consistent in accuracy and hence the effectiveness of the touch-screen varied heavily between trials. We knew beforehand that operating using this touch-screen would decelerate performance time considerably between subjects, therefore making time an unreliable measure. Recorded performance time was therefore not used in the data analysis. Because of the characteristics of the user groups in this experiment, we used the Concurrent Think Aloud protocol (CTA) during task performance and Retrospective Think Aloud protocol (RTA) after each task. The user groups participating in this experiment were obliged to ‘leave’ their workplace physically. A complete usability test trial had to be performed within a maximum of 90 minutes. When using CTA, the time required complied with the available time. Following official RTA protocol, the time needed for a complete test trail would have to be extended beyond these 90 minutes, which was unacceptable to both groups. However, since these user groups are the main target group in the previous phases of the usability engineering process (eliciting user demands), it still seemed relevant to include them in this usability test. Therefore we used the CTA protocol as the basis, instead of the more time-consuming RTA method (Van den Haak, 2008). RTA was used in a
complementary way to CTA protocol, as described above. The prevailing protocol was
followed regarding CTA. Subjects completed a questionnaire before starting the session. They were presented with their tasks and given oral instructions as well as reading a written version of their tasks, in order to ensure consistency. After finishing the session, subjects were
presented the additional questionnaires. In this usability evaluation study we did not use usability inspection. For planning, designing and conducting this usability testing study and for related questionnaires, we used Rubin’s handbook (1994).
2.4 Focus of study
We only focused on detecting interface usability problems in this study. No attention was paid to problems arising from the physical appearance of the pump, such as weight, height,
2.5 Tasks
For this study we formulated a fixed set of 11 tasks covering the main functions (user goals) of the infusion pump and which were compatible with the work procedures of the user groups. Known (risky) problems in controlling infusion pumps, as described in the literature (Cook et al., 1991; Dain, 2002, Liljegren et al., 2002; Wagner et al., 2008), were captured in the tasks presented. All tasks were designed on predefined task goals (simple operation, advanced operations, feedback detection operation) and run through beforehand with three experts (anesthesiologists) with a view to real-world task accordance. These experts did not participate in the experiments. The complete list of 11 tasks is given in Appendix II.1. All tasks were estimated by the experts to be of equal difficulty and could be carried out independently of each another to prevent subjects ‘getting stuck’ during the experiment.
2.6 Questionnaires
During the experiment users were presented with pre questionnaires and post questionnaires. At the start of the experiment they were requested to complete a consent form and a
2.7 Apparatus
Simulation presentation was achieved through the use of a standard Dell touch-screen
computer display and a Dell Personal Computer (hardware). Video and audio recordings were made using a Sony Digital Handycam, model no. DCR-TRV33E. For a picture of the
Usability Lab that was used, see Appendix I.2.
2.8 Data Analysis
For progress analysis in the (un)detected number of problems D relating to our target, we used the method as suggested by Schmettow (2009), described briefly in the introduction above. In this late control method, we took into consideration the variance of defect visibility and a preset confidence interval of 90%. Using this method, which adjusts for incompleteness as well, we were also able to detect the progress in the decrease in problems that were not observed. For conclusions about the importance of including different professional user groups into the evaluation process, an exact and unconditional pooled Z test on binomial differences (Berger, 1996) was used in analyzing the data set. For rendering a data set of coded (observed) problems, we used the following strategy.
In order to come to expert analysis concerning the origin of found problems, these problems were considered in the light of cognitive and ergonomical design principles, the latter ones displayed in a list made up in advance (Appendix VII). This list was compared with the found definite usability problems, this way rendering insight and guidance in the origin of the problems and the possible redesign alternatives.
2.8.1 Coding data
2.8.1.1 Video and voice recordings
After finishing all 36 trials, video and audio data of each subject were verified for
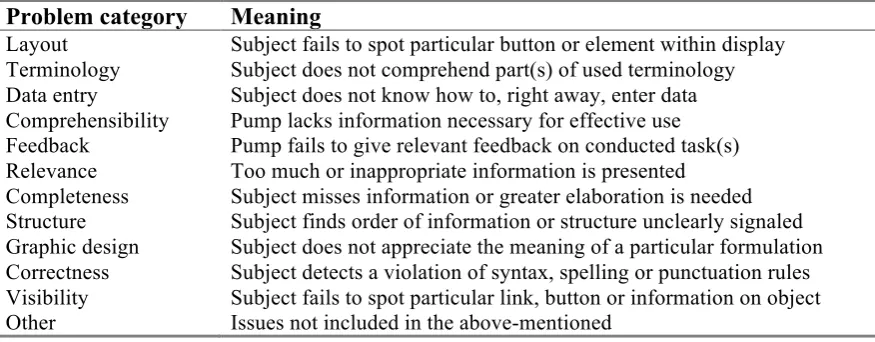
completeness and written out in protocols to yield coded problems. For each task and each participant, coding was performed by writing down the observations, indicating in which phase each observation appeared (CTA=observation, RTA=verbalization), and in assigning a ‘design category’ (e.g. layout, terminology, feedback, structure, etc.). All coded observations were identified with an ID tag, representing the full data set of problems. For the complete list of the full data set of coded observations, see Appendix VI.1. The used preset design
Table 1
Used problem categories for problem identification
Problem category Meaning
Layout Subject fails to spot particular button or element within display
Terminology Subject does not comprehend part(s) of used terminology
Data entry Subject does not know how to, right away, enter data
Comprehensibility Pump lacks information necessary for effective use
Feedback Pump fails to give relevant feedback on conducted task(s)
Relevance Too much or inappropriate information is presented
Completeness Subject misses information or greater elaboration is needed
Structure Subject finds order of information or structure unclearly signaled
Graphic design Subject does not appreciate the meaning of a particular formulation
Correctness Subject detects a violation of syntax, spelling or punctuation rules
Visibility Subject fails to spot particular link, button or information on object
Other Issues not included in the above-mentioned
2.8.1.2 Coding of post questionnaire
All post questionnaires were analyzed through box plot evaluations. In this way we could study the median and the quartiles. At the lower end of the median, the more negative the general sentiment on a particular issue and the more divergent the quartiles, the more subjects did not agree with the particular statement.
2.8.1.3 Post questionnaire issues related to coded problems
To effectively use the outcomes of the design related post questionnaire, it was used to underpin the full data set of coded problems. In doing so, the post questionnaire scores concerning the design feature were related to co-specific coded problems.
For each coded problem relative subsequent questions were attached. Because more issues from the post questionnaire predominantly resulted in a positive sentiment instead (e.g., a good design feature), not all questions related to a coded problem (e.g., possible design problem). On the other hand, a questionnaire issue could relate to one or more coded problems. In this way, later box plot results could be linked to coded problems. Box plot results of CTA experience and prototype appearance were analyzed and reported on separately.
2.8.2 Survey for ‘definitely not usability problems’
The method used is called ‘triage’ (Terris et al., 2004; Dong et al., 2005) and originates from medical teams operating in disastrous events when time is very limited for making thorough assessments.
They separate out the ‘definitely not’ (e.g., hopeless) cases in this way from the ‘probably’ or ‘definitely yes’ (e.g., hopeful) cases in giving medical care, in order to prevent themselves from squandering time on cases that are not ‘worthwhile’. The method is based on heuristics and has a qualitative nature. The triage method was used in this study to differentiate between severities of full data set of coded problems on three levels of data analysis, those being CTA protocols (§2.8.2.1), subsequent questionnaire issues linked to design features (§2.8.2.2), and in an expert view
concerning the CTA problems observed (§2.8.2.3). The triage levels, performed on all these three levels, comprise the values of (1) definitely not being a usability problem, (2) undecided, and (3) definitely being a usability problem, thus, in the first case, scrutinizing possible falsifications or more specifically, the ‘false positives’ (Woolrych et al., 2004) (e.g., materialized observation is not a real problem).
2.8.2.1 Triage CTA
In attempting to determine a more valid end result in coded problems, without pollution through ‘definitely not usability problems’, a triage method was executed on different levels of the full data set of coded problems.
In preparation for this, problems that had been observed were already classified into (1) ‘action related’ (e.g., pressing the bolus button to start the pump) or (2) ‘action unrelated’ (e.g., personal opinions “…but I just do not like the traffic light feature”). At this first triage level, the action related problems were scored as ‘definitely a usability problem’, in that a wrongfully performed action can present a potential problem, thereby needing attention. Problems unrelated to action were scored as ‘undecided’, in that they are not a problem as such, but could also be an opinion, an expectation or something else. Because it was too premature to decide beforehand from these action unrelated problems whether something was a usability problem or not, a somewhat conservative attitude was maintained and therefore we did not score on the classification ‘definitely not a usability problem’. The triage performed here allowed us to differentiate between action related problems and personal expressions from RTA verbalizations, the last one to be known for being susceptible to ‘biases’. This because these expressions are often accepted as hits (Signal Detection Theory), but in reality not being real usability problems after all type I errors (false positives). After careful
principles (e.g., personal expectations, habits), essential for usability design evaluation. Through this triage method we could purify our data from these apparent false positives, filtering only true usability problems.
2.8.2.2 Triage Questionnaires
Each subject completed a five-point Likert scale post questionnaire, regarding the design features used. Box plot analysis, based on the given Likert score per question, was performed for each of these questions. Regarding the results of the box plot analysis, a 3 level triage, as described above (§2.8.2.1), was executed to discern the ‘definitely not a usability problem’ from the ‘undecided’ and ‘definitely usability problems’ concerning the design features. The triage was classified as described in table 2 below. Hereafter, relevant questions (e.g., co-specific issues from questionnaires) were mapped to all full data set coded observations from the CTA/RTA protocol.
Table 2.
Classification of box plot results.
Box plot range
Classification (score) Central tendency towards design
feature
Range 3-5 Not a usability problem (1) Mainly positive
Range 2-5 Undecided (2) Undecided
Range 1-5 Definitely a usability problem (3) Mainly negative
Note 1. Based on median and quartile analysis concerning post questionnaires is about design features.
2.8.2.3 Triage Expert Judgment
In the third and final 3 level triage, the experimenter made a value judgment about all coded problems in the full data set, based on HFE principles. In doing so, a preset list of design principles was used (see Appendix VII). When an observation was judged as ‘not being a usability problem’ from a HFE point of view, it was assigned a score of one. Observations, whereby the value remained undecided, were awarded with a score of two. Those
Concerning our second focus of this study, rendering recommendations for redesign, these motivations given were used as indication to the origin of usability problems at hand and the direction for alternatives. In this, a list with design principles served as additional guidance.
2.8.2.4 Combined Triage
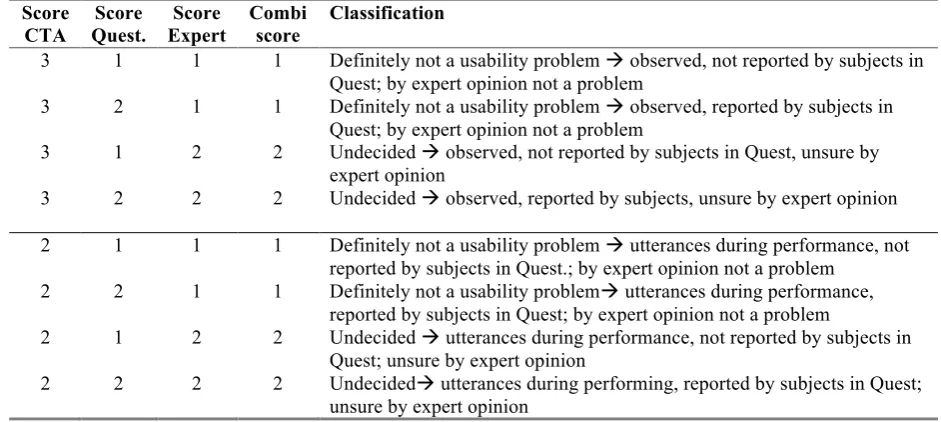
[image:26.595.60.531.370.581.2]All separate triages were combined in the end to form a generic result and a decision tree was used to establish a combined score. In this decision tree, a CTA triage score of ‘definitely a usability problem’, combined with a score ‘definitely a usability problem’ from either the post questionnaire triage or expert triage, jointly resulted in being ‘definitely a usability problem’ (respectively score 3) and, being a candidate for redesign, was proposed as such. Other end triage combinations and their ratings are explained in table 3 below.
Table 3.
Decision tree for combined triage when questionnaire score and expert score do not have the value of 3 (‘definitely a problem’).
Score CTA Score Quest. Score Expert Combi score Classification
3 1 1 1 Definitely not a usability problem observed, not reported by subjects in
Quest; by expert opinion not a problem
3 2 1 1 Definitely not a usability problem observed, reported by subjects in
Quest; by expert opinion not a problem
3 1 2 2 Undecided observed, not reported by subjects in Quest, unsure by
expert opinion
3 2 2 2 Undecided observed, reported by subjects, unsure by expert opinion
2 1 1 1 Definitely not a usability problem utterances during performance, not
reported by subjects in Quest.; by expert opinion not a problem
2 2 1 1 Definitely not a usability problem utterances during performance,
reported by subjects in Quest; by expert opinion not a problem
2 1 2 2 Undecided utterances during performance, not reported by subjects in
Quest; unsure by expert opinion
2 2 2 2 Undecided utterances during performing, reported by subjects in Quest;
unsure by expert opinion
2.8.3 Progress Efficiency
was possible to track which observations were made by whom and also how often a particular observation occurred during the complete sample size analyzed.
Table 4.
Overview of a response matrix of coded problems
S1 S2 S3 S4 Total
Problem1 1 1 0 1 3
Problem2 0 1 1 0 2
Problem3 1 1 1 0 3
Problem4 0 0 0 1 1
Problem5 1 1 1 1 4
Problem6 1 0 1 0 2
Total 4 4 4 3 15
The response matrix was imported into Schmettow’s quantitative mathematical LNBzt model (2009). This model, which is a mathematical model called zero-truncated logit-normal
binomial distribution for accounting for the variance of defect visibility and unseen events simultaneously within a preset confidence interval (therefore not based on the same assumptions as with Virzi’s formula), and of which the technical details are described in Schmettow (2009), allows for number estimation of not-yet-discovered problems with a certain amount of statistical confidence. It estimates first the parameters of the unmodified data and then determines the most likely number of observed problems.
In doing so, the LNBzt model bridges between the most urgent questions about sample sizes and offers valid quantitative statements about the remaining usability problems, which is valuable for usability evaluations of medical devices whereby high safety standards are a must. This model fits a late control strategy, as used in this study. With the use of the LNBzt model in a late control mode, it was calculated how many observations were (un)seen from the initial full data set of coded problems from OR video data (NOR=10), and results were
checked with the preset target of 90% for D. Hereafter, the full data set of coded problems from ICU-video-data (NICU=10) was also analyzed this way, both separately and combined
with the first data set of the OR (N=20). Again, results were checked against the preset target. Subsequently, the same was done for the remaining accountable subjects of each group (NOR=7, NICU=7), both separately and combined as a group (NTotal= 14). In the end, the same
analysis was performed on the whole group sample sizes and the complete experimental sample size (NOR=17, NICU=17, NTotal=34). In this way, the progress of detected problems D
After this first phase of quantitative analysis, we executed the triage method (§2.8.2) and scrutinized those problems ‘definitely not being usability problems’. Then the analysis as described for the first phase of analysis was run again. In this way, we hoped to see an effect on progress when the category ‘definitely not a usability problem’ was eliminated, referred to as ‘stripped data set’. Besides the number of (un)seen problems (X=0), the distribution of coded problems between both user groups was also analyzed for the full and stripped data set, principally to gain insight into whether variance in defect visibility, as stated in the
introduction, really does occur.
3. Results
In analyzing all video data (CTA & RTA) and coding the full data set of observations, some coded problems arose more often than others. Also, as was expected, some were revealed by performance inefficiencies (action related), whereas others surfaced through utterances, the latter ones mostly during RTA protocol. This already indicates a dichotomy in the initially observed problems. After importing the response matrices of coded problems into
Schmettow’s quantitative mathematical LNBzt model (2009), two sets of results emerged. The first set comprised quantities of not-yet-discovered problems and progress efficiency for the full data set of coded problems. The second set concerned the same results for the stripped data set. Both are presented in the section below.
3.1 Progress estimates for full data set
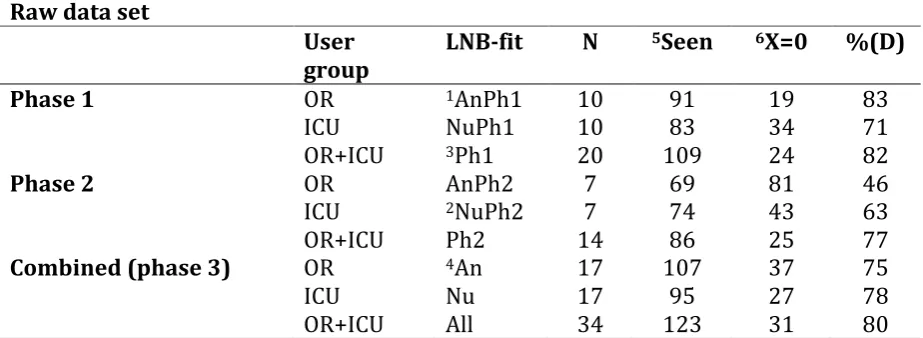
Table 5
Number of (un) seen problems in the raw data set for all three phases. Raw data set
User
group
LNB-fit N 5Seen 6X=0 %(D)
Phase 1 OR 1AnPh1 10 91 19 83
ICU NuPh1 10 83 34 71
OR+ICU 3Ph1 20 109 24 82
Phase 2 OR AnPh2 7 69 81 46
ICU 2NuPh2 7 74 43 63
OR+ICU Ph2 14 86 25 77
Combined (phase 3) OR 4An 17 107 37 75
ICU Nu 17 95 27 78
OR+ICU All 34 123 31 80
Note. Process prediction, including Monte Carlo Sampling, under 90% CI.
1AnPh1=first group anesthesiologists analyzed (n=10); 2NuPh2=second group ICU-nurses analyzed (n=7);
3Ph1=both first groups together analyzed (AnPh1+NuPh1); 4An= all anesthesiologists analyzed together;
5Seen=detected problems D in group analyzed (also displayed in %)
6X=0 are predicted number D of unseen problems yet using the LNBzt-model
For the graphs of both the LNB fit analysis and progress prediction for all group
compositions, see appendices V.1.1, V.1.2, V.1.3 and V.1.4. The description used in the table as ‘LNB fit’ refers to the corresponding graph. On a total of 123 detected observations, a predicted number of 31 problems remain unseen so far. The number of 123 does reflect a scored grade of 80% on found (seen) ‘problems’ D within n=34, leaving a predicted amount of 20% unseen problems (n=31) in the current design. This means that the LNBzt-model predicted a number of 31 problems still present in the prototype but not scored (observed) yet by one of the subjects.
Of all group compositions, only two resulted in a score for D of higher than 80%, both of which were in the first phase analysis, and none with a score for D of 85% (as promised in the ‘five users is enough’ debate). Moreover, scores for X=0 differ a lot between same sample size group compositions. None of the compositions rendered our target of D=90%.
increase in not-yet-observed problems can be seen. On the contrary, in the second phase group composition NuPh2 the prediction is in line with the first phase ICU subjects analyzed. After thorough analysis of the graphs of both phases (appendices V.1.1 & V.1.2), it was noticed that, in the first phase analysis (AnPh1), there was a slightly smaller number for X=1 (e.g. problems detected only once) than there was for X=2. For the second phase, the number for X=1 was significantly increased compared with X=2. This increase was sustained for X=0, forecasting a huge number of not-yet-found problems.This phenomenon of high variance and a large number of problems detected only once resulting in a strong positive distortion and predicting a high number of unseen problems is also described in the work of Schmettow (2009). In this study, a possible explanation for these kinds of irregularities was given as resulting from ‘false positives’ (as referred to in current HCI literature) or in a matching problem (leaving many similar defect reports as distinct problems in the data set). More thorough analyses showed that, in these problems detected only once, there was a large contribution from only two participants. In counting all problems detected only once in the second phase OR user group and calculating the proportion of each subject’s share in this, it was discovered that subjects 112 and 117 were accountable for the largest proportion of problems detected only once (each around 30%), whereas the other five subjects scored 15% or much less. In other words, there were two participants who encountered problems that others did not. A closer look also clarified that it concerned two subjects who had far more infusion pump experience when compared to the other five subjects of this second phase user group (demographics details are displayed in Appendix III.1). More specifically, they were more experienced in using one (and only one) specific infusion pump. Virzi (1992) already mentioned the phenomenon that experienced subjects tend to detect other defects compared with less experienced subjects (variance in defect visibility). Reciprocally these findings were not different for analysis of the full and stripped data set, leading to the conclusion that, although these problems are only encountered by these two experts, they do concern issues from the category ‘definitely usability problems’.
3.2 Progress estimates for stripped data set
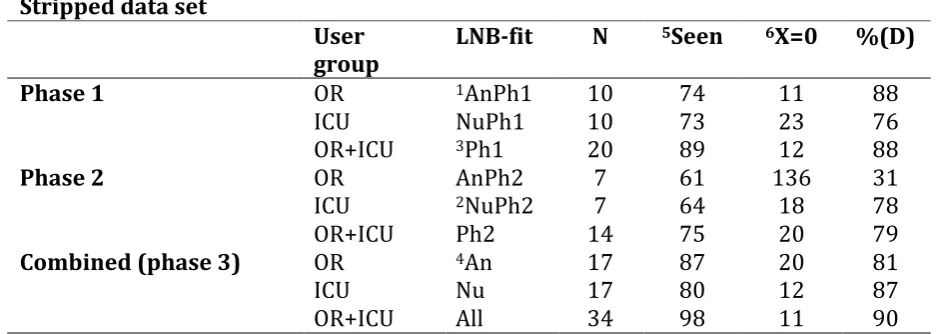
Table 6
Number of (un) seen problems in the stripped data set for all three phases. Stripped data set
User
group LNB-fit N
5Seen 6X=0 %(D)
Phase 1 OR 1AnPh1 10 74 11 88
ICU NuPh1 10 73 23 76
OR+ICU 3Ph1 20 89 12 88
Phase 2 OR AnPh2 7 61 136 31
ICU 2NuPh2 7 64 18 78
OR+ICU Ph2 14 75 20 79
Combined (phase 3) OR 4An 17 87 20 81
ICU Nu 17 80 12 87
OR+ICU All 34 98 11 90
Note. Process prediction, including Monte Carlo Sampling, under 90% CI.
1AnPh1=first group anesthesiologists analyzed (n=10); 2NuPh2=second group ICU-nurses analyzed (n=7);
3Ph1=both first groups together analyzed (AnPh1+NuPh1); 4An= all anesthesiologists analyzed together;
5Seen=detected problems D in group analyzed (also displayed in %)
6X=0 are predicted number D of unseen problems yet using the LNBzt-model
The effect between the first and second phase analysis of the group composition OR allowed us to conclude prematurely that the effect did not go away by excluding the category
‘definitely not usability problems’ and therefore could not be explained from that standpoint. Further reflection about the origin of this effect is given in the Discussion section.
Extrapolation based on the third phase (fit All) of the data set real usability problems. A sample size of 50 subjects would result in an approximate detection rate of 94% finding usability problems, after having discarded the ‘definitely not a problem’ from the data set (Appendix V.2.1: extrapolating ‘process prediction’ third phase to N=50). In reverse, by using the quantitative mathematical model that would reveal sample size n for both groups together and with exclusion of the category ‘definitely not a usability problem’, resulted in a problem detection rate of 95% and 98%. Accordingly this would result in respective sample sizes of n=66 subjects and n=129 subjects.
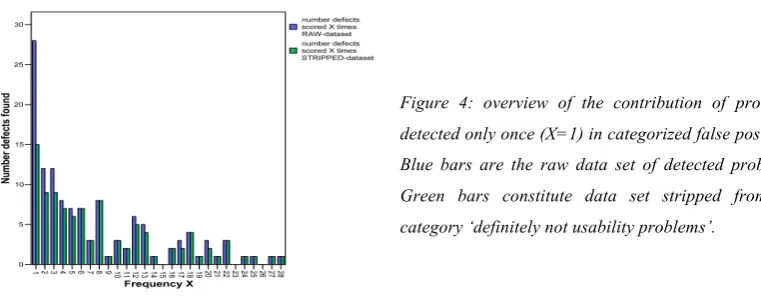
3.3 Contribution of problems detected only once
In surveying the category ‘definitely not a usability problem’, we were interested in finding out how the contribution of the number of problems detected for each value of X in both the full and stripped data set affected these. After eliminating the category ‘definitely not a usability problem’ from the full data set, we saw a significant drop in the number (n=13) of problems detected only once (low visible defects). The contribution of problems detected only once in the full data set amounted to n=28. For the stripped data set this was n=15, a reduction of more than 46%. There was no such significant difference in numbers for other values of X. The category ‘definitely not usability problems’ contained a large quantity of problems
detected once only.
For individual results of both data sets and the line graph, see Appendix V.4.
[image:32.595.76.457.570.721.2]3.4 Problem frequency in group diversity
When involving different types (professions) of user groups with various levels of experience, it might be expected that this would influence the type and the number of problems detected. It might be that one group is more susceptible to some problems than the other group, a point that Virzi (1992) did not take into account in his formula. Variance in defect visibility,
elicited by using different user groups, directly relates to the number of observed problems or predicted sample size (Lewis, 2001). In order to prove that this variance in defect detection actually exists in the current full and stripped data, an exact unconditional pooled Z test on binomial differences (Berger, 1996) was performed on both. Variance in defect visibility is projected in figure 1.
In this test we compared whether detected problems were equally visible in both user groups or not and, in line with that finding, whether this visibility varied when false positives were scrutinized. In analyzing defect visibility variance, all detected problems had to be evaluated individually (NTotal=124) for both user groups, whether or not both supported a detected
problem. In this we presumed the following hypotheses:
H0: No variance between both groups for defect (coded observation equally visible in both user groups) Ha: Variance between both groups for defect (coded observation not equally visible in both user groups)
Because it is possible that a detected problem (full or stripped data set) was more visible to either of the two groups, it was a two-sided alternative hypothesis. With a significance level of p=0.05 it was to be expected that, in five percent of the cases in which we rejected for not supporting the null hypothesis, we would be wrong.
3.4.2 Defect frequency analysis stripped data set
After separating the full data set of coded problems from the category ‘definitely not usability problems’, resulting in a data set of 99 problems referred to as the stripped data set
(containing ‘undecided’ and ‘definitely’), we again looked at problem frequencies between both groups to determine variance in defect visibility.
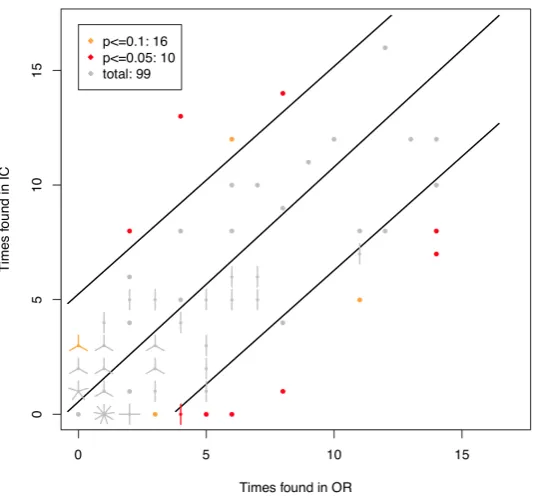
Table 7.
Results of test on binomial differences, stripped data set within two different significance levels.
Total Nprob.=99 NOR=17 NICU=17 Rejected subjects 113, 211
Total rejected OR<ICU OR>ICU
ρ = 0.1 16 7 9
ρ = 0.05 10 3 7
Note. For the corresponding graph, see Appendix V.3.2. A: Two-sided exact test
B: Alpha error ρ = 10% and 5% (ρ = 0.1 resp. ρ = 0.05)
C: OR>ICU = problem experienced more by OR group than by ICU group
We rejected the null hypothesis for coded problems concerning the following cases: p ≤ 0.1 : 16: within p =0.1, for 16 cases the null hypothesis is rejected. For these coded
observations there was a significant difference in defect visibility (variance) for this detected problem (red and orange dots in the graph as shown in Appendix V.3.2).
p ≤ 0.05 : 10: within p=0.05, for 10 cases the null hypothesis is rejected. For these coded
observations there was a significant difference in defect visibility (variance) for this detected problem (red dots in the graph as shown in Appendix V.3.2).
p ≤ 0.05: 10 gives us a view of those detected problems that are significantly more visible for
either one of both groups.
With a rejection of 16 (p ≤ 0.1 : 16) detected problems from a total of 99, 16% of the
Because of scrutinizing those problems categorized as ‘definitely not usability problems’, the frequency of problems detected only once is less prominent, implying that these barely visible problems are predominantly those problems categorized as such. The results in table 5 (and the graph in Appendix V.3.2) show that, despite some differences in defect visibility,
distribution in defect visibility is less distorted with regard to the problems detected only once after scrutinizing ‘definitely no usability problems’, supporting the idea that problems
detected only once do contain problems that are not real usability problems. Because problems detected only once are never significant, both data sets would therefore render identical results. Therefore this analysis was only carried out for the stripped data set. In conclusion, we do see variance in defect visibility between both groups, which means one has to take into account this variance in calculating probability of problem detection.
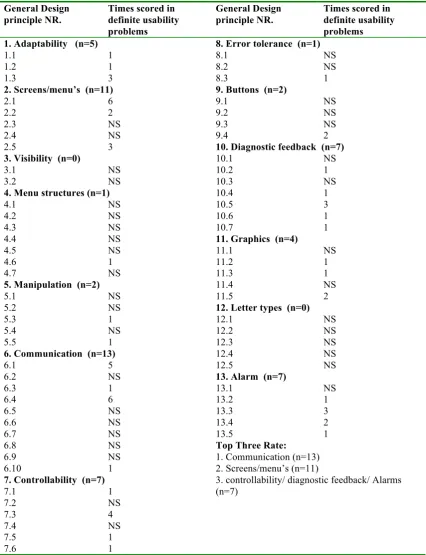
3.4.3 Design principles and improvements
First, from the list of definite usability problems, we listed scored problem categories per user group (Appendix VI.I). In this the total number of problems found in each of the preset problem categories and per user group was stated, and, complementary, problems with the highest number of countable observations were presented. For example, in the column
‘category defect’ covering ‘layout’, two usability problems were listed. The description in the column ‘most pronounced defects’ is a conglomerate of both defects and scoring rates of observations combined. This yielded a score in total of 18 occasions (6 times by OR users and 12 times by the ICU users). In every category, the content of the detected problems and accompanying rates were scored. The same could be done for the subgroup ‘undecided’. But it is preferred to conduct a more advanced study to distinguish these problems further into ‘definitely not’ or ‘definitely’ a problem, for example by the use of focus group triage. In this study, we did not include them further in proposing for redesign.
In analyzing our definite problems with regard to the cognitive and ergonomical design principles, we compared our found problems with those issues stated in our list with design principles (Appendix VI.2 and VI.3). From this we scored how many problems were found per design issue. These results are displayed in Appendix VI.5 as being an overview of scored numbers of problems related to cognitive/ergonomical design principles. Also redesign
In general, considering the definite usability problems, most problems found stem from the defect category ‘other’ in which we find a lot of problems having to do with programming issues (n=17) of the prototype. Although being real problems in operating the prototype, in proposing for redesign we cite to the description list accompanied by the expert motivation, since these issues do not have cognitive and ergonomical origins.
We will not elaborate further on these issues. From the remaining list with problems, as referred to in the results section, we elaborate on the top three of scored ‘not applied’ principles.
1. Design principle Communication
At first place we saw that 13 problems concerned the design principle number six, being communication. Within this topic two issues (nr. 6.1 and nr. 6.4) contributed most (5 respectively 6 times). The first component concerned a rather major issue in subjects not understanding the function of the bolus button as currently presented. Also with respect to this component were problems in subjects misapprehending the meaning of the time
representation underneath the battery icon, along with the percentage presented inside this same icon and, a quite major issue, namely a wrong notation in the presented parameter time. In the current design, time passes from 1-100 seconds for a minute, not being very intuitive. Better would be the use of a time frame of 1-60 seconds.
The second component, (nr.6.4) concerned the issue of subjects not understanding the information presented due to the fact that it is not provided to them in a recognizable and/or correct text, sign, or symbol. This became specifically clear in the used terms user alarm, volume almost reached, pre-alarm and speed is changed, the last one present in the menu history. These terms did render a lot of questions as they were not common use in the task environment. The term speed changed was confused with a possible bolus infusion, in which one also changes speed.
2. Design principle screen/menu settings
Further, the option ‘OK’ in the first layer of the infusion history menu was not noticed followed by entirely missing the option to scroll further down this tab, resulting in task information not being found.
3. Design principles controllability/diagnostic feedback/alarms
Finally, we found three issues, equally ending in third place but being different design principles. We elaborate on the highest scoring issue of each topic only.
3.1 Controllability
The first topic comprises controllability in which the highest scored component (nr. 7.3) related to the fact that inefficient or redundant operations should be abandoned from a design when not worth for the process or direct safety (n=4).
Such operations will elicit resentment while handling, especially under time stress situations.
Examples of problems concerning this issue were found in administering a bolus (subjects just altered the speed and volume through the main menu, not using bolus, indicating that the way the current bolus operation has to be set did not render much difference to the normal alteration through the main dosage menu), and in having to press ‘OK’ twice before starting the pump after an alarm situation. Concerning the latter, it would be better to state that the first press is to ‘silence’ the auditory signal (press ‘OK’ to silence). This would help understand the asked operation.
3.2 Diagnostic feedback
The second topic comprises diagnostic feedback in which the highest scored component (nr.10.5) related to the fact that one has to ensure all task relevant information to be presented through text, signs or symbols (n=3). In this one a major omission was seen in the current design. When setting a bolus-infusion, no feedback was presented about a bolus being set, or what the initial settings were. This way, a colleague walking in could never see whether this was an initial setting or a bolus. Better use the split screen to present initial settings and bolus setting. Making the bar ‘bolus setting’ blink gives a clear indication of a running bolus, for the user and for additional users (e.g. colleagues).
3.3 Alarms
In the current design three alarms were missed (battery almost empty/false position
syringe/almost empty syringe). Complementary to this issue of alarms, one should consider whether to designate something as ‘alarm’ or ‘attention’. In the case of the almost empty syringes, the word ‘attention’ would be the most appropriate option. The attention almost empty syringe is crucial in time pressure multitasking environments. It provides time to prepare another syringe in time, preventing the infusion to stop.
For further design issues and their redesign alternatives, we refer to Appendix IX and X.
3.4.4. Design for both
When looking at the flower plot figure of the stripped data set more closely we see a lot of problems that are detected by both groups, but in a slightly unequal sharing.
[image:38.595.73.353.340.589.2]We concluded that problems were detected by both groups quite equally but a little skewness seemed present to the side of the ICU (upper boundary shows more plots) indicating that most problems were detected by the ICU-group therefore being more sensitive for these problems concerning the task set.
Also, a lot of problems are detected only by anesthesiologists (n=16), and some only by ICU-nurses (n=7), as in rejecting the null hypothesis under ρ ≤ 0.1 : 16: within ρ =0.1 “no
difference between both groups” (§3.4.2).
Relevant to our second focus in this study, these flower plots showed us the distribution of found problems between groups, indicating the amount of agreement. In our
recommendations we only focused on the category ‘definite usability problems’, therefore analyzing only the flower plots of the stripped data set (Appendix V.3.2). In this we observed a quite normal distribution of problems between both groups, indicating a reasonable
agreement between both groups regarding found ‘definite usability problems’.
This trend was used as input for elaborating about design for both, in that the more agreement on a detected problem the higher the possibility that the design issue concerned both groups. It still has to be considered whether the ultimate solution to eliminate the problem is backed by evidence.
3.5 CTA experience and Exterior appearance
Of all, 28 (77.8%) subjects filled out the post questionnaires concerning (1) experience with having to think aloud during test performance and (2) exterior appearance opinion. Both questionnaires were based on semantic differential scales of antagonisms. These
questionnaires were analyzed through box plot triage (§2.8.2.2). Box plots concerning CTA post questionnaires are shown in appendices III.2, III.3, and III.4. Box plots concerning design feature post questionnaire is shown in Appendix III.5. Concerning the CTA experience, central tendency was highly positive.
4. Discussion
Within this section we discussed our two main research goals. First, we elaborate on the first focus concerning problem detection rate, reliability and group diversity effects, and second, highlight our second focus concerning redesign recommendations and design for both.
4.1 Problem detection rate, reliability and group diversity effects
Efficiency of usability testing on a medical device
Criticize the magic number approach
The magic number approach assumes every study to be the same and therefore that a
universal fixed sample size will render the same discovery rate in any study. It is said that this assumption bears a drastic overestimation of detected problems. The doubt concerning the sufficiency of the magic number approach for our study was confirmed through our data in that the approach would indeed not have been sufficient in rendering 80% of the problems from a small sample size (e.g. five subjects). From analyzing the full data set of coded
problems, the number of observed problems from the first relatively small sample size (n=10), the 85% magic number target limit was not attained, nor did the secondary sample size of ten subjects. Also the combined sample