Samuel M. Wolpert' Mark E. Molitch2 James A. Goldman2
James B. Wood'
This article appears in the May/June 1984 issue of AJNR and the August 1984 issue of AJR.
Received August 25, 1983; accepted after revi-sion December 21, 1983.
1 Department of Radiology, Section of Neuro-radiology, New England Medical Center, 171 Har-rison Ave., Box 219, Boston, MA 02111. Address reprint requests to S. M. Wolpert.
2 Section of Endocrinology, New England Med-ical Center, Boston, MA 02111.
AJNR 5:263-267, May/June 1984 0195-6108/84/0503-0263 $00.00 © American Roentgen Ray Society
Size, Shape, and
Appearance of the Normal
Female Pituitary Gland
263
One hundred seven women 18-65 years old were studied who were referred for suspected central nervous system disease not related to the pituitary gland or hypo-thalamus. High-resolution, direct, coronal, contrast-enhanced computed tomography (CT) was used to examine the size, shape, and density of the normal pituitary gland. There were three major conclusions: (1) the height of the normal gland can be as much as 9 mm; (2) the superior margin of the gland may bulge in normal patients; and (3) both large size and convex contour appear to be associated with younger age. It was also found that serum prolactin levels do not appear to correlate with the CT appearances. Both low- and high-density areas were seen within the gland, and may be due to either tumors, cysts, infarcts, or metastases. Noise artifacts inherent in high-detail, thin-section, soft-tissue scanning may be a limiting factor in defining reproducible patterns in different parts of the normal pituitary gland.
Computed tomography (CT) has facilitated the radiologic recognition of pituitary gland enlargement. Direct coronal scans in which the interface between the gland and the suprasellar cistern can be seen clearly are preferable to axial scans with sagittal reconstruction because of the loss of spatial resolution inherent in refor -matted images. The configuration of the superior surface of the gland, its height, the integrity of the sellar floor, and the position of the infundibulum are all important factors to be considered in diagnosing pituitary tumors.
Many authors have described the appearances of both the normal and abnormal glands [1-11). While correlation of the CT appearances in life with postmortem examination of the glands is the most direct method for developing criteria of anatomic normality, examination of the CT scans of asymptomatic subjects with
normal pituitary hormone assays represents the best indirect method for developing
these criteria. We analyzed coronal CT scans of the pituitary gland in 107 women without suspected pituitary or hypothalamic dysfunction. Serum prolactin levels
were obtained in 102 of the women and were correlated with the CT appearances.
Subjects and Methods
One hundred seven women 18-65 years old referred for suspected central nervous system disease not related to the pituitary gland or the hypothalamus consented to have direct coronal scans of the sella following their standard scans, under guidelines established by the institution's Human Investigation Review Committee. The studies were not consecutive since about 20% of the women contacted refused the additional scans. The scans were obtained after the intravenous injection of 300 ml of Renografin 30 by drip infusion over 5-10 min. One hundred two of the women also had blood drawn immediately before contrast infusion for the measurement of prolactin and alpha-subunit levels.
The scans were obtained on the Somatom 2 Siemens scanner operated at 46 mA, 10 sec,
264 WOLPERT ET AL. AJNR:5, May/June 1984
Fig. 1. -Frontal coronal view of sella turcica and pituitary gland. Height of gland (arrow) (distance between sellar floor and top of gland) is 7 mm.
from the dorsum sellae to the anterior clinoid processes. Between four and six scans were obtained per patient.
The heights of the glands were determined by measuring the greatest distance between the sellar floor as seen on a scan imaged with a wide bone window to the top of the gland as imaged with a soft-tissue window (fig. 1). The superior surfaces of the glands were
classified as convex superiorly, flat, or concave superiorly. The den-sity patterns of the glands were assessed in four different regions
-through the anterior pituitary, the region of the pars intermedia, the
posterior pituitary, and immediately in front of the dorsum sellae-by analyzing four contiguous scans.
Prolactin levels were measured by double antibody radioimmu -noassay with antibody obtained from the National Hormone and Pituitary Program of the National Institutes of Health and the
Univer-sity of Maryland with standards purchased from Serono using minor
modifications of published techniques [12]. Alpha-subunit levels were measured by double antibody radioimmunoassay with antibody and standards obtained from the National Hormone and Pituitary Program
using previously published methods [13J.
Results
The heights and configurations of the glands and their relations to the age of the patients are set out in table 1 and figure 2. The heights varied between 1 and 9 mm (mean 5.7 mm). Larger glands were seen in the younger women. The superior margins of the glands were convex in 19, again more often in the younger than in the older women. The superior margins of the glands were concave in 33 patients, more often in the older than in the younger women (table 1). Empty sellae (gland heights 2 mm or less with the infundibuli extend-ing down to the superior margins of the sellar contents) were seen in six patients, all aged 43 or more. Partially empty sellae (gland heights 3-4 mm) were seen in a further 13 patients.
The density of the glands in the four different regions is set out in table 2. The most frequent pattern seen was that of a heterogeneous density (i.e., mottled appearance of both high-and low-density areas less than 3 mm in diameter) usually throughout the gland and involving the pars intermedia and the posterior pituitary regions. The pre-dorsum sellae region, however, was usually of a homogeneous density. An analysis of the seven patients with low-density areas greater than 3
TABLE 1: Pituitary Gland Surface and Height versus Age in 107
Women
Age Superior Surface No. Height (mm)
18-36 37-70
Convex Flat . Concave
9 8
19 6-9 14 5
55 4-8 28 27
33 1-7 12 21
o 0
<3.2>0 0 0
~ 0 ·; 00·
<;Jil!. 1:;) 1.1.!l.1. I •• 6
5 4
[image:2.613.54.238.85.222.2] [image:2.613.318.554.112.331.2]3
...
~
.
...
.---..."20 30 40 50 60 70
AGE (yrs)
Fig. 2.-Least squares fit relation of gland height and patient age in 107
women. Each dot represents one patient; encircled dots represent glands with convex superior margins. Linear correlation coefficient (r) = 0.047; P < 0.001.
TABLE 2: Density Patterns of the Pituitary Gland in Four Different Anatomic Regions
No. Patients by AnatomiC Reg,on' Density Pattern
3
Heterogeneous . . . . 37 60 62 24
Homogeneous . . . . . . . 1 4 1 46
Focal hypodensityt 2 7 5 0
Focal hyperdensityt 0 5 5 0
Empty:j: 5 6 6 6
Central hyperdensity with para
-central hypodensity 0 2 0
Note.-Only scans without artifacts were selected for analysis. Hypodensity and hyper· density are relative to the rest of the gland. Absolute Hounsfield numbers were not
considered Important because such values vaned among patients depending on the relation
between time of contrast administration and time of scan. Low·denslty values. however. were greater than cerebrospinal flUid and ranged between 23 and 56 H; high-density values were 86-122 H.
• Region 1 = anterior pitUitary; 2 = pars ,ntermed,a; 3 = posterior pituitary; 4 = pre-dorsum sellae.
t Areas greater than 3 mm In diameter. i Pituitary contents 2 mm or less In heIght.
[image:2.613.313.558.412.510.2]AJNR:5, May/June 1984 NORMAL FEMALE PITUITARY GLAND 265
Fig. 3.-A, Low-density area measur -ing 4 x 4 mm (arrow) is seen in left half of gland in pars intermedia region. B,
High-density area (arrow) is seen in center of gland. Although scan was obtained at end of, not during, administration of con -trast material, appearances suggest opa -cification of hypophyseal capillary bed.
A
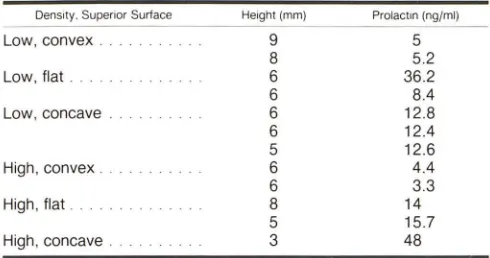
TABLE 3: Surfaces, Heights, and Prolactin Levels in Seven Women with Low-Density Areas and Five Women with High-Density Areas within the Pituitary Gland
Density. Superior Surface Height Imml Prolactin lng/mil
Low, convex. 9 5
8 5.2
Low, flat. 6 36.2
6 8.4
Low, concave . 6 12.8
6 12.4
5 12.6
High, convex 6 4.4
6 3.3
High, flat. 8 14
5 15.7
High, concave. 3 48
Note.- Hlgh-density areas were all greater than 3 mm in diameter.
The patient had a melanotic melanoma metastatic to the brain, and the high-density area may represent a pituitary metastasis.
The serum prolactin levels were initially elevated in eight patients (table 4). On repeat testing, however, the levels
remained elevated in only four patients. No specific relation between the gland heights, the configuration of the top of the
glands, the density patterns of the glands, and the elevated
serum prolactin levels were found. One of the four hyperpro-lactinemic patients had idiopathic seizures, a second had peripheral neurofibromatosis, and a third probably had optic neuritis. These patients may have had idiopathic hyperprolac-tinemia, but also remained suspect for harboring prol actino-mas. The fourth patient, the patient with a melanotic mela
-noma metastatic to the brain, had also undergone cranial
irradiation-a known cause of hyperprolactinemia [14). Al
pha-subunits were not elevated in the four patients.
Discussion
The size of the normal female pituitary gland varies widely.
According to Syvertsen et al. [1) the height varied between 2.7 and 6.7 mm in a series of 14 women without known sellar
or parasellar lesions who were referred for CT studies of the
B
temporal bone and skull base. Another report on direct co -ronal scans in 50 normal female volunteers indicated a normal maximum height of 9.7 mm [10). On reformatted sagittal images of patients of both genders with symptoms of orbital
disease but no clinical pituitary disease, Chambers et al. [9) determined that the height of the normal gland averaged 5.3 mm (±1.7 mm). The same authors sectioned the sphenoid
bones of 100 cadavers in the sagittal plane and found the height of the pituitary gland to average 5.2 mm (±2 mm). In an autopsy series of 205 pituitary glands, Muhr et al. [15)
found the mean gland height of the females to be 6 mm (SO
1 mm). In a CT series of 15 normal adult females, Peyster et
al. [8) found the mean height to be 4.8 mm (SO 1.7 mm) and
in an in vivo study of 30 female patients, Roppolo et al. [11)
found the mean height to be 4.2 mm (±1.4 mm).
Our data correlate well with this past experience. We also
agree that the top of the normal gland may be convex as has been stated by others [8, 10), but found the maximum height
to be greater than in all previous studies except that of Swartz
et al. [10). The relation between the heights of the glands,
their superior configurations, and the ages of the patients probably represents the childbearing potential of the younger patients.
The correlation of the serum prolactin levels with the
ap-pearances of the glands was undertaken in an attempt to determine whether a substantial number of the patients had
silent prolactinomas. These tumors, which are estimated to be present in 6%-13% of the normal population [16, 17], may
be seen as either low- or high-density areas [6). While persis-tent elevated prolactin levels were seen in four patients, in only three of them (one with a low-density area greater than 3 mm in diameter) could we state that tumors were possibly
present by endocrinologic criteria. Elevated alpha-subunits,
which are said to be secreted by some tumors otherwise characterized as non secretory [18, 19), were not found in any patient in our study.
It is known, however, that prolactin levels are not consist
-ently elevated in patients with prolactinomas [20). Conceiva -bly therefore prolactinomas could be present in the seven patients with large, low-density areas and in the five patients
[image:3.612.189.556.84.234.2] [image:3.612.52.297.288.417.2]266 WOLPERT ET AL. AJNR:5. May/June 1984
TABLE 4: Pituitary Gland Characteristics in Hyperprolactinemic Patients
Pituitary Prolactin (ng/ml) Etiology of
Age (years)
Density Surface Height (mm) Initial
25 .. Iso Flat 5 106.0
38 . Iso Concave 6 26.1
20 . Low Flat 6 36.2
37 . Iso Flat 6 29.0
38 High Concave 3 48.0
26 .. Iso Convex 8 26.3
42 Iso Concave 5 25.5
22 Iso Flat 6 27.8
have silent nonsecretory microadenomas, which were found
in 7%-14% of unselected autopsy specimens [16, 17].
How-ever, some of the low-density areas seen in our patients may
also be due to Rathke cleft cysts, infarcts, metastases,
epi-dermoid cysts, or abscesses [9, 21, 22]. Some of the
high-density areas may be due to transsellar communicating arter-ies between the cavernous carotid arterarter-ies or intercavernous sinus venous connections [23]. A high-density midline area
may also be due to the secondary hypophyseal capillary bed,
which can be seen on dynamic scans [24].
The density patterns in the four different regions of the
pituitary glands have been studied by others. Roppolo et al.
[11] analyzed 13 autopsy specimens and 30 normal pituitary
glands with high-detail coronal CT and defined different CT
density variations in different parts of the gland. Four specific
patterns were seen. Scans through the anterior pituitary often
showed a heterogeneous pattern; scans more posteriad
through the pars intermedia often showed midline lucent areas
due to colloid cysts. Further posteriad, scans through the
posterior pituitary gland showed a homogeneous central
dense area flanked on both sides by lucent areas due to the diverging pars intermedia. Finally on the most posterior scan,
immediately in front of the dorsum sellae, the posterior lobe
was seen as a nonhomogeneous cystic area. The authors did
not mention the incidence of these four patterns in their 30
patients. We could not confirm these patterns in our patients.
The amount of random noise in the different scanners may
be a factor accounting for our different results. Roppolo et al.
[11] found that the standard deviations of frontal horn
cere-brospinal fluid densities were 3.76-S.73 H, whereas we found
that the standard deviations were 6.3-9.8 H. A more likely cause for the different results may be the different techniques
used. The Somatom 2 routinely is operated at 460 mAs,
whereas the GE scanner used by Roppolo et al. was operated
at 614-960 mAs. To reproduce the results of Roppolo et al. with the Somatom 2 scanner, assuming the two scanners have similar spatial resolutions and reconstruction algorithms, it may be necessary therefore to double the radiation dose to the patient. However, only four of the 30 patients of Roppolo et al. were examined with 1.S-mm-thick coronal scans, al-though they stress that such scans are the most informative, whereas all the patients in our series were examined with 2
Reason for CT
Repeat Hyperprolactlnemla
32.8,37.8 Seizures Idiopathic
12.8 Meningioma with
multiple infarcts
33.4 Neurofibromatosis Idiopathic
26.5 Probable optic Idiopathic
neuritis
42.8 Metastatic mela- Cranial irradiation
noma
11.0,9.0 Pseudotumor of
orbit
15.0,20.0 Headaches
6.7,6.6 Optic atrophy
mm slices. Before the results of Roppolo et al. are acceptable
it would be necessary to have a far larger series of 1.S mm
direct coronal scans analyzed.
In conclusion our results suggest that the height of the
normal gland can be as much as 9 mm, that the superior
margin of the gland may bulge in normal patients, and that
both of these factors appear to be related to the age of the
patient. Estimation of the serum prolactin levels does not
appear to correlate with the scan appearances, at least in the
normal population. Low- and high-density areas seen within
the gland may be due to tumors, cysts, infarcts, or
metas-tases. The noise inherent in high-detail, thin-section,
soft-tissue scanning may be a limiting factor in defining reprodu
-cible patterns in different parts of the pituitary gland.
REFERENCES
1. Syvertsen A, Haughton VM, Williams AL, Cusick JF. The
com-puted tomographic appearance of the normal pituitary gland and
pituitary microadenomas. Radiology 1979;133: 385-391
2. Cusick JF, Haughton VM, Hagen TC. Radiological assessment
of intrasellar prolactin-secreting tumors. Neurosurgery 1980;
6:376-379
3. Bonafe A, Sobel 0, Manelfe C. Relative value of computed
tomography and hypocycloidal tomography in the diagnosis of
pituitary microadenoma. A radio-surgical correlative study.
Neu-roradiology 1981;22: 133-137
4. Hemminghytt S, Kalkhoff RK, Daniels DL, Williams AL, Grogan
JP, Haughton VM. Computed tomographic study of
hormone-secreting microadenomas. Radiology 1983;146: 65-69
5. Taylor S. High resolution computed tomography of the sella.
Radiol Clin North Am 1982;20:207-236
6. Gardeur 0, Naidich TP, Metzger J. CT analysis of intrasellar
pituitary adenomas with emphasis on patterns of contrast
en-hancement. Neuroradiology 1981 ;20: 241-247
7. Sakoda K, Mukada K, Yonezwa M, Matsumura S, Yoshimoto N,
Mori S. CT scan of pituitary adenomas. Neuroradiology
1981 ;20: 249-253
8. Peyster RG, Hoover ED, Viscarello RR, Moshang T, Haskin ME.
eT appearance of the adolescent and preadolescent pituitary gland. AJNR 1983;4:411-414
[image:4.612.55.573.100.243.2]AJNR:5, May/June 1984 NORMAL FEMALE PITUITARY GLAND
267
10. Swartz JD, Russell KB, Basile BA, O'Donnell PC, Popky GL.
High resolution computed tomographic appearances of
intrasel-lar contents in women of childbearing age. Radiology
1983;147:115-117
11. Roppolo HMN, Latchaw RE, Meyer JD, Curtin HD. Normal
pituitary gland: macroscopic anatomy-CT Correlation. AJNR
1983;4:927-935
12. Sinha YN, Selby FW, Lewis UJ, Vanderlaan WP. A homologous
radioimmunoassay for human prolactin. J Glin Endocrinol Metab
1973;36:509-516
13. Edmonds M, Molitch ME, Pierce J, Odell WD. Secretion of alpha
and beta subunits of TSH by the anterior pituitary. Glin Endocrinol
(Oxf) 1975;4:525-530
14. Huang K. Assessment of hypothalamic-pituitary function in
women after external head irradiation. J Glin Endocrinol Metab
1979;49: 623-627
15. Muhr C, Bergstrom K, Grimelius L, Larsson SG. A parallel study
of the sella turcica and the histopathology of the pituitary gland
in 205 autopsy specimens. Neuroradiology 1981;21 :55-65
16. Kovacs K, Ryan N, Horvath E, Singer W, Ezrin C. Pituitary
adenomas in old age. J Geronto/1980;35:16-22
17. Burrow GN, Wortzman G, Rewcastle NB, Holgate RC, Kovacs
K. Microadenomas of the pituitary and abnormal sellar
tomo-grams in an unselected autopsy series. N Engl J Med
1981 ;304: 156-158
18. MacFarlane lA, Beardwell CG, Shalet SM, Darbyshire PG,
Hay-ward E, Sutton ML. Glycoprotein hormone alpha-subunit secre
-tion in patients with pituitary adenomas; influence of TRH, LRH
and bromocriptine. Acta Endocrinol (Copen h) 1982;99:487-492
19. Kourides lA, Weintraub BD, Rosen SW, Ridgeway EC, Kliman
B, Maloof F. Secretion of alpha-subunit and glycoprotein
hor-mones by pituitary adenomas. J Glin Endocrinol Metab
1976;43:97-106
20. March CM, Kletzky OA, Davajan V, et al. Longitudinal evaluation
of patients with untreated prolactin-secreting pituitary adenomas.
Am J Obstet GynecoJ 1981; 139: 835-844
21. Shuangshoti S, Netsky MG, Nashold B. Epithelial cysts related
to the sella turcica. Arch Pathol Lab Med 1970;90:444-450
22. Spaziante R, de Divitiis E, Stella L, Cappabianca P, Donzelli R.
Benign intrasellar cysts. Surg Neurol 1981; 15: 274-282
23. Rhoton AL, Harris FS, Renn WHo Microsurgical anatomy of the
sellar region and cavernous sinus. Glin Neurosurg 1977;24:5
4-85
24. Bonneville JF, Catlin F, Moussa-Bacha K, Portha C. Dynamic
computed tomography of the pituitary gland: the "tuft sign."