K. J. Kearfott1 D. A. Rottenberg1 M. D. F. Deck2
Received June 15, 1982; accepted after rev i-sion October 20, 1982.
This work was supported in part by HEW Public Health Service grant NS 15665.
'Department of Neurology, Memorial Sioan-Kettering Cancer Center, 1275 York Ave., New York, NY 10021. Address reprint to K. J. Kearfott.
2Department of Radiology, Memorial Si oan-Kettering Cancer Center, New York, NY 10021.
AJNR 4:195-199, March/April 1983 0195-6108/83/0402-0195 $00.00 © American Roentgen Ray Society
Optimization of
Xenon-Enhanced CT Studies:
Beam
Energy, Enhancement, Root Mean
Square Deviation, and Repeatability
195
The effects of varying beam energy on the computed tomographic (CT) enhance-ment-to-noise (S:N) ratio were studied experimentally with the DeltaScan 2020 and GE 8800 CT scanners and a 20-cm-diameter cyclindrical Plexiglas phantom containing 11 50 ml syringes filled with varying amounts of xenon and iodine. Enhancements of 54.2, 36.7, and 31.7 Hounsfield units (H)/mg Ilml were measured with the DeltaScan 2020 at 70,100, and 120 kVp, respectively, with corresponding root mean square deviations (RMSDs) of 12, 7, and 5 H for 400 mAs scans. For the GE 8800, enhancements of 48.3, 37.6, and 32.7 H/mg Ilml were measured at 80,100, and 120 kVp with RMSDs of 13, 8, and 7 H for 9.6 sec 320 rnA scans (3.3 msec pulse). RMSD was independent of enhancement over the range of iodine concentrations studied (0-1.5 mg I/ml) and was only a weak function of region-of-interest (ROI) size. For repeated scans with the DeltaScan 2020, measurements in 17
x
17 pixel regions were reproducible to within 0.8 H for all techniques and a drift in calibration of less than 6% was observed after 8 months of clinical use. For both the DeltaScan 2020 and the GE 8800, at the milliam-perage studied, lower-energy techniques offered no advantage over 120 kVp technique for xenon CT measurements of regional cerebral blood flow, which are feasible usingeither of these scanners.
Stable xenon with computed tomography (CT) has been proposed for clinical
measurements of regional cerebral blood flow (rCBF) [1-4]. (Xenon is anesthetic
when the inspired concentration exceeds 50% [5]; at lower inspired con
centra-tions, sedative effects are minimal or absent [3].) The accuracy and reproduci-bility of xenon CT rCBF measurements are critically dependent on the xenon
enhancement-to-noise (or signal-to-noise, S:N) ratio [6]. Further, xenon
enhance-ment and image noise are both functions of the CT beam energy used. ("Enhancement" refers to an increase in CT number due to the presence of
stable xenon or other contrast medium.) To optimize CT scanning technique for
clinical xenon CT rCBF studies and to estimate errors due to machine calibration
and image noise, the effects of varying kilovoltage on enhancement and root
mean standard deviation (RMSD) must be determined over the range of enhance-ments with clinically feasible CT techniques. The enhancement/RMSD ratio was found to be maximal at 90-100 kVp for both the EMI Mark I [7] and the EMI
1010 [8], for which it was possible to increase the milliamperage for the l
ower-energy scans to maintain constant heat load.
Our interest in xenon CT [4, 6] led us to: (1) measure the enhancement/RMSD ratio for the DeltaScan 2020 and GE 8800 CT scanners, (2) determine the
standard deviation of repeated CT measurements, and (3) examine the effects of
196 KEARFOTT ET AL. AJNR:4, Mar.l Apr. 1983
Theory
CT Enhancement
The observed enhancement or increase in CT number, E,
in Hounsfield units (H) due to the presence of a contrast medium i may be determined from:
1 ,000(f.!/ p);C,
E = - - - ' - - ' - ' - - (1 )
f.!w
where f.!w is the linear attenuation coefficient of water and
(f.!/ P)i and Ci are the mass attenuation coefficient and co
n-centration of i, respectively. As the effective energy of the
CT x-ray spectrum approaches the K-absorption edge (34.6
keV for xenon), f.!/ P peaks, and E is therefore maximized. Hence, enhancement should increase as CT beam energy
decreases from 120 kVp to 70 kVp and lower.
CT Noise and Repeatability
The observed "noise" in a CT image reflects radiation
quantum variations, tissue inhomogeneity, and the effects of CT reconstruction and image processing. In conventional CT scans, quantum noise dominates over the contribution
of tissue inhomogeneity [9]. Further, the observed noise is
extremely dependent on scanning technique (including the milliamperage and beam energy) and reconstruction filtering
[10].
For the same milliamperage, CT noise will increase if the effective beam energy is decreased because of greater beam attenuation and consequent worsening of quantum
statistics. Since tube heating limitations, short scanning
times required for xenon CT rCBF studies, and the available repertoire of machine calibrations effectively constrain CT technique, only selected Delta-Scan 2020 and GE 8800
techniques will be considered.
The variance for a ROI of N pixels will be taken as a measure of CT noise:
~N(A _ H)2
(RMS0)2 = ' ,
(N - 1) (2)
where RMSD is the pixel root mean square deviation,
H
is the mean Hounsfield number for the region, and Hi is the Hounsfield number for the i'h pixel.As defined above, the variance is nearly constant over the range of CT numbers of interest [11]. The proportional error (PE) in measured xenon enhancement, E, for a ROI
containing N pixels may be estimated as [12]:
2'h·RMSD
PE = E.N'h (3)
where the 2'12 factor reflects the subtraction of two
inde-pendent measurements (enhanced scan - baseline scan)
with the same RMSD. The repeatability of a measurement may be determined by taking the standard deviation of the mean of a number of different scans.
Figure-at-Merit tor Xenon CT rCBF Studies at Different Energies
The suitability of a given CT technique depends not only
on the observed change in enhancement for a given change
in xenon concentration but also on the noise inherent in
such measurements. The slope of the CT enhancement/
RMSD curve as a function of contrast concentration should therefore serve as a figure-of-merit for comparing the use of
different energies for xenon CT rCBF studies. This figure -of-merit (FOM), which is relatively independent of observed
enhancement (thus facilitating the comparison of data from
different sources), is given by:
E
FOM = - - - : - - -
,,-(RMSD· C)' (4)
where C represents the concentration of xenon in mg/ml.
Methods
A 20-cm-diameter cylindrical Plexiglas phantom was constructed with 11 radially disposed holes for 50 ml syringes. Either iodine, in the form of metrizamide (0.05-1.5 mg I/ml), or xenon gas (0.1-0.6 mg Xe/ml) was added to normal saline to cover the range of contrast enhancement expected in clinical xenon CT rCBF studies. Two nonenhanced saline references were included. CT scans with the DeltaScan 2020 were taken at 70, 100, and 120 kVp for both 256 x 256 (400 mAs) and 512 x 512 reconstruction matrices (400 and 800 mAs). For the GE 8800, scans at 80, 100, and 120 kVp were obtained (9.6 sec, 320 mA, 3.3 msec pulsed source, 320
x 320 reconstruction matrix). ROls (17 x 17 to 21 x 21 pixels, with each pixel 1 x 1 mm) were placed within the areas co rrespond-ing to the syringes.
Ten rapid (every 1-2 min) sequential scans of the phantom with metrizamide and five sequential scans of a 20-cm-diameter uniform water phantom were also obtained at 70, 100, and 120 kVp using the DeltaScan 2020. Thirty-six ROls varying in size from 8
x
8 to 174 x 174 pixels were centered on the water phantom in order to determine the dependence of RMSD on ROI size. Pixel regions of 18 x 18 were centered in the water phantom scans to examine measurement reproducibility.Theoretical estimates of enhancement for the DeltaScan 2020 based on effective energies of 51, 62, and 70 keV with 70, 100, and 120 kVp beams [13] were made. Mass attenuation coefficients were computed by interpolating the available data [14] for both energy and atomic number. A solubility of 0.107 ccl g for xenon in 0.9% NaCI at 25°C [15] and a density of 5.15 mglml, corrected for ambient temperature and pressure, were used to compute the xenon concentration.
Results
Iodine and Xenon Enhancements
At all three energies the average measured enhancement for iodine differed from the predicted enhancement by less
than 6 H. These results agree well with observed differences of less than 10 H for elements of atomic number below 60
AJNR:4, Mar.jApr. 1983 CT BEAM ENERGY EFFECTS 197
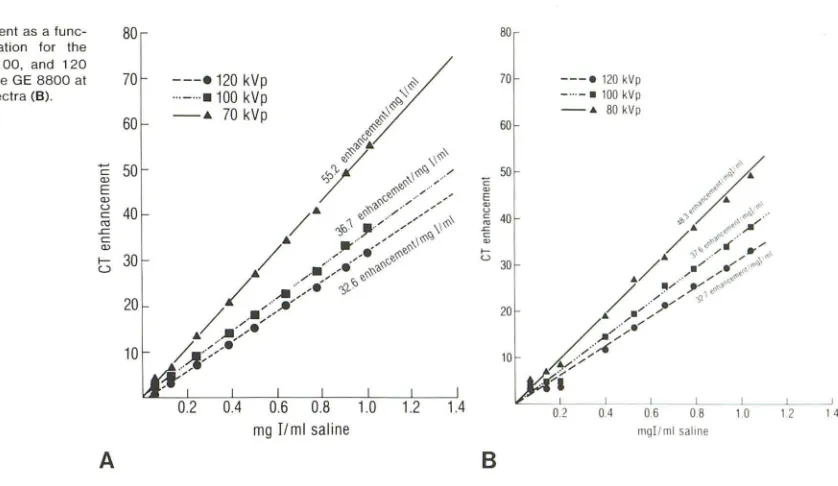
Fig. 1 .-CT enhancement as a func
-tion of iodine concentration for the DeitaScan 2020 at 70, 100, and 120 kVp spectra (A) and for the GE 8800 at 80, 100, and 120 kVp spectra (8).
C
Q.)
E
Q.) '-' c:: co .c c::
Q.)
I -u
A
80
70
60
50
40
30
20
10
---e120 kVp
.. ·-··.100 kVp
- 4 70 kVp
mg Uml saline
compared with the theoretical prediction of 2.4%. The larger observed difference is attributed to variations in the concen-tration of test solutions and inaccuracies in the xenon solu-bility data.
The CT enhancement data is plotted as a function of iodine concentration in figure 1 A for the DeltaScan 2020 and in figure 1 B for the GE 8800. The corresponding best fits to the experimental data (r2
>
0.97 for all curves) are included. The calibrations at 70, 100, and 120 kVp were measured as 55.2, 36.7, and 32.6 H enhancementlmg IIml for the DeltaScan 2020 and 48.3, 37.6, and 32.7 H enhancementlmg Ilml for the GE 8800 at 80, 100, and 120 kVp. After 8 months, during which time the DeltaScan 2020 was in continuous clinical use and underwent a change of x-ray tubes with associated retuning, a repeat experiment reproduced earlier calibration values to within 5.8% at all three energies. Adding a parabolic aluminum filter (thickness varying from 4 mm to several centimeters at the edge) to the DeltaScan 2020 changed the calibration by 5%-7% for the range of iodine concentrations studied.
RMSO
No correlation was observed between CT enhancement and RMSD for the small enhanced regions in the Plexiglas phantom. Average RMSDs for the DeltaScan 2020 with 400 mAs scans was 10-13 H at 70 kVp, 6.2-7.4 H at 100 kVp,
and 4.8-5.1 H at 120 kVp for the metrizamide-filled phan-tom with 18 X 18 pixel ROls. For the water phantom, RMSDs of 14.8, 7.9, and 6.3 for equivalent ROls at 70, 100, and 120 kVp were observed (these are about 9% -12% higher than those observed in the metrizamide pha n-tom). The corresponding variations due to placement of the
80
70
60
20
10
B
- - - . 120 kVp _ .. - . 100 kVp - .. 80 kVp
0.2 04
L ~-L __ ~ __ ~
06 08 10 12 14
mgIlml saline
ROls in the center of the uniform water phantom were 0.5,
0.2, and 0.1 H.
As expected, the measured RMSD for the uniform water phantom was only a weak function of ROI size for ROls greater than 7 X 7 pixels. For the 120 kVp scan at 400 mAs with the DeltaScan 2020 the data was fit by
RMSO = 7.016 - 0.00931 N'h(r2 = 0.966), (5)
where N is the number of ROI pixels. Similar results were
observed at the other energies. Repeated measurements with the DeltaScan 2020 separated by an 8 month period revealed variations in the measured RMSD of 1 %-24%, but the larger variations in RMSD are believed to be due to ROI and phantom positioning and regional variations in RMSD rather than to machine performance changes.
Scans with the DeltaScan 2020 at 200 mAs had RMSDs
2.3 times those at 400 mAs, while 800 mAs scans produced only a 15% improvement in RMSD for 512 X 512 recon
-structions. For 70 and 100 kVp, increasing the milliampe
r-age from 400 to 800 mAs decreased the RMSD by a factor of about 2. ROls in the metrizamide phantom scanned with the GE 8800 had RMSDs of 12-14, 7.8-9.0, and 6.2-6.8
H at 80, 100, and 120 kVp.
Relative Merit of 70 or 80, 100, and 120 kVp Techniques
Table 1 summarizes the figures of merit for the DeltaScan 2020 and GE 8800 techniques studied. For the DeltaScan 2020, reconstructing at 256 X 256 did not substantially improve the S:N for scans done at 120 kVp but did improve
[image:3.612.135.554.80.323.2]198 KEARFOTT ET AL. AJNR:4, Mar.! Apr. 1983
TABLE 1: Enhancement-to-Noise (S:N) Ratios of 70-80, 100,
and 120 kVp Techniques
DeltaScan 2020
CT Technique
200 mAs 400 mAs (kVp)
512' 512't 512't 256'
120 4.7 10.8 9.9 11.0
100 6.0 6.6 10.5
80
70 5.1 4.6 8.9
Nole. S:N ralio = (CT enhancemenI/RMSD)/(mg Ilml saline). • Reconstruction matrix.
t Repealed measurements separated by 8 months.
GE 8800
800 mAs 9.6 sec 320 rnA
512' 320'
12.4 5.0
13.5 4.5
3.6
10.4
was clearly superior to the other DeltaScan 2020 techniques
studied.
For a 256
x
256 reconstruction with the DeltaScan 2020, there was little difference between 100 and 120 kVp tech-niques. At 800 mAs there was an overall improvement ofabout 10% in the S:N ratio; however, the longer scanning
time needed to achieve these statistics is suboptimal for
xenon CT rCBF measurements, both in terms of temporal
sampling and the possible introduction of temporal artifacts
[16]. The increase in noise at 70 kVp precludes any
advan-tages arising from an increase in enhancement at this beam
energy for the techniques studied.
For the GE 8800 techniques studied, the 120 kVp
tech-nique seemed superior at the given milliamperage. Figures
-of-merit were generally lower for the GE 8800 than for the
DeltaScan 2020, but it should be remembered that this is a
function of effective milliamperage as well as reconstruction parameters.
Repeatability and Precision of Measurements
Like the RMSD, the repeatability (standard deviation of
several measurements) was found not to be a function of the iodine concentration or enhancement in the small subre-gions of the phantom. For the 17
x
17 pixel regions in the metrizamide phantom, the various enhancements were re-produced to within 0.78,0.27, and 0.34 H for 10 repeatedscans at 70, 100, and 120 kVp, respectively; for five scans
of the water phantom, repeatabilities of 0.26, 0.16, and 0.13 H were achieved at these energies. No systematic drifts were observed.
Estimate of Proportional Error in Enhancement Measurements
Table 2 summarizes the proportional error, estimated
using equation 3, for different concentrations of xenon and
ROI size for xenon CT enhancement based on the measured
RMSD and CT calibration for both the DeltaScan 2020 and
the GE 8800. The superiority of the 120 kVp technique is
apparent.
Discussion
With both the DeltaScan 2020 and GE 8800 CT scanners,
measured iodine or xenon enhancement correlated well with
TABLE 2: Proportional Error in Enhancement Measurements
Scanner Pixels 70 kVp 100 kVp 120 kVp
DeltaScan 2020 (400 mAs, 512 X 512):
0.05 mg Xe/ml 100 0.615 0.471 0.262
200 0.435 0.333 0.185
0.10 mg Xe/ml 100 0.307 0.236 0.131
200 0.217 0.167 0.093 0.15 mg Xe/ml 100 0.205 0.157 0.087
200 0.145 0.111 0.062
Scanner Pixels 80 kVp 100 kVp 120 kVp
GE 8800 (320 mA, 9.6 sec, 3.3 msec pulse):
0.05 mg Xe/ml 100 0.786 0.629 0.566
200 0.556 0.444 0.400 0.10 mg Xe/ml 100 0.393 0.314 0.283
200 0.278 0.222 0.200
0.15 mg Xe/ml 100 0.262 0.210 0.189
200 0.185 0.148 0.133
that predicted based on the equivalent energy of the CT
beam. The calibration of the DeltaScan 2020 for xenon CT rCBF studies was amazingly stable (within 6%) over an 8 month period.
The RMSD of pixel values was independent of the mag
-nitude of enhancement and ROI size over the range of iodine
and xenon concentrations studied. For the CT techniques studied, any advantage in enhancement at lower energies
was overwhelmed by noise. With constant heat load, how
-ever, lower energy techniques are superior [7, 8]. The observed RMSD may be reduced by increasing milliamper
-age, reconstructing with a coarser matrix, or by employing special reconstructing filtering or front-end smoothing. Re-gional variations in RMSD may be minimized (although not completely eliminated) by careful machine calibration.
Excellent repeatability and an absence of systematic drift
were observed for the DeltaScan 2020 during rapidly re
-peated scan sequences similar to those used for xenon CT
rCBF measurements. Standard deviations for series of
rapid-fire scans were less than 0.8 H for all three techniques
studied. The impressive stability and favorable
signal-to-noise characteristics of the of the DeltaScan 2020 and GE
8800 CT scanners allow for accurate CT measurements of
rCBF during stable xenon inhalation.
ACKNOWLEDGMENTS
We thank Vijay Dhawan (Department of Neurology, Memorial
Sloan-Kettering Cancer Center) and Victor Haughton (Department
of Radiology, Medical College of Wisconsin, Milwaukee) for provid-ing scans with the GE 8800; and Paula Carmichael (New York University, New York) for assistance with data analysis.
REFERENCES
1. Winkler SS, Sacket JF, Holden JE, et al. Xenon inhalation as an adjunct to computerized tomography of the brain: preli mi-nary study. Invest Radio/1977; 12: 1 5-1 8
2. Drayer BF, Dujorny M, Wolfson SK, et al. Xenon-and i
odine-enhanced CT of diffuse cerebral circulatory arrest. AJNR
1980; 1 : 227 -232
[image:4.612.316.560.92.257.2] [image:4.612.57.299.104.194.2]AJNRA, Mar.jApr. 1983
CT
BEAM ENERG
Y
EFFECTS
199Local cerebral blood flow measured by CT after stable xenon
inhalation. AJNR 1980;1 :213-225
4. Rottenberg DA, Goldiner P, Dhawan V, Kearfott KJ.
Measure-ment of regional cerebral blood flow in human subjects using
stable xenon and computerized tomography. Trans Am Neural
Assoc (in press)
5. Cullen SC, Gross EG. The anesthetic properties of xenon in
animals and human beings, with additional observations on
krypton. Science 1951; 113: 580-582
6. Rottenberg DA, Lu HC, Thaler HT, Kearfott KJ. The meas
ure-ment of rCBF using CT and stable xenon. J Cerebral Blood
Flow Metab 1981; 1 (Suppl 1): 527 -528
7. Kelcz F, Hilal SK, Hartwell P, Joseph PM. Computed
tomo-graphic measurement of the xenon brain-blood coefficient and
implications for regional cerebral blood flow: a preliminary
report. Radiology 1978; 127: 385-392
8. Keller MR, Kessler RM, Brooks RA, Kirkland LR. Optimum
energy for performing CT iodinated contrast studies. Br J Radial 1980;53:576-579
9. Duerinckx AJ, Macovski A. Information and artifact in co
m-puted tomography image statistics. Med Phys 1980; 7: 1
27-134
10. Hemmingsson A, Jung B, Ytterbergh C. Noise and noise texture
in CT images before and after post-processing. Acta Radial
[Oiagn] 1980;21 :807-812
11. Thaler HT, Lu, HC, Rottenberg DA. Technique for locating homogeneous regions within CT brain slices. AJNR 1980; 1 : 475-476
12. Rottenberg DA, Lu HC, Kearfott KJ. The in vivo autoradi -ographic measurement of regional cerebral blood flow using stable xenon and computerized tomography: the effect of
tissue heterogeneity and computerized tomography noise. J
Cerebral Blood Flow Metab 1982; 2: 1 73-1 78
13. Judy PF, Adler GJ. Comparison of equivalent photon energy calibration methods in computed tomography. Med Phys 1980; 7: 685-691
14. Evans R. "X-ray and y-ray interactions". In: FH Attix, Roesch
WC, eds. Radiation dosimetry, vol 1: Fundamentals, 2d ed,
New York: Academic Press, 1968: 93-155
15. Yeh SY, Peterson RE. Solubility of carbon dioxide, krypton and xenon in aqueous solutions. J Pharm Sci 1964; 53: 822-824
16. Wingfat RI. Local cerebral homodynamics by tracing stable
xenon with transmission computed tomography (Ph.D. disse