INFRASOUND SENSITIVITY IN THE PLAICE
{PLEURONECTES PLATESSA)
BY HANS ERIK KARLSEN
Institute of Biology, University of Oslo, 0316 Oslo, Norway
Accepted 22 June 1992
Summary
The sensitivity of plaice (Pleuronectes platessa) to infrasound has been exam-ined using a seawater-filled test chamber suspended by steel wires like a swing and driven by a vibrator. The sensitivity to low-frequency vibrations was determined using the cardiac conditioning technique. All plaice readily responded to infrasound down to 0.1 Hz, which was the lowest frequency tested, with threshold values of approximately 4xlO~5ms~2 rms. This sensitivity is comparable to infrasound thresholds found in other fish species and it agrees with the acceler-ation thresholds for plaice in the frequency range 30-100 Hz. The water movements relative to the fish surface produced during stimulation were below lateral-line thresholds. The inner ear otolith organs are thus probably responsible for the observed responses to infrasound. The hearing capabilities of plaice may be explained by these organs functioning as slightly underdamped harmonic oscillators with a resonant frequency close to 100Hz.
Introduction
The inner ear and the lateral line in fish are used in the detection of propagated sound waves and hydrodynamic water flows. The sensory elements in both systems are mechanosensitive hair cells, which respond to nanometre displacements of their apical hair bundles (Kroese and van Netten, 1989). In the epidermal lateral-line organs, or neuromasts, the apical sensory hairs are coupled to an overlying gelatinous cupula. The stimulus for these sensory organs in the skin is water flow relative to the fish surface, causing the cupula to slide over the hair cell epithelium and thereby stimulating the hair cells (Sand, 1981; van Netten and Kroese, 1987, 1989). The wide distribution of superficial and canal neuromasts on the body of a fish makes the lateral-line system well adapted for detecting spatial patterns of water flow past the skin. This information is of vital importance in behavioural tasks such as subsurface short-range prey detection and localization (Enger et al. 1989; Montgomery, 1989), close-range obstacle and predator avoidance (Weissert and von Campenhausen, 1981; Hassan, 1989; Blaxter and Fuiman, 1990) and surface feeding (Bleckmann et al. 1989; Elepfandt, 1989; Gorner and Mohr, 1989).
Fish flesh has nearly the same acoustic properties as sea water. Consequently,
although a fish near a sound source may experience water flows impinging locally on its body, the displacement field produced will encompass the whole fish when it is at some distance from the source and this will cause it to move with the same phase and amplitude as the surrounding water particles (de Vries, 1950). The lateral-line neuromasts will not be activated by these stimuli, but the three pairs of otolith organs found in the inner ear are ideally suited for detecting such imposed whole-body movements (see Kalmijn, 1989). These sensory organs are inertial detectors in which a dense calcareous otolith is mechanically coupled to a large hair cell macula through a gelatinous otolith membrane. When the fish is accelerated, the dense otolith will lag behind, creating shearing movements of the sensory hairs and thus stimulating the hair cells. In this way, the inner ears in fish are directly sensitive to the kinetic component of a sound field. The transition between lateral-line and inner ear function probably occurs at very short source distances of, at most, a few fish body lengths (Denton and Gray, 1983).
Recent theoretical and experimental results (Denton and Gray, 1983, 1988, 1989; Kroese and Schellart, 1987; Kalmijn, 1988, 1989) suggest that neuromasts sense water acceleration relative to the body surface or a combination of water acceleration and velocity. Their optimal frequency range is mainly below 100 Hz and probably extends well into the infrasound region. Traditionally, such extreme low-frequency sensitivity was believed to be the sole domain of the lateral-line system (see Sand, 1984). However, the inner ears of both the Atlantic cod (Gadus morhud) and the perch (Perca fluviatilis) are highly sensitive to infrasound down to 0.1 Hz and 0.3Hz, respectively (Sand and Karlsen, 1986; Karlsen, 1992). The infrasound studies on these species were performed using a standing-wave acoustic tube in which the whole water column inside the tube, including the fish being tested, was set into low-frequency sine wave movement by vibrators. In the initial study on Atlantic cod, an involvement of the lateral line in the observed infrasound responses could not be excluded. Additional experiments were therefore performed on the freshwater perch using the cobalt method (Karlsen and Sand, 1987) to block the lateral-line organs selectively. This treatment did not affect the acute infrasound sensitivity in this species, suggesting that the infra-sound was detected by the inner ear. A shortcoming of the acoustic tube was the limited working range of the vibrators, which made it impossible to produce the large displacements necessary to create accelerations well above thresholds at 0.1 Hz and 0.3 Hz, the lowest frequencies tested. This reduced the possibility of conditioning to these frequencies and required a compromise in the stimulation procedure, causing the acceleration to be initiated at its peak value (Sand and Karlsen, 1986). In addition, large displacements would increase the boundary zone close to the tube wall and reduce the homogeneity of the water flow inside the tube. In the present study, these difficulties were overcome by moving the fish and the surrounding water as a unit. The experimental design also allowed sufficiently large displacements to achieve an optimal stimulus waveform at the lowest frequencies tested, giving a sine-wave acceleration starting at zero.
Flatfish are sensitive to the kinetic sound components in the whole audible frequency range since they do not possess a gas-filled swimbladder, which is known to induce sound-pressure sensitivity in other fish (see Sand and Enger, 1973). The hearing capabilities of the plaice have also been tested in a conditioning study under nearly ideal experimental conditions in the sea (Chapman and Sand, 1974). Replotting the plaice audiogram from Chapman and Sand (1974) in terms of acceleration (see Fig. 4) shows an upper frequency limit of about 200 Hz and an optimal and flat frequency sensitivity from 100 Hz to 30 Hz, which was the lowest frequency examined in that study. Hearing in this species is therefore likely to extend into the infrasound region.
Materials and methods
Animals
Plaice (Pleuronectes platessa) (28-32 cm) were caught in gill nets in the sea close to the test site. Before being used in experiments, the plaice were kept for 1-2 weeks in large storage tanks circulated with sea water. During this adaptation period they started to feed regularly.
Experimental apparatus
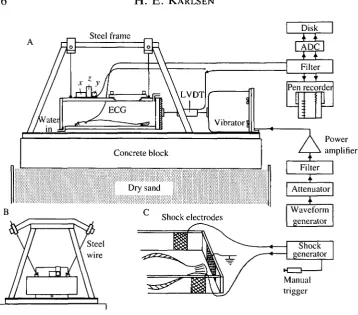
The plaice were tested in a thick-walled (15 mm) Perspex chamber with inside dimensions of 40cmX30cmX10cm. The test chamber was suspended by four 27 cm long steel wires attached to a solid steel frame (Fig. 1). The chamber was slowly circulated with sea water, which passed through a mechanical pressure equalizer before entering the chamber to ensure a constant flow rate. The circulation could also be turned off by stop screws at the water inlet and outlet. The fish were placed inside the chamber through a rectangular opening in the top plate. The opening was then firmly closed with a lid and eight locking screws. The top plate and the lid were transparent, making it easy to ensure that all the air left the chamber through the water outlet when the chamber was filled with sea water.
Since the chamber was suspended like a swing, it was impossible to eliminate vertical movements completely. However, for the displacements used in the present study the horizontal movements exceeded the vertical and transverse movements by 30 dB or more. The chamber was driven by a vibrator (Derritron-VP3) with a 10 mm working range. The VP3 has a mass of 23 kg and was bolted to the steel base of the apparatus. The accelerating force developed by the vibrator was transferred to the chamber through a connecting brass rod fixed to a 5 cm wide and 5 mm thick steel plate attached to the end plate of the chamber. The movements of the chamber were measured by a linear variable differential transformer (Shaevitz, 100 DC-D; frequency response d.c. to 500Hz ( - 3 d B ) ; sensitivity 4mVlum~l) incorporated as part of the axis between the vibrator and
Power amplifier
[image:4.595.121.480.126.441.2]Manual trigger
Fig. 1. The experimental apparatus used for examining the sensitivity of plaice to infrasound. The fish was placed inside a thick-walled Perspex chamber, which was slowly circulated with sea water (A). The chamber was suspended like a swing by four steel wires (B) and driven by a vibrator. The whole apparatus was mounted on a steel plate, which was firmly attached to a concrete block resting on dry sand. The displacement of the chamber was measured by a linear velocity differential transducer (LVDT). Each brief sound stimulation was followed by a mild electric shock applied to the tail by shock electrodes attached to the side walls of the chamber (C). See text for further details, x, y, z, vibration meter measuring movements in the x, y and z directions.
attaching the experimental apparatus to a 100 kg concrete block, which rested on a 0.5 m layer of dry sand on a concrete floor poured on solid rock. Disturbances from airborne sounds were reduced by building a separate sound-insulated room around the apparatus. This room also kept out all light, and the tests were performed with the fish in total darkness.
behaviour of the chamber and the possibility of lateral-line stimulation. At an acceleration of 10~3 m s~2 pressure changes of 0.01 Pa rms could be detected at the centre of the chamber, increasing to approximately 0.3 Pa rms at 0.1 ms~2. At the end walls the pressure increased linearly with the acceleration of the chamber, reaching values of 0.11 Pa rms at 10~3ms~2 and approximately 10 Pa rms at 0.1ms"2. At 30Hz and an acceleration of 10~3ms~2, the maximum water accelerations relative to the chamber and fish due to the compressibility of water were estimated to be approximately 10~7 m s~2 (calculations not shown). At lower frequencies, the values will be further reduced. Water movements created within the chamber due to water compressibility will therefore be well below lateral-line thresholds, which are of the order of 10~4ms~2 (Fay, 1988).
Recording and stimulation
Heart rate was continuously monitored throughout the experiments by cardiac electrodes attached to the plaice during light MS-222 anaesthesia. The test fish was then allowed to recover for at least 12h before testing began. During this period the plaice occasionally struggled vigorously for a few seconds in an attempt to escape. However, during most of the adaptation period it rested quietly on the chamber floor.
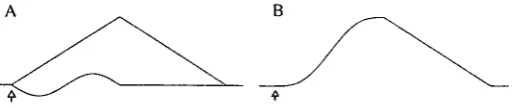
At the lowest infrasound frequencies examined, i.e. 0.1 Hz and 0.3 Hz, the spring forces of the experimental arrangement dominated. The displacement of the chamber therefore closely followed the voltage waveform supplied to the vibrator. At these two low frequencies a driving voltage was generated according to the equation:
U = aoDt — asincjt, (1)
[image:5.595.172.430.575.629.2]where U is the driving voltage, a is the amplitude of the sine voltage, co is the angular frequency and / is time. The waveform was produced by adding a positive ramp voltage with the shape acot to a negative starting sine-wave voltage with the shape as'inwt, as illustrated in Fig. 2. The stimulus duration was 10s in all trials and thus covered one period at 0.1 Hz and three periods at 0.3 Hz. The waveform gave
a transient-free sine wave acceleration starting at zero and described by U"(t). The acceleration was symmetrical around the zero line, although there was a d.c. shift in both the displacement and the velocity of the chamber during a stimulus cycle. The calculated Fourier spectrum of the acceleration stimulus contained higher-order frequency components of decreasing amplitude. At 0.1 Hz stimulation, the components one octave in either direction were reduced in amplitude by 22 dB, while for 0.3 Hz stimulation the reduction was 28dB. In previous infrasound studies using an acoustic tube, the acceleration of the fish rose instantly to its maximum value following a cosine function. The corresponding higher-order frequency components were then reduced by 10dB and 16dB, respectively. The stimulus waveform given by equation 1 thus represents a better approximation of a single-frequency stimulus. Above 0.3 Hz the stimulus waveform was a pure sine wave. To eliminate contamination by higher-order frequency components and on-transients at these frequencies, the rise time of the stimulus covered several cycles.
Conditioning
The sensitivity to low-frequency vibrations was determined by means of the cardiac conditioning technique described by Sand and Karlsen (1986) and Karlsen (1992). In short, the test fish was exposed to a sound stimulus lasting 10-15 s, which was immediately followed by a mild electric shock to the tail region, (Fig. 1C). The sizes of the test chamber and plaice were chosen to prevent the plaice from turning around within the chamber, and the shocks were delivered to the tail. At all frequencies, testing began at a high stimulus intensity of approximately 0.01 m s~2. All plaice were responsive to this intensity and showed a dramatic slowing of the heart rate even the first time the sound stimulus was presented. The main effect of the shock was therefore probably to prevent habituation of this bradycardia response. The auditory thresholds were sub-sequently determined by reducing the stimulus intensity in 6dB and 3dB steps according to the staircase technique. The response was considered positive if the heart-beat interval during the sound stimulus exceeded the longest of the 20 prestimulus heart-beat intervals by at least 10%. The time between tests was 10-30 min, and the ultimate threshold level was calculated as the stimulus intensity giving a 50% probability of a positive response (Dixon, 1965).
Background noise
The horizontal and vertical background accelerations of the experimental apparatus were measured using a portable Bruel & Kjaer vibration meter (type 2511). The frequency range was 0.3 Hz to 2 kHz, and the relative bandwidth options were 3 % and 23 %, respectively. The detection limit of the instrument was 10~7-10-6ms-2.
Results
was then regular at an elevated rate of 60-80 beats min"1. During the following 3-6 h it slowly fell to a resting rate of 20-30 beats min"1. Except during occasional brief periods of swimming activity, the heart rate remained at this level until testing began. The heart-beat intervals were also regular and typically remained within 10 % of the mean interval for periods lasting several minutes. The effect of the infrasound stimulation and the following electric shock on the heart rate depended on the interval between the tests. Forced stimulation with only a few minutes between each test inevitably led to an increased heart rate, irregular heart beats and reduced bradycardia responses. In contrast, the relaxed stimulation schedule used, with 10-30min between the tests, had only minor effects on the regularity of the heart beats and the mean heart rate.
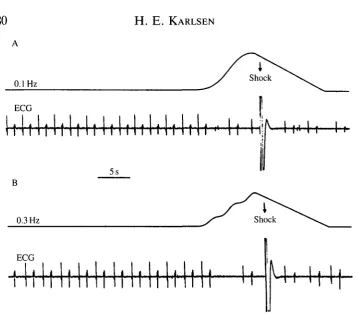
Six plaice were used in the study, and they all showed the same general behaviour both prior to and during testing. All individuals responded with a pronounced bradycardia throughout the testing period to all the infrasound frequencies above threshold. The observed bradycardia responses were also seemingly independent of stimulus strength above threshold, which made it easy to judge a test as positive or negative. An example of a positive response to 0.1 Hz and 0.3 Hz is shown in Fig. 3. The stimulation intensity was approximately 6dB above threshold in both cases. The upper trace in the records is the unfiltered output from the linear velocity differential transducer, which shows the displace-ment of the chamber and fish. The proper inner ear stimulus is the double derivative of this curve, i.e. the acceleration, which is a normal sine wave with no offset.
0.1 Hz
ECG
11 rli It It It It Mf It If Mi
5s
0.3 Hz
EC
^
[image:8.595.121.478.105.421.2]I
1Fig. 3. Responses of a plaice to 0.1 Hz (A) and 0.3 Hz (B) stimulation. The top traces in the two records show the output from the linear velocity differential transducer, i.e. the displacement of the chamber and the fish. The double derivative of this record, i.e. the acceleration of the fish, describes a normal sine wave (see Fig. 2 and the text for further details). The stimulus intensity was approximately 6 dB above threshold in both examples. The bottom traces in the records show the individual heart beats.
Above 0.3 Hz the frequency spectrum of the horizontal chamber accelerations
was also measured during stimulation to test for the presence of higher-order frequency components. However, no additional acceleration peaks above the background noise were detected for the frequencies used, even at high stimulation intensities.
Discussion
io~2
-o
n-3-io-4
-io-5
[image:9.595.137.439.136.379.2]-0.1 0.3 I 3 10 30 100 300 1000 Stimulus frequency (Hz)
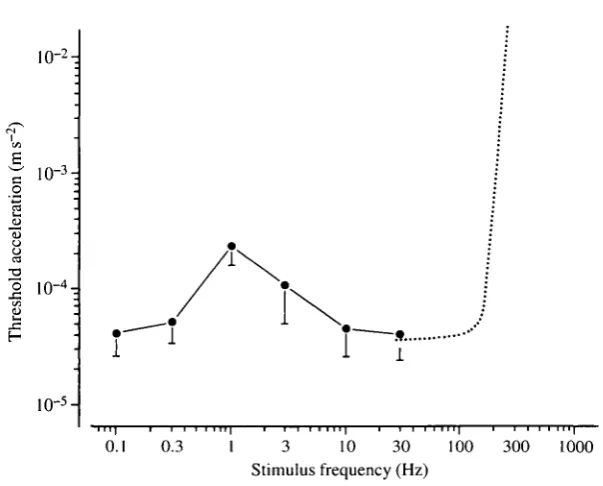
Fig. 4. Auditory thresholds obtained in plaice for the frequency range 0.1-30 Hz, presented as mean values+s.D. Six plaice were examined and they all gave well-defined thresholds at the frequencies tested. The dotted curve gives the acceleration thresholds found in plaice by Chapman and Sand (1974).
chamber and the test fish during stimulation simulated the kinetic component of a propagated sound wave, i.e. the gross water movements experienced by a fish moving freely in a sound field at some distance from the sound source. An advantage of this stimulation technique compared to the acoustic tube used previously (Sand and Karlsen, 1986) was the possibility of producing large low-frequency accelerations without creating significant relative displacements be-tween the side walls and the water. Such displacements could otherwise be above the threshold for mechanoreceptors in the skin, such as superficial neuromasts. Since border-zone effects were disregarded in the present study, the test fish was not confined to a netting cage as in previous studies (Sand and Karlsen, 1986; Karlsen, 1992), but left free to move within the chamber during testing.
apparatus, were also observed in the infrasound studies using the acoustic tube (Sand and Karlsen, 1986; Karlsen, 1992).
The relative water movements created within the chamber due to water compressibility alone were estimated to be well below the threshold of lateral-line organs. However, these receptors or other mechanoreceptors in the skin may also have been stimulated by water flows in the chamber due to pressure release through the water outlet and inlet or to changes in the circulating water flow during stimulation. These effects are difficult to estimate, but temporary closing of the water outlet and inlet using the stop screws did not affect the infrasound responses. Significant water movements may also have been created by deformations of the side walls, indicated by the pressure variations measured at the centre of the chamber. These water movements are, however, expected to be well below the overall horizontal accelerations of the chamber and test fish. At low stimulation intensities at least, the mass-loaded sensory organs of the inner ear are therefore probably responsible for the infrasound responses and thresholds observed in the plaice. This conclusion is in agreement with a previous study on infrasound detection in perch, using the standing-wave acoustic tube. Blocking the lateral-line organs with Co2 + had no effect on the infrasound thresholds in this species (Karlsen, 1992). Furthermore, saccular microphonic potentials have been measured at frequencies down to 10 Hz in plaice by Hawkins and MacLennan (1976).
The otolith organs are inertial detectors activated by linear accelerations of the whole animal. Functionally, they have been treated as simple harmonic oscillators (de Vries, 1950; Lewis, 1984; Kalmijn, 1989) described by the differential equation (de Vries, 1950; Kalmijn, 1989):
" + dx' + kx = moa{\ — l/po)sinatf, (2)
where x is the displacement of the otolith relative to the sensory macula, me is the
effective mass of the otolith and the entrained endolymph, d is the viscous drag force incurred by the moving mass, k is the restoring spring force per unit of displacement, mo is the mass of the otolith, po is the specific gravity of the otolith
extensively documented in vertebrates (see Ashmore, 1990, 1991) as have nonlinear spike-type hair cells (Fuchs etal. 1988). However, the harmonic oscillator model is considered to be a valuable first approximation of the behaviour of otolith organs (Lewis, 1984; Kalmijn, 1989). Direct measurements of the dynamic characteristics of fish otolith organs are few, but the scanty data that exist suggest that they are nearly critically damped, with natural frequencies of the order of 160Hz (see Kalmijn, 1989). This agrees with the plaice audiogram shown in Fig. 4, which fits that of a slightly underdamped system with a natural frequency of approximately 100 Hz. A low-pass characteristic of the sacculus in plaice with a cut-off frequency at 100 Hz is also apparent when the microphonic data from Hawkins and MacLennan (1976) are replotted in terms of particle acceleration.
At frequencies below resonance, otolith organs are expected to be stiffness-controlled and to operate in acceleration mode, i.e. for a given acceleration of the fish the amplitude of the otolith displacement relative to the sensory epithelium is constant and frequency-independent. This suggests a constant acceleration-sensitivity in fish for frequencies ranging from the natural frequency of their otolith organs to d.c. The acceleration thresholds determined in plaice for 0.1 Hz and 0.3 Hz may therefore hold for even lower frequencies.
The differential equation used to describe the otolith behaviour may also be used to estimate the minimum perceptible acceleration (de Vries, 1950). In the infrasound range the solution to equation 2 takes the form:
x ~ moa/nK{\ - l/po) , (3)
where x, mo, po and a are as described above. The sliding stiffness of the otolith
and otolith membrane is assumed to be determined by the hair cells only, where n is the number of hair cells and K is the average stiffness per hair cell. Otoliths have a specific gravity (po) of 2.93 (de Vries, 1950). The displacement threshold (x) of
hair cells in fish is approximately 10~9 m (Kroese and van Netten, 1989), which is close to the sensitivity of other vertebrate hair cells (see Ashmore, 1990). The pivotal stiffness of hair cells also seems to be within the same order of magnitude in vertebrates. Based on data from ruff (Acerina cernua) lateral-line hair cells, which have 15 ^m hair bundles, the stiffness per hair cell (K) has been estimated as 1.3xlO~4Nm~' (van Netten and Kroese, 1989). The relative importance of the three pairs of otolith organs in infrasound detection is unknown, but the sacculus in the plaice is large and believed to be involved in both sound and gravity reception (Shone, 1964; Chapman and Sand, 1974; Hawkins and MacLennan, 1976). The mass (mo) of the sacculus otolith in the plaice used in the experiments
may not hold when a dense otolith is embedded in the jelly-like otolith membrane as in the inner ear. However, there is no striking mismatch between the estimated and measured thresholds, and this suggests that the harmonic oscillator model of otolith behaviour should be explored further.
The mechanisms responsible for the observed infrasound sensitivity at the level of the hair cells are unclear. In the goldfish sacculus, Sugihara and Furukawa (1989) reported the presence of spike-type hair cells. These cells were slowly adapting, and small (5pA) depolarizing currents elicited large-amplitude (50-90 mV) all-or-none spikes followed by steady or 5-15 Hz repetitively oscillat-ing plateau potentials. As noted by these authors, the spike-type hair cells seem to be well suited for the detection of low-frequency mechanical stimulation. Similar spike-type hair cells have been found in other sensory structures believed to be involved in the detection of very low frequency vibrations, e.g. in the bullfrog sacculus (Hudspeth and Corey, 1977), the apex of the alligator and avian cochleas (Evans and Fuchs, 1987; Fuchs etal. 1988) and in the squid statocyst macula (Williamson, 1990).
The interpretation of the hearing capabilities of a fish depends on what is thought to be the relevant inner ear stimulus parameter. For instance, Chapman and Sand (1974) presented their audiogram for plaice in terms of particle displacement. This indicated a maximum sensitivity for frequencies in the range 110-160 Hz. Below this optimal range the sensitivity dropped by 10 dB per octave. Above, the fall-off was even steeper, which led to the conclusion that the audible frequency range in plaice appeared to be narrow. If the acceleration rather than the displacement of the animal is assumed to be the relevant auditory stimulus, the shape of the audiogram is changed dramatically, as illustrated in Fig. 4. This also makes it necessary to reconsider the conclusions concerning best frequencies and audible range.
2.5 km, and it will take more than 1 h until the plaice is 45° off its original straight course. Inertial navigation based on the acute acceleration-sensitivity of the inner ear could thus enable fish to maintain a relatively straight course for many hours, provided that the course could be corrected at certain intervals by reference to external cues. These directional cues could be bottom sand waves or water movements associated with surface waves, as suggested by Harden Jones (1984).
A moving fish is a major sound source and produces mainly low-frequency water movements (Bleckmann etal. 1991). A high sensitivity to infrasound may therefore also be important for communication or in the detection of other fish. In this respect, it is interesting that cephalopods, the invertebrate counterparts of fishes, are also primarily sensitive to low-frequency sounds well into the infra-sound range (Packard etal. 1990).
This work was supported by grants from the Nansen Foundation and The Norwegian Council for Science and the Humanities (to Dr O. Sand). I thank O. Sand, P. S. Enger and G. Sornes for their critical comments on the manuscript. I am also indebted to A. F. Bertelsen (Institute of Mathematics, University of Oslo) for modelling the behaviour of the chamber and water during accelerations and to the Technical Workshop at the Institute of Biology for building essential parts of the experimental apparatus.
References
ASHMORE, J. F. (1990). Mechanoreception. In Sensory Transduction (ed. A. Borsellino, L. Cervetto and V. Torre), pp. 25-50. New York: Plenum Press.
ASHMORE, J. F. (1991). The electrophysiology of hair cells. A. Rev. Physiol. 53, 465-476. BLAXTER, J. H. S. AND FUIMAN, L. A. (1990). The role of the sensory system of herring larvae in
evading predatory fishes. J. mar. biol. Ass. U.K. 70, 413-428.
BLECKMANN, H., BRRITHAUFI", T., BLICKHAN, R. AND TAUTZ, J. (1991). The time course and frequency content of hydrodynamic events caused by moving fish, frogs and crustaceans.
J. comp. Physiol A 168, 749-757.
BuiCKMANN, H., TITTEL, G. AND BLUBAUM-GRONAU, E. (1989). The lateral line system of surface feeding fish: anatomy, physiology and behaviour. In The Mechanosensory Lateral
Line (ed. S. Coombs, P. Gorner and H. Miinz), pp. 501-526. New York: Springer Verlag.
CHAPMAN, C. J. AND SAND, O. (1974). Field studies of hearing in two species of flatfish
Pleuronectes platessa (L.) and Limanda limanda (L.) (Family Pleuronectidae). Comp. Biochem. Physiol. 47A, 371-385.
DENTON, E. J. AND GRAY, J. A. B. (1983). Mechanical factors in the excitation of clupeid lateral lines. Proc. R. Soc. Lond. B 218, 1-26.
DENTON, E. J. AND GRAY, J. A. B. (1988). Mechanical factors in the excitation of lateral lines of fishes. In Sensory Biology of Aquatic Animals (ed. J. Atema, R. R. Fay, A. N. Popper and W. N. Tavolga), pp. 595-617. New York: Springer Verlag.
DENTON, E. J. AND GRAY, J. A. B. (1989). Some observations on the forces acting on neuromasts in fish lateral line canals. In The Mechanosensory Lateral Line (ed. S. Coombs, P. Gorner and H. Miinz), pp. 229-246. New York: Springer Verlag.
DE VRIES, H. L. (1950). The mechanics of labyrinth otoliths. Acta oto-laryngol. 38, 262-273. DIXON, W. J. (1965). The up-and-down method for small samples. J. Am. statist. Ass. 60,
967-978.
ENGER, P. S., HAWKINS, A. D . , SAND, O. AND CHAPMAN, C. J. (1973). Directional sensitivity of saccular microphonic potentials in the haddock. J. exp. Biol. 59, 425-433.
ENGER, P. S., KALMUN, A. J. AND SAND, O. (1989). Behavioural investigations on the functions of the lateral line and inner ear in predation. In The Mechanosensory Lateral Line (ed. S. Coombs, P. Gorner and H. Miinz), pp. 575-587. New York: Springer Verlag.
EVANS, M. G. AND FUCHS, P. A. (1987). Tetrodotoxin-sensitive, voltage-dependent sodium currents in hair cells from the alligator cochlea. Biophys. J. 52, 649-652.
FAY, R. R. (1988). Hearing in Vertebrates, a Psychophysics Databook. Massachusetts: Heffernan Press.
FUCHS, P. A., NAGAI, T. AND EVANS, M. G. (1988). Electrical tuning in hair cells isolated from the chick cochlea. J. Neurosci. 8, 2460-2467.
GORNER, P. AND MOHR, C. (1989). Stimulus localization in Xenopus: Role of directional sensitivity of the lateral line stitches. In The Mechanosensory Lateral Line (ed. S. Coombs, P. Gorner and H. Miinz), pp. 543-560. New York: Springer Verlag.
HARDEN JONES, F. R. (1984). Could fish use inertial clues when on migration? In Mechanisms of
Migration in Fishes (ed. J. D. McCleave, G. P. Arnold, J. J. Dodson and W. H. Neill), pp.
67-78. New York: Plenum Press.
HASSAN, E. S. (1989). Hydrodynamic imaging of the surroundings by the lateral line of the blind cave fish Anoptichthys jordani. In The Mechanosensory Lateral Line (ed. S. Coombs, P. Gorner and H. Miinz), pp. 217-227. New York: Springer Verlag.
HAWKINS, A. D. AND MACLENNAN, D . N. (1976). An acoustic tank for hearing studies on fish. In
Sound Reception in Fish (ed. A. Schuijf and A. D. Hawkins), pp. 149-169. Amsterdam:
Elsevier.
HUDSPETH, A. J. (1989). How the ear's works work. Nature 341, 397-404.
HUDSPETH, A. J. AND COREY, D. P. (1977). Sensitivity, polarity, and conductance change in the response of vertebrate hair cells to controlled mechanical stimuli. Proc. natn. Acad. Sci.
U.S.A. 74, 2407-2411.
KALMUN, A. J. (1988). Hydrodynamic and acoustic field detection. In Sensory Biology of
Aquatic Animals (ed. J. Atema, R. R. Fay, A. N. Popper and W. M. Tavolga), pp. 83-130.
New York: Springer Verlag.
KALMUN, A. J. (1989). Functional evolution of lateral line and inner ear sensory systems. In The
Mechanosensory Lateral Line (ed. S. Coombs, P. Gorner and H. Miinz), pp. 187-215. New
York: Springer Verlag.
KARLSEN, H. E. (1992). The inner ear is responsible for detection of infrasound in the perch
(Perca fluviatilis). J. exp. Biol. (in press).
KARLSEN, H. E. AND SAND, O. (1987). Selective and reversible blocking of the lateral line in freshwater fish. J. exp. Biol. 133, 249-262.
KROESE, A. B. A. AND SCHELLART, N. A. M. (1987). Evidence for velocity- and acceleration-sensitive units in the trunk lateral line of the trout. J. Physiol., Lond. 394, 13P.
KROESE, A. B. A. AND VAN NETTEN, S. M. (1989). Sensory transduction in lateral line hair cells. In The Mechanosensory Lateral Line (ed. S. Coombs, P. Gorner and H. Miinz), pp. 265-284. New York: Springer Verlag.
LEWIS, E. R. (1984). Inertial motion sensors. In Comparative Physiology of Sensory Systems (ed. L. Bolis, R. D. Keynes and S. H. P. Maddrell), pp. 587-610. Cambridge: Cambridge University Press.
MONTGOMERY, J. C. (1989). Lateral line detection of planktonic prey. In The Mechanosensory
Lateral Line (ed. S. Coombs, P. Gorner and H. Miinz), pp. 561-574. New York: Springer
Verlag.
OHMORI, H. (1987). Gating properties of the mechano-electrical transducer channel in dissociated vestibular hair cell of the chick. J. Physiol., Lond. 387, 589-609.
PACKARD, A., KARLSEN, H. E. AND SAND, O. (1990). Low frequency hearing in cephalopods.
J. comp. Physiol. A 166, 501-505.
SAND, O. (1981). The lateral line and sound reception. In Hearing and Sound Communication in
Fishes (ed. W. N. Tavolga, A. N. Popper and R. R. Fay), pp. 459-480. New York: Springer
Verlag.
L. Bolis, R. D. Keynes and S. H. P. Maddrell), pp. 3-32. Cambridge: Cambridge University Press.
SAND, O. AND ENGER, P. S. (1973). Function of the swimbladder in fish hearing. In Basic
Mechanisms in Hearing (ed. A. R. M0ller), pp. 893-910. New York: Academic Press.
SAND, O. AND KARLSEN, H. E. (1986). Detection of infrasound by the Atlantic cod. J. exp. Biol. 125,197-204.
SHONE, H. (1964). Uber die Arbeitsweisen der Statolithen-apparate bei Plattfischen. Biol.
Jahresh. 4, 135-156.
SUGIHARA, I. AND FURUKAWA, T. (1989). Morphological and functional aspects of two different types of hair cells in the goldfish sacculus. J. Neurophysiol. 62, 1330-1343.
VAN NETTEN, S. M. AND KROESE, A. B. A. (1987). Laser interferometric measurements on the dynamic behaviour of the cupula in the fish lateral line. Hearing Res. 29, 55-61.
VAN NETTEN, S. M. AND KROESE, A. B. A. (1989). Dynamic behavior and micromechanical properties of the cupula. In The Mechanosensory Lateral Line (ed. S. Coombs, P. Gorner and H. Miinz), pp. 247-263. New York: Springer Verlag.
WEISSERT, R. AND VON CAMPENHAUSEN, C. (1981). Discrimination between stationary objects by the blind cave fish Anoptichthys jordani (Characidae). J. comp. Physiol. A 143, 375-381. WILLIAMSON, R. (1990). The responses of primary and secondary hair cells in the squid statocyst