MR Changes in Transverse Myelitis
We read with interest the paper by Choi et al in a recent issue ofAJNR(1). In this paper a hyperintense lesion on a T2-weighted magnetic resonance (MR) sequence extend-ing over 3 to 4 vertebral segments occupyextend-ing the central two thirds of the spinal cord with a dot in its center is described as a characteristic MR finding in idiopathic transverse myelitis. The MR changes in transverse myelitis depend on the underlying pathology, which includes edema, demyelination, necrosis, hemorrhage, and myelo-malacia. The changes also vary with the severity and ra-pidity of disease progression and the timing of the MR study.
The authors reported that many of their patients could not remember exactly when their illness peaked, suggest-ing a protracted course of illness. Two patients had head-ache and dizziness suggesting intracranial involvement; some patients also had a relapsing-remitting course and three did not have a sensory level.
We question whether these patients had idiopathic transverse myelitis. By definition, transverse myelitis is “acute or subacute spinal cord dysfunction characterised by paraplegia, horizontal level of sensory impairment and sphincter dysfunction in which secondary causes such as compressive lesions, tuberculosis, syphilis, arteriovenous malformation, trauma and malignant infiltrations have been excluded” (2). The absence of sensory levels in three of their patients raises doubt about the diagnosis of trans-verse myelitis. A protracted course in some and relapses and remissions in others might be consistent with the chronic progressive and relapsing-remitting types of mul-tiple sclerosis, respectively. Cranial MR should have been carried out in these patients. Headache, dizziness, acquired immunodeficiency syndrome (AIDS), and other central ner-vous system disorders should have been excluded. We re-cently treated an AIDS patient with herpes simplex virus I infection that presented as acute transverse myelitis.
Transverse myelitis commonly involves the thoracic spinal cord; in 10% of patients only the cervical spinal cord is affected (2). Choi et al have reported predominant in-volvement of the thoracic spinal cord in all but one in whom cervical cord involvement correlated with the sen-sory level. The level of MR examination in their patients was determined by the clinical deficit, which might be responsible for the restriction of the signal changes to 3 to 4 segments only. Our observations on acute transverse myelitis have revealed that the MR signal changes in the spinal cord are quite extensive in the acute stage and exceed the sensory level by at least three spinal segments. The signal changes in the cervical spinal cord were present in six of 10 patients, three with upper limb weakness and three with central motor conduction abnormalities in the upper limbs. The patients had a poor outcome if the signal changes exceeded 10 spinal segments (3).
Autopsy studies have also confirmed that the histologic changes of edema and demyelination extend 12 to 16 segments above the sensory level, although the necrotic changes are restricted to the thoracic or lumbar region (4). We feel that the discrepancy between our results and those of Choi et al are attributable to (a) restricted area of MR examination, (b) timing of the MR study, and (c) possible heterogenity of the study population. These points need to be clarified before the proposed MR changes are regarded as characteristic of idiopathic transverse myelitis.
U. K. Misra J. Kalita Department of Neurology Sanjay Gandhi Post-Graduate Institute of Medical Sciences
Lucknow, India
References
1. Choi KH, Lee KS, Chung SO, et al. Idiopathic transverse myelitis: MR characteristics.AJNR Am J Neuroradiol1996;17:1151–1160 2. Dawson DM, Potts FM. Acute nontraumatic myelopathies. In:
Woolsey RM, Young RR, eds.Neurologic Clinics: Disorders of Spinal Cord.Philadelphia, Pa: WB Saunders; 1991:551– 603
3. Misra UK, Kalita J, Kumar S. A clinical, MRI and neurophysiological study of acute transverse myelitis.J Neurol Sci1996;138:150 –156 4. Hoffman HL. Acute necrotic myelopathy.Brain1955;78:377–399
Reply
We appreciate Misra and Kalita’s raising questions about the diagnosis of idiopathic transverse myelitis in some of our patients. There is a possibility that some of our patients could turn out to have multiple sclerosis or dis-eases other than transverse myelitis if long-term follow-up is carried out. As described in our “Discussion” section, Altrocchi (1) found that only four of 67 patients with acute transverse myelopathy had multiple sclerosis. Lipton and Teasdall (2) found only one patient of 34 in whom the diagnosis of multiple sclerosis could be made after 5 to 42 years of observation. The chance for one of our patients to have multiple sclerosis, AIDS, or another central nervous system disorder would be very slim. The laboratory find-ings of serum and cerebrospinal fluid were negative in all patients. All but two patients were free from signs and symptoms of intracranial and orbital lesions. MR of the brain on these two patients who had headaches and dizzi-ness was negative. Geographical variation in the incidence of multiple sclerosis and AIDS should also be taken into consideration. Our experiences with multiple sclerosis are the same as those reported by Kira et al (3) in that the Asian type, compared with the western type, is character-ized by fewer brain lesions on MR, a higher frequency of contrast-enhancing lesions on spinal cord MR, and
tive clinical involvement of both the optic nerve and the spinal cord.
In current clinical and MR follow-ups of some patients listed in our paper, steady improvement has been the rule in all but two patients who had temporary clinical progres-sion and recovered afterwards. Three patients with absent sensory level might be in subclinical or recovery stage or have partial or incomplete form of transverse myelitis at the time of examination. When we estimated the segmen-tal extent of involvement, we considered only hyperinten-sity on axial and sagittal T2-weighted images occupying more than two thirds of the cross-sectional area of the cord, excluding the central high signal intensity that was, in some cases, seen above and below the diffuse high signal intensity. If the central high signal intensity had been included, the segmental extent should have been in-creased. Although our MR studies were centered at the level of sensory deficit, studies were extended until we felt the hyperintensity was sufficiently covered. Regarding the timing of MR, the abnormal MR signal intensity is obviously more extensive in the acute stage than in the delayed stage.
We would like to emphasize our message again that MR findings described in the paper can help to differentiate transverse myelitis from other intramedullay conditions, particularly cord tumors, so that surgical intervention or radiation can be avoided. Clinical course is also an essen-tial part of assessment in these patients.
Kyu Ho Choi Department of Radiology
Kwang Soo Lee Department of Neurology
Kangnam St Mary’s Hospital Seoul, Korea
References
1. Altrocchi PH. Acute transverse myelopathy.Arch Neurol1963;9: 111–119
2. Lipton HL, Teasdall RD. Acute transverse myelopathy in adults. Arch Neurol1973;28:252–257
3. Kira J, Kanai T, Nishimura Y, et al. Western versus Asian type of multiple sclerosis: immunogenetically and clinically distinct disor-ders.Ann Neurol1996;40:569 –574
Comment
In their article, Choi et al describe the MR characteristics of idiopathic transverse myelitis. The characteristic find-ings were a centrally located hyperintensity occupying more than two thirds of the cross-sectional area of the cord with a craniocaudal extension of three to four vertebral segments. They also found a variable degree of cord ex-pansion and focal peripheral enhancement in about half of their patients. Drs Misra and Kalita report that they have a different experience in transverse myelitis with more ex-tensive changes. Furthermore, they question the diagnosis
in the material of Choi et al, because many patients had a protracted course without a well-defined peak and some did not have a sensory level. They also suggest that some patients might have had multiple sclerosis.
I think that the different experience of Choi et al and Misra and Kalita only reflects the heterogeneity of idio-pathic transverse myelitis. The nameidiopathicindicates that the cause is unknown, and this clinical entity most certainly contains etiologic variability. We do not even know whether it is inflammatory or infectious in nature, and some cases could be caused by arterial or venous vascular occlusion. Therefore, it is not surprising that the MR findings will be variable in different groups with differ-ent selection criteria. The exclusion criteria in the material of Choi et al are quite extensive, and I do not think there could be many cases caused by multiple sclerosis, as Misra and Kalita suspect, because the clinical evaluation, including cerebrospinal fluid analysis, was unremarkable regarding multiple sclerosis. The findings on MR will cer-tainly vary with the selection criteria of the patients studied and when in the course of the disease imaging is per-formed. Therefore, we can expect a variable degree of cord swelling, edema, necrosis, and contrast enhancement. Personally, I would suggest that this condition be called transverse myelopathyinstead ofmyelitis, as long as the cause is unknown. When the cause is established it should be given a more precise diagnosis, as for example “herpes simplex transverse myelitis” in the AIDS case described by Misra and Kalita. In clinical practice, I think there are very limited differential diagnostic problems in the majority of cases, especially if repeated examinations and a good clinical history are available. The majority of intramedul-lary tumors certainly have a very different appearance and history, although there are a few cases in which tumor cannot be ruled out based on a single MR examination. Finally, the most important reason MR should be per-formed is to rule out other diseases, which need early and different treatment, such as hematoma, disk herniation, and compressive myelopathy caused by tumors.
Stig Holtåos Department of Radiology University of Lund (Sweden)
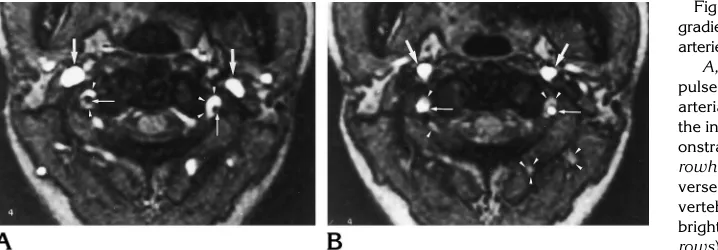
It is currently quite difficult to differentiate between flow-related enhancement and a hematoma or fat in the foramen transversarium. We believe that greater use should be made of a single transverse two-dimensional time-of-flight acquisition of the vertebral arteries and veins associating gradient-echo sequence with presaturation techniques (6) for this determination. We therefore tested the sequence on several volunteers before using it diag-nostically.
We would like to describe a test on a healthy 31-year-old woman using a General Electric Vectra 0.5-T unit. The axial gradient-echo (3,80/20 [repetition time/echo time], 50° flip angle) images, 5-mm thickness, were obtained with a head coil at the level of C1–2. The matrix was 1923 256, for a field of view of 250 mm. The acquisition time was 46 seconds for a single section. A first sequence was performed with a spatial presaturation pulse applied below the acquisition (Fig 1A) to suppress the arterial inflow signal, and the second was performed with the same pre-saturation pulse applied above the acquisition section (Fig 1B) to suppress the venous inflow signal. The venous plexus, with cephalocaudal direction of flow surrounding the vertebral artery, showed normal flow-related enhance-ment on the first sequence and no high signal on the second sequence. This method is a fast and simple way of determining vertebral vein flow in the foramen transver-sarium. The results from this example confirm that verte-bral veins can create flow-related enhancement in the fo-ramen transversarium. This anatomic MR angiographic assignment of vertebral veins is not related to the occlu-sion of vertebral arteries, as assumed in the report by Miaux et al.
Jean-Luc Dumas Ruxandra Stanescu David Goldlust Service de Radiologie Hoˆpital Avicenne Universite´ Paris XIII Bobigny, France
Pierre Brugie`res Service de Neuroradiologie Hoˆpital Henri-Mondor Universite´ Paris XII Cre´teil, France
References
1. Chong BW, Kerber CW, Buxton RB, Frank LR, Hesselink JR. Blood flow dynamics in the vertebrobasilar system: correlation of a trans-parent elastic model and MR angiography.AJNR Am J Neuroradiol 1994;15:733–745
2. Drutman J, Gyorke A, Davis WL, Turski PA. Evaluation of subcla-vian steal with two-dimensional phase-contrast and two-dimen-sional time-of-flight MR angiography. AJNR Am J Neuroradiol 1994;15:1642–1645
3. Smith AS, Bellon J. Parallel and spiral flow patterns of vertebral artery contributions to the basilar artery.AJNR Am J Neuroradiol 1995;16:1587–1591
4. James CA, Glasier CM, Angtuaco EE. Altered vertebrobasilar flow in children: angiographic, MR, and MR angiographic findings.AJNR Am J Neuroradiol1995;16:1689 –1695
5. Miaux Y, Cognard C, Martin-Duverneuil N, Weill A, Chiras J. Flow-related enhancement in the vertebral plexus mimicking an intra-mural hematoma (letter).AJNR Am J Neuroradiol1996;17:191– 192
6. Brugie`res P, Ricolfi F, Revel MP, Combes C, Gaston A. Functional exploration of brain vessels by MRI: usefulness of presaturation techniques.J Neuroradiol1993;20:239 –251
Reply
[image:3.587.52.411.84.209.2]We appreciate the opportunity to respond to the inter-esting comments of Dumas et al. Using single axial gradi-ent-echo images with saturation pulse, they nicely confirm that the vertebral plexus can create flow-related enhance-ment in the foramen transversarium at the C1–2 level in a healthy volunteer. It would have been interesting to dem-onstrate the visibility of the vertebral plexus at the level of C3– 4. In our patient with an occluded left vertebral artery, the vertebral plexus was visible in the left foramen trans-versarium at the level of C3– 4, but was not observed in the contralateral foramen transversarium. This is the reason
Fig 1. Single transverse two-dimensional gradient-echo acquisitions of the vertebral arteries and veins at the level of C1–2.
A, First acquisition with a saturation pulse placed below to suppress only the arterial signal. Bright structures represent the inflow of venous blood. This view dem-onstrates the vertebral venous plexus ( ar-rowheads) coursing through the trans-verse canal surrounding the dark signal of vertebral arteries (thin arrows). Note the brightness of the jugular veins (thick ar-rows).
we supposed that the good visibility of the vertebral plexus on the side of the occluded vertebral artery was attribut-able to dilatation of this plexus secondary to the absence of flow in the vertebral artery.
Yves Miaux Christophe Cognard Nadine Martin-Duverneuil Alain Weill Didier Savin Jacques Chiras Service de Neuroradiologie Charcot Groupe Hospitalier Pitie´-Salpeˆtrie`re Paris, France
Hippocampal Atrophy as Detected by Width
of the Temporal Horn Is Greater in Alzheimer
Dementia Than in Nondementing Cognitive
Impairment
We have previously shown that hippocampal atrophy in patients with mild Alzheimer disease can be detected with linear measures (1). With some overlap, the measure best differentiating Alzheimer patients from control subjects was the width of the temporal horn. We would like to address the issue of whether this measure is still useful in the extreme condition of differentiating Alzheimer patients with good cognition from control subjects with poor cog-nitive performance.
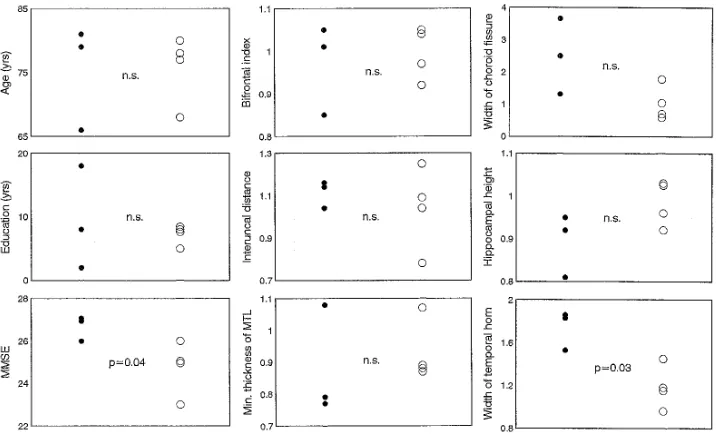
From our original sample (1) of 44 subjects with Alz-heimer disease (Mini Mental State Examination [MMSE] [2], 12 to 27) and 33 nondemented elderly controls (MMSE, 25 to 30), we selected the nonoverlapping tails of Alzheimer patients with the best cognitive performance and controls with the worst. There were three Alzheimer
patients with MMSE score of 26 and higher, and four con-trols subjects with MMSE of 26 and lower (Fig 2). The maximum score of the MMSE is 30, and in these subjects a score of 26 indicated difficulty recalling three words after a few minutes’ delay and mild disorientation to time (dif-ficulty recalling the day of the week or/and the day of the month). However, it should be stressed that none of the control subjects had derangement of daily functions (eg, the ability to shop, manage finances, use public transpor-tation), thus ruling out the presence of dementia (see NINCDS-ADRDA criteria for Alzheimer disease [3]).
Measures of regional frontal (bifrontal index), medial temporal lobe (interuncal distance, minimum thickness of the medial temporal lobe), and hippocampal (hippocam-pal height, width of the choroid fissure, width of the tem-poral horn) atrophy were taken as previously described (1) and compared in patients and controls. Figure 2 shows that Alzheimer patients and controls were not different in regard to age and education, but performance on MMSE was significantly better in the former. Of all the measures of atrophy, those tapping hippocampal atrophy were the most discriminative, and among these the width of the temporal horn was significant, with no overlap between patients and controls.
We believe that two conclusions are suggested by this study: 1) A number of nondementing (ie, nonprogressive) conditions (depression, poor somatic health, low socio-economic background, etc) are associated with cognitive impairment (poor performance on neuropsychological testing) (4). These data show that dementing but not non-dementing cognitive impairment is associated with pocampal atrophy, suggesting that measures of hip-pocampal atrophy might be useful tools for the prognosis of cognitive impairment. 2) The view is corroborated that the width of the temporal horn is the measure of
hip-Fig 2. Characteristics of three patients with Alzheimer disease with good performance and four control subjects with poor perfor-mance on neuropsychological testing. Measures of atrophy are expressed as multiple of the me-dian, computed by regressing the rough value (in millimeters) of the width of the temporal horn on age and cranial width (1). The result-ing value is an age- and cranial width–adjusted measure of atro-phy. Shown are the right or left measurements indicating greater atrophy. Statistics are done with the nonparametric Mann-Whitney U test. Significance is set atP,
.05.n.s.indicates not significant;
[image:4.587.189.547.493.710.2]pocampal atrophy most discriminative also in very early Alzheimer dementia. The potential relevance of these find-ings and the small sample used in this study indicate the need to confirm this with larger samples.
Giovanni B Frisoni Alzheimer’s Disease Unit Ospedale S. Cuore FBF and Geriatric Research Group Brescia, Italy
Alberto Beltramello Institute of Radiology Ospedale Borgo Roma University of Verona (Italy)
Angelo Bianchetti Marco Trabucchi Alzheimer’s Disease Unit Ospedale S. Cuore FBF and Geriatric Research Group Brescia, Italy
References
1. Frisoni CB, Beltramello A, Weiss C, Geroldi C, Bianchetti A, Tra-bucchi M. Linear measures of atrophy in mild Alzheimer disease. AJNR Am J Neuroradiol1996;17:913–923
2. Folstein M, Folstein S, McHugh P. The Mini Mental State Examina-tion.J Psychiat Res1975;12:189 –198
3. McKhann G, Drachman D, Folstein MF, Katzman R, Price D, Stad-lan EM. Clinical diagnosis of Alzheimer’s disease: report of the NINCDS-ADRDA Work Group.Neurology1984;34:939 –944 4. Cummings JL, Benson DF.Dementia: A Clinical Approach.
Bos-ton, Mass: Butterworth-Heinemann; 1992
Comment
We are concerned about Frisoni et al’s overinterpreta-tion of these interesting but very preliminary results. Sev-eral methodological shortcomings exist. First, the authors do not provide global assessment of the functional status of the subjects in this letter or in their original report, and therefore the generalizability of the data to other settings suffers. We do not know whether, in a different diagnostic center, the poorly performing healthy subjects or the well-performing Alzheimer patients would be classified as healthy, as having dementia of the Alzheimer type (DAT), or as at risk for a future DAT diagnosis. MMSE scores are generally not used for classification purposes, and the values Frisoni et al use to create the two groups are out of the usual range for both healthy and DAT patients. This calls into question the representativeness of these cases. Typically, DAT patients score less than 24 on the MMSE and nondemented subjects 24 or higher (1). Some inves-tigators have demonstrated that, for the healthy elderly, scores should be between 28 and 30 (2). Our clinic pop-ulation is highly educated, with a minimum of a high school education, and our healthy elderly subjects also fall within this tight MMSE range. Second, the very small
sam-ple size makes comparison of different brain measures impossible. Third, in the absence of longitudinal observa-tion, an unjustified claim was made about the usefulness of the temporal horn measures as a prognostic indicator.
On the positive side, we support some of the conceptual issues reflected in the work by Frisoni et al. Based on published neuropathology reports describing extensive se-nile plaques and neurofibrillary tangles in the medial tem-poral lobe of patients with early Alzheimer disease (3), we think that there might be an anatomic basis to support their conclusions regarding temporal horn enlargement in early Alzheimer disease.
Although the relationships between parenchymal vol-ume losses and temporal horn enlargement as a function of the clinical staging of Alzheimer disease remains largely unexamined, reports dating back to the computed tomog-raphy (CT) era have found the size of the temporal horn to be a reasonable discriminator of healthy elderly subjects from those with DAT (4). Consequently we examined, using MR-derived volume data, the relationship between parenchymal volume loss and temporal horn size in healthy elderly and in two cognitively impaired patient groups. We also addressed whether dilatation of the tem-poral horn has diagnostic utility in early Alzheimer disease. Using MR, we measured the gross anatomic subdivi-sions of the temporal lobe, including the temporal horn. The MR studies were performed on a 1.5-T Phillips Gy-roscan imager (Phillips International, Einhoven, Holland). Eighteen coronal T1-weighted (630/20/1 [repetition time/ echo time/excitations]) MR images (4 mm thick with a 10% gap) were then acquired along a coronal plane per-pendicular to the long axis of the temporal lobe. The field of view was 23 cm and the acquisition matrix 2563256 pixels. Using methods described in detail elsewhere (5), we determined the volume of the temporal horn, hip-pocampus, parahippocampal gyrus, fusiform gyrus, and superior, middle, and inferior temporal lobe gyri. After removing the cerebrospinal fluid, we created two paren-chymal composite measures: medial temporal lobe, com-prising hippocampus and parahippocampal gyrus, and lateral temporal lobe, comprising the fusiform gyrus and the superior, middle, and inferior temporal lobe gyri. In addition, an intracranial volume estimate was created by following the dural margin and used to control for individ-ual variability in head size.
def-icits does not meet current DAT diagnostic criteria. By definition, elderly subjects who receive GDS scores of 3 or scores of 0.5 on the Clinical Dementia Rating (7) are considered to have MCI. Prior longitudinal work in our laboratory has shown that about 75% of the MCI group decline to have DAT within 4 years (8, 9). Ninety one percent of these decline to have DAT if in addition to minimal cognitive impairment they have hippocampal at-rophy at baseline (10). There are a few longitudinal studies that also indicate that hippocampal measures predict de-clining memory performance in normal aging (11) and rapid atrophy in Alzheimer disease (12).
We found that relative to the healthy group the volume of the temporal horn was 173% and 300% larger for the MCI and DAT groups, respectively (F[2,73]5 8.6, P5 .004). Given the large individual variability in that mea-surement and controlling for multiple comparisons, the follow-up test only showed significant differences in the volume of the temporal horn between healthy subjects and those with DAT.
The first multivariate analyses were used to assess which temporal lobe subvolume reductions explained the increased volume of the temporal horn. We used backward stepwise linear regressions, where after controlling for head size, only the temporal lobe parenchymal subvol-umes that contributed significantly to the amount of vari-ance in the temporal horn volume would be retained in the model. The second multivariate analyses were used to assess the usefulness of the temporal horn volume, when contrasted with the temporal lobe parenchymal volumes, to classify subjects into their appropriate clinical groups. For this second analysis we used hierarchical logistic re-gressions, in which the order of entry of the temporal horn was varied to assess its usefulness after accounting for the different temporal lobe regional volumes (independent variables) to classify the subjects into their appropriate clinical groups (dependent variables).
In the first analyses, we found that for both nonde-mented groups (healthy and MCI), either separately or when combined, the temporal horn volume was uniquely explained by the hippocampal volume. That is, no other temporal lobe subvolume other than the hippocampus remained in the model predicting temporal horn size. How-ever, for the subjects with a diagnosis of DAT, reductions in the volumes of the hippocampus, parahippocampal gy-rus, and fusiform gyrus all significantly contributed to the increased volume of the temporal horn.
From the second analyses, we learned that the tempo-ral horn volume was of some use in separating healthy subjects from those with MCI, correctly classifying 67% of the subjects. Addition of the medial and lateral temporal lobe composites to the regression equation improved the classification to 75%. Alternatively, when the temporal horn was added after either the medial or lateral temporal lobe composites, it did not significantly add to the healthy/ MCI classification accuracy. This suggests that the tissue volumes are superior to the temporal horn volume in the diagnosis of mild cognitive impairment.
The temporal horn volume by itself correctly classified 78% of the healthy and DAT groups. However, it did not significantly add to the discrimination of these groups be-yond that provided by the lateral and medial temporal lobe composite volumes, which classified 89% of the subjects correctly. In the MCI/DAT comparison, the temporal horn was not useful, with 47% of the subjects being misclassi-fied. In this comparison, the addition of the medial tempo-ral lobe composite and the fusiform gyrus added signifi-cantly to the classification by the horn volume, raising the accuracy to 80%.
In conclusion, our cross-sectional data in nondemented subjects offers partial support for Frisoni et al’s claim that enlargement of the temporal horn is the result of reduction in the hippocampus. However, this relationship is not found in DAT. In DAT, the temporal horn size reflects more widespread parenchymal volume reductions, which in-clude the inferomedial temporal lobe (ie, hippocampus and parahippocampal and fusiform gyri). Overall, we urge the continued support for efforts to find useful neuroradio-logic measures that reflect both the neuropathology of DAT and the needs of clinicians in nonresearch settings to optimize the detection of DAT early in its course.
Antonio Convit Mony J. de Leon Department of Psychiatry New York (NY) University Medical Center and Nathan Kline Institute for Psychiatric Research Orangeburg, NY
Chaim Tarshish Susan De Santi Craig Wells Department of Psychiatry
Ajax George Department of Radiology
New York (NY) University Medical Center
L. A. Saint Louis Corinthian Diagnostic Radiology New York, NY
Henry Rusinek Department of Radiology New York (NY) University Medical Center
References
1. McKhann G, Drachman D, Folstein M, Katzman R, Price D, Stad-lan EM. Clinical diagnosis of Alzheimer’s disease: report of the NINCDS-ADRDA work group under the auspices of Department of Health & Human Services Task Force on Alzheimer’s Disease. Neurology1984;34:939 –944
2. Molloy DW, Alemayehu E, Roberts R. Reliability of a standardized mini-mental state examination compared with the traditional mini-mental state examination.Am J Psychiatry1991;148:102– 105
4. George AE, de Leon MJ, Stylopoulos LA, et al. CT diagnostic features of Alzheimer disease: importance of the choroidal/hip-pocampal fissure complex. AJNR Am J Neuroradiol1990;11: 101–107
5. Convit A, de Leon MJ, Tarshish C, et al. Specific hippocampal volume reductions in individuals at risk for Alzheimer’s disease. Neurobiol Aging(in press)
6. Reisberg B, Ferris SH, de Leon MJ, Crook T. The global deterio-ration scale for assessment of primary degenerative dementia. Am J Psychiatr1982;139:1136 –1139
7. Berg L. Clinical dementia rating (CDR).Psychopharmacol Bull 1988;24:637– 639
8. Flicker C, Ferris SH, Reisberg B. Mild cognitive impairment in the elderly: predictors of dementia.Neurology1991;41:1006 –1009 9. de Leon MJ, George AE, Stylopoulos LA, Smith G, Miller DC.
Early marker for Alzheimer’s disease: the atrophic hippocampus. Lancet1989;2:672– 673
10. de Leon MJ, Golomb J, prediction of Alzheimer disease: the atrophic hippocampal formation.AJNR Am J Neuroradiol1993; 14:897–906
11. Golomb J, Kluger A, de Leon MJ, et al. Hippocampal formation size predicts declining memory performance in normal aging. Neurology1996;47:810 – 813
12. Jobst KA, Smith AD, Szatmari M, et al. Rapidly progressing atro-phy of medial temporal lobe in Alzheimer’s disease.Lancet1994; 343:829 – 830
Generations of Guglielmi Detachable Coils
I read the article by Terada et al (1) in a recent issue of AJNRand I congratulate the Japanese colleagues for the wonderful results in treating their patients. They state that “GDCs [Guglielmi detachable coils] have two drawbacks. One is the time required for coil detachment (up to 30 minutes), and the other is the possibility of embolic debris resulting from electrolytic coil detachment.”GDCs are not yet available in Japan and therefore Jap-anese interventional neuroradiologists might not be famil-iar with the evolution of the GDC system. In late 1993, during the clinical trial of the GDC system, it was shown with MR that metallic debris did migrate from the solder junction platinum–stainless steel of the GDC. This occur-rence, together with the annoying excessive length of the detachment time, prompted me and Target Therapeutics to find a solution. In January 1994, a new junction was created that solved both problems. With these “second generation” GDCs, the detachment time decreased to an average of 2 minutes and the phenomenon of metallic debris became insignificant. These GDCs became imme-diately available to interventional neuroradiologists world-wide. In late 1995, to eliminate sporadic and rare occur-rences of detachment times longer than 2 to 3 minutes, GDCs of a third generation were created. These are the ones that are currently available to most neuroendovascu-lar centers.
Thank you for your attention.
Guido Guglielmi Department of Radiological Sciences University of California, Los Angeles School of Medicine