A Computerized Three-Dimensional Atlas of the Human Skull and
Brain
U. Tiede,1"3 M. Bomans,1"3 K. H. Hohne,1"3 A. Pommert,1•3 M. Riemer,1•3 Th. Schiemann,1•3 R. Schubert,u and W. Lierse2·3
PURPOSE: To develop an anatomic atlas of the human head based on a volume model derived from MR and CT. METHODS: Every voxel of this model was labeled by a neuroanatomist concerning its membership to a structural and/or functional region. A computer program was written that, instead of displaying precomputed images, allows the user to choose and compose arbitrary views. RESULTS: The user can subtract parts and ask for annotations just by using the mouse. Conversely, one can compose images by choosing objects from the list of anatomical constituents which is displayed on the screen. A set of dissection tools allows a "look and feel"
that comes near to a true dissection. Operations that are not possible in a real dissection, such as reassembly or filling cavities, can be performed. CONCLUSION: The authors have developed a computerized model that can be used for anatomy teaching and also as a reference for radiologists or surgeons. To replace classical atlases, the spatial resolution must be improved and speed must approach real time. Functional imaging data (position emission tomography and single photon emission CT) can be added to the system. The system is mobile and can be situated in classrooms, operating rooms, reading rooms, and libraries.
Index terms: Skull, anatomy; Brain, anatomy; Computers, software; Teaching aids
AJNR 14:551-559, May/Jun 1993
Recently, it has become possible through the methods of digital image processing and com-puter graphics to reconstruct from magnetic res-onance (MR) imaging or computed tomography (CT) the shape of anatomic objects in three di-mensions (1-5). Such reconstructions have proved to be useful in therapy (especially surgery) planning (6-8). However, widespread application is limited by a problem peculiar to three-dimen-sional image processing: unlike the situation with two-dimensional cross-sectional images, objects within a three-dimensional scene may obscure each other. Therefore, any visualization must be preceded by a segmentation step in which three-dimensional regions belonging to an organ must
Received May 28, 1992; revision requested August 18, received October 12, and accepted October 27.
1
Institute of Mathematics and Computer Science in Medicine (IMDM), Hamburg, Germany.
2
Department of Neuroanatomy, University of Hamburg, Hamburg, Germany.
3
University Hospital Eppendorf, Martinistrasse 52, 2000 Hamburg 20,
Germany. Address reprint requests to Prof. K. H. Hiihne.
AJNR 14:551-559, May/Jun 1993 0195-6108/93/1403-0551
© American Society of Neuroradiology
551
be identified. Only if this is done can they be visualized or removed. This segmentation step is the most difficult one in 3-D visualization. At present, only very few objects can be segmented automatically. The educational application of 3-D visualization techniques has been overlooked. In this case, only a limited number of specimens have to be segmented into their constituents; it is feasible for this work to be done by a person rather than by a computer. With this motivation, we have developed an interactive 3-D atlas of the human head. It is the purpose of this paper to show the usefulness of this approach both for education and clinical work.
Materials and Methods
Basic Data
The basic idea is to describe the anatomy in two levels (Fig. 1 ). The lower level is a volume data set from c ross-sectional imaging such as MR imaging and/or CT (pictorial
level). In addition to an intensity value, each volume ele -ment contains attributes describing its membership to basic
regions. There are different kinds of basic regions depe nd-ing on the feature considered, such as: structural regions
552 TIEDE
Fig. 1. Structure of the thr ee-di-mensional anatomical model. Each voxel of the basic volume bears, b e-sides a density value, an attribute d e-scribing its membership to a basic re -gion (pictorial level). Relations between the basic regions are described in the knowledge base (descriptive level).
(such as the sensorimotor cortex); and regions supplied by a given blood vessel.
The upper level is a knowledge base that contains
relations between the basic regions (descriptive level). These relations may concern: structure (eg, precentral gyrus is part of the frontal lobe); function (eg, a sensory stimulus goes through the spinothalamic tract); blood s up-ply (eg, the internal carotid artery supplies the anterior cerebral artery and the middle cerebral artery); and topol-ogy (eg, the thalamus is next to the third ventricle).
Construction of the 3-D Head Model
As a basis for the pictorial level, we use an MR image and a CT data set of a head as basic image volumes. The original cross-sectional images are interpolated to achieve an image volume with cubic voxels. This is performed by linear scaling in the direction perpendicular to the original slices. The resulting MR imaging volume contains 150 X 200 X 192 voxels with a width of 1.5 mm. The CT volume contains 240 X 222 X 246 voxels with a width of 1 mm.
The most critical step is the assignment of the anatomic knowledge to the image volume. This is done in several steps. Initially the gross constituents, such as skull, brain, and ventricular system, are segmented by an interactive segmentation program. An expert selects the appropriate regions using the intensity window control and special image processing tools (9-11 ). The subdivision of the coarse components into detailed structural regions (like the gyri) is done by the neuroanatomist using a "volume editor." For example, a gyrus would first be identified by painting its extent on the 3-D brain surface image. The gray matter (voxels below the painted surface) is included by specifying an intensity threshold. Refinements can now be made by repeating the painting procedure from different viewing angles and finally on the cross-sectional images. Although
AJNR: 14, May/June 1993
we have developed a set of special tools, this labeling step is tedious. The final step is naming the identified regions.
Once the image volume is labeled in the described way, the relations between the basic regions are entered into the descriptive level of the knowledge base. Two hundred basic structural regions have been labeled and their structural relations are stored in the knowledge base. In addition, the data base contains the paths of the major tracts and the sulci, which can be visualized as polygonal lines in 3-D space.
Exploration Tools
The tools for the exploration of the acquired head model may be divided into four groups: visualization, composition, exploration, and simulation. For visualization, computer graphics provide all effects that a painter would use to paint a 3-D scene onto a planar screen. Depth impression is produced by obscuration and by perspective parallax. Proper impression of shape is achieved by simulating light reflection from the surfaces according to surface inclination and reflectivity. In this context, highlights play an important role. To achieve all this, we use tools that we have devel-oped in previous projects ( 12). A viewer can generate arbitrary perspective views by choosing, for example, a certain viewpoint or light direction. Cutting tools are pro-vided to reveal interior structures. The user may move a plane in any position and direction (Fig. 2) in order to specify a cut. He may repeat this procedure in order to dissect the head in various sections. A particularly useful feature is selective cutting, which excludes objects from cutting. The colors are chosen arbitrarily.
AJNR: 14, May/June 1993
In the exploration mode, the visible image can be
ex-plored by pointing on a region of interest according to the
location of the cursor on the visible 3-D surfaces or cut
planes. New images can be created, for example, by col
-oring the chosen region, coloring parent regions (eg, the lobe to which a gyrus belongs), removing a chosen region,
or adding an object with a certain relation to the selected one (eg, in front).
Output of text that can be associated with the displayed
objects can also be created, such as: annotating the object,
listing the parent names, and displaying the description attached to the object.
Finally, application-oriented tools for the simulation of
medical procedures can be derived from the basic tools.
Three of them are presently available: simulation of
crani-otomy, simulation of the path of a stereotactic device, and simulation of x-ray images from computer tomographic volumes.
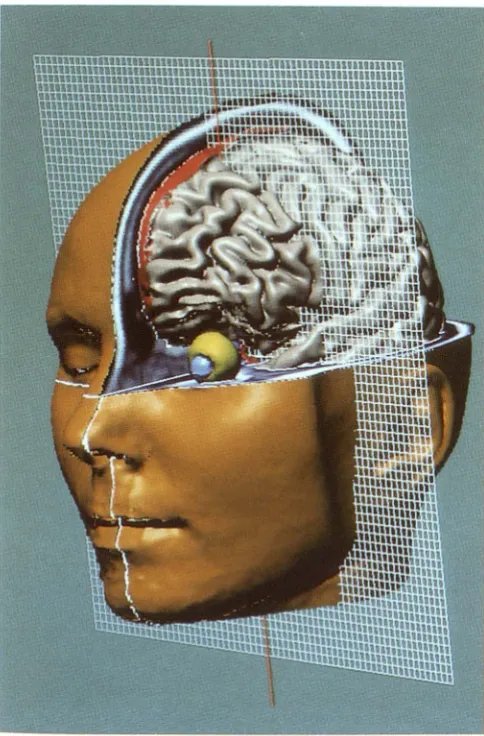
Fig. 2. Dissection of the head model at the computer screen. A wire mesh is used to define cut planes. Within the sections generated this way, objects can be removed, providing the look
and feel of an actual dissection.
COMPUTERIZED 3-D ATLAS 553
The program is implemented in the C programming
language under the UNIX (Bell Laboratories, Murray Hill, NJ) operating system using the OSF /Motif (Open Systems Foundation Inc.) standard for the user interface. With these standard tools, it is running on standard UNIX-workstations
as they are used in connection with state of the art MR and CT devices such as DECstation 5000 (Digital Equipment Corp., Maynard, MA), IBM RS/6000 (International Business
Machines Corp., Armonk, NY), and SUN SPARCstation (SUN Microsystems, Mountain View, CA). The speed of the atlas is vital for practical application. For the most fre -quently used exploration actions such as coloring or an
-notation, the reaction time is less than 1 second. For exploration actions such as rotation and cutting, it depends on the quality chosen. The small images in Figure 3 (256 X 256 image matrix) appear in about 5 seconds on a
DECstation 5000/200, a quality that is sufficient in many
instances. Development of a high quality image such as
the large one in Figure 3 (1017 X 604 image matrix) may take 10 minutes.
Results
A student could begin to explore the brain model with a skin surface image of the head. As the first step, one could simply cut into the head and explore the appearing section. However, an anatomist would prefer to remove the tissue layer by layer. This easily can be simulated by
"selec-tive cutting" as shown in Figure 2. Here cut planes have been specified and the objects "brain" and
"eye" excluded from cutting. Since the cut sur-faces exhibit the original intensity values, the scene has the appearance of an actual dissection. The crucial advantage of the computer model is that, for any visible voxel, all related
informa-tion can be queried. As seen in Figures 4, 5, and 6, the corresponding object names (such as the
name of a gyrus) can be annotated at the cursor
position, whether there are sections or multiple surfaces or both. The corresponding region can
be colored as well. Thus, questions about the
nature of the visible objects can be answered easily. The language for the annotations can be chosen (presently available: English, Latin, and
German).
Questions about the relationships between
basic regions can be answered as far as they are
described in the knowledge base. In the pilot
project, for example, the structural parents of a
basic region (eg, the lobe to which a gyrus be-longs) can be queried and colored, displayed,
[image:3.614.52.294.316.684.2]554 TIEDE AJNR: 14, May/June 1993
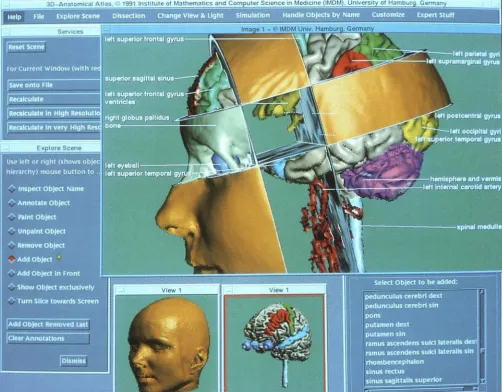
30-An:uom1cat Alias 1991 tnslltute ot Mathematics and Com uter Sc1ence in Med1c1ne (tMDM), Umversll
Fig. 3. "User interface" of the atlas. A viewer can address the exploration tools (left) via a mouse and generate annotated views with the desired direction, size, and resolution. Objects to be displayed may be selected from the knowledge base (lower right comer).
topologic knowledge might be "show all
neigh-boring objects."
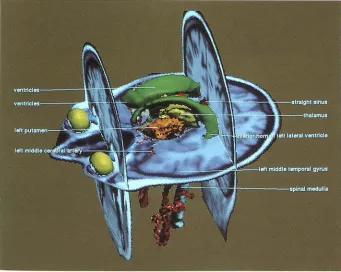
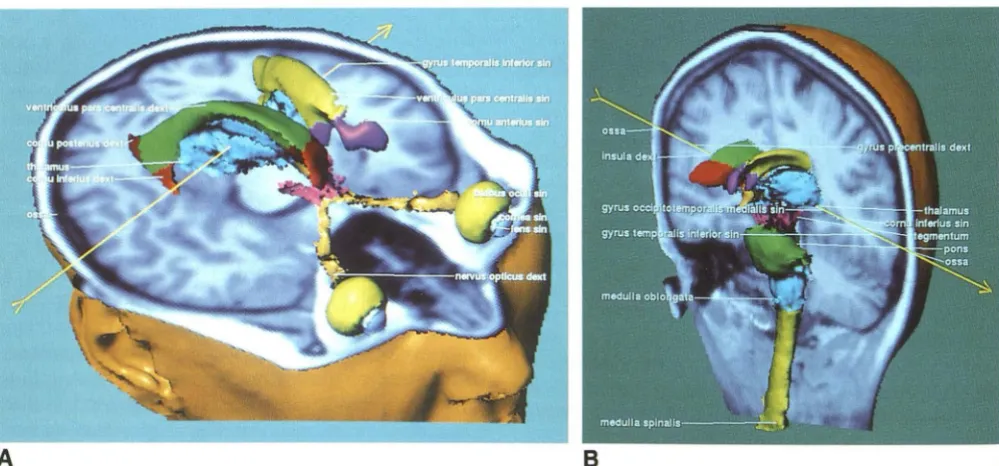
We can in the reverse case browse through a textual display of the knowledge base and select
an object or group of them that can be treated
as shown above. For example, we could ask for
the exclusive display of the thalamus and
neigh-boring objects as shown in Figure 5. In this case,
it is advisable to add the ventricular system for
orientation. Unlike in an actual dissection, we can
display it as a solid object. While in the previous
examples radiologic imagery served for teaching
basic anatomy, the same data can be used for
teaching and reference purposes in radiology
it-self. As shown in Figure 5, this can be done by presenting cross-sectional images in the context
of basic anatomy. Whether we are on a section
or an object surface, the exploration tools such
as inquiry of names can be used.
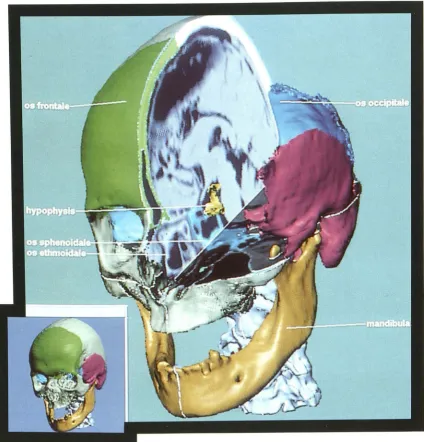
A structure that is not well represented on MR
imaging is bone. Therefore, we derive the
anat-omy of the skull from a CT data set.
Unfortu-nately, we presently do not have the data sets
from the same person. As an example for the use
of the skull model, Figure 6 shows the transnasal
access to the pituitary gland.
The previously described operations enabled us to explore freely an anatomic object in a style
comparable to dissection. Furthermore, the same
basic tools can be used for the simulation of
certain clinical procedures. We demonstrate two
[image:4.615.58.561.79.471.2]AJNR: 14, May/June 1993 COMPUTERIZED 3-D ATLAS 555
Fig. 4. Views from any direction, such as this oblique dorsolateral one, can be produced. At any instant, for every visible voxel, information such as object names with their parents in the structural hierarchy can be queried (shown in the "pop-up" window). Regions may be an-notated and/or colored by a "mouse" click.
[image:5.612.56.390.82.401.2] [image:5.612.54.395.456.728.2]556 TIEDE
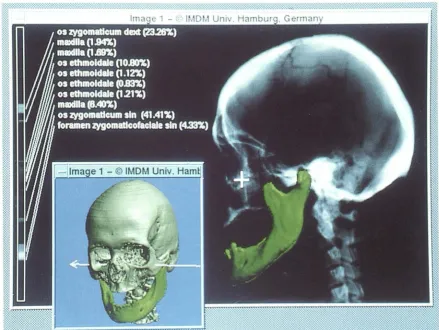
Fig. 6. View showing transnasal access to the pituitary gland.
Simulation of an X-ray Exposure and Neurosurgery Planning
A CT data volume represents the absorption values. Thus it is easy to simulate an x-ray projection from a chosen direction with any beam geometry. Since we know the objects that cause the projection image, we can determine the con-tribution of the individual objects to the final intensity at any location (Fig. 7). Thus a student can conveniently check knowledge in radiologic image interpretation.
In neurosurgery, it is vital that the access to a lesion such as a tumor is optimal in that it avoids damage to vulnerable regions (like blood vessels
AJNR: 14, May/ June 1993
or sensorimotor cortex). With the tools described, surgical operations and stereotactic interventions can be simulated in order to enhance the neces-sary surgical skills. Figure 8 shows the way a craniotomy can be simulated and the access path to a region of interest explored. As shown in Figure 9, stereotactic surgery can be simulated as well. Objects encountered using a certain needle position and direction can be identified easily.
Discussion
[image:6.614.96.521.79.521.2]de-AJNR: 14, May/June 1993 COMPUTERIZED 3-D ATLAS 557
Fig. 7. Artificial x-ray image (topogram) produced from the CT model. At the cursor position, the relative contribution of the
components to the final image can be queried. In the inserted localized view the direction of the x-ray beam is depicted. Components
(in this instance, the mandible) can be added at their proper location.
velopment of so-called hypermedia techniques in
the past decade, both pictorial and descriptive
knowledge can be organized in such a way that a learner can browse through the knowledge on a computer screen in a sequence that depends on the teaching aim and individual needs (13).
Still the underlying model is that of a book:
hypermedia screens mostly exhibit a set of pages,
in which the pictures are precomputed or digitized
image matrices. Different aspects of the same
object have to be available as different images.
By having computerized anatomical models of
the objects, different pictorial representations can
be created at the user's will. Thus it is also
possible to integrate a dissection function into a
learning program.
Computerized models of the human brain have
been used for several purposes in the past. One
purpose is the correlation of functional
informa-tion (eg, from positron emission tomography)
with detailed structural information ( eg, from MR
imaging) ( 14-16). A more academic application
of a computer model is as a knowledge base for
experiments in computer vision. Not much work
has been done in the field of model-based atlases
for medical education (17-19). The projects
de-scribed until now have in common the
represen-tation of objects as surface layers. They do not allow the "look and feel" of a dissection, which is
the main tool of exploring an anatomic object,
because the objects are hollow. Cutting thus does
not reveal realistic surfaces.
The approach presented here is based on a
complete solid volume model. Through the
link-age of descriptive information to sets of voxels,
a variety of novel applications can be generated.
Using state-of-the-art neuroradiologic imaging, it
is now possible to generate computer models that
allow dissections such as the exploration of
hu-man anatomy on a computer screen at any time
[image:7.614.83.523.77.407.2]558 TIEDE AJNR: 14, May/June 1993
Fig. 8. Simulation of craniotomy. Layers can be removed successively and information queried about the encountered objects.
A
8 [image:8.615.89.522.78.426.2] [image:8.615.57.557.470.703.2]AJNR: 14, May/June 1993
room, the operating room, the x-ray reading
room, or the library.
From the technical point of view, the volume model has proved to be a powerful data structure
for constructing 3-D anatomic models. On one
hand, this is because it is well suited to visuali-zation of both surface and volume properties of
the anatomy. It provides some of the look and
feel which come near to those of actual
dissec-tion. On the other hand, it is flexible in that it
easily allows the incorporation of extensions and more details on both the pictorial and the descrip-tive level. It must be admitted that 3-D editing of the spatial regions is a tedious task, but it need be done only once for a specimen. This can then be used in an unlimited number of copies. The
required large computing power will be a less serious obstacle in the near future. A problem
still remaining is the construction of a user
inter-face that allows the easy and natural access to
the exploration tools and the availability of
com-puter power such that any reaction of the system could be in real time.
The spatial resolution achieved with MR
im-aging is not yet sufficient for all applications.
Nonetheless, the pilot project has shown that an
approach based on a solid volume model allows
the user to choose, according to personal needs,
a virtually infinite number of realistic scenes of
the anatomy to be explored. Thus the approach
comprises the presently used atlas techniques in that it allows the generation of pictures in a form
needed for both books and hypermedia docu
-ments. Beyond atlas generation, our approach
even allows the generation of real solid models
by using stereolithography. For general use, the
data base must still be refined. For completeness,
image material such as photographic images of
cross-sections as representation for the actual
anatomy of a specimen, or positron emission
tomography for functional aspects, must be in-cluded. The described techniques are being used
for the construction of models of other parts of
the body (abdomen) and specimens (fetus). Their
inclusion is not a problem in computer science,
but a practical problem of data acquisition.
Acknowledgment
We are grateful to all members of our department who have supported this work. We thank Prof. Zeumer and Dr. Siepmann, Department of Neuroradiology, for valuable
discussions. The original MR image sequence from which
COMPUTERIZED 3-D ATLAS 559
the 3-D atlas has been generated has been kindly provided by Siemens Medical Systems (Erlangen). We are indebted to the Werner-Otto-Stiftung, Hamburg, Germany, which has supported this work in part.
References
1. Herman GT, Liu HK. Three-dimensional display of human organs
from computed tomograms. Comput Graphics Image Process
1979;9: 1-29
2. Vannier MW, Marsh JL, Warren JO. Three-dimensional computer graphics for craniofacial surgical planning and evaluation. Comput
Graphics 1983; 17:263-273
3. Hahne KH, Riemer M, Tiede U. Viewing operations for 3D- tomo-graphic gray level data. In: Lemke HU, Rhodes ML, Jaffe CC, et al, eds. Computer Assisted Radiology, Proc. CAR'87. Berlin: Sprin ger-Verlag, 1987
4. Hahne KH, DelaPaz RL, Bernstein R, et al. Combineded surface display and reformatting for the 3D-analysis of tomographic data. Invest Radio/1987;22:658-664
5. Hahne KH, Bomans M, Pfiesser B, et al. Anatomic realism comes to diagnostic imaging. Diagn Imaging 1992; 1:115-121
6. Witte G, Haltje W-J, Tiede U, et al. Die dreidimensionale Darstellung
computer-tomographischer Untersuchungen craniofacialer
Mifflbildungen. Fortschr Rontgenstr 1986; 144:400-405
7. Zonneveld FW, Lobregt S, van der Meulen JCH, et al. Thr ee-dimen-sional imaging in craniofacial surgery. World J Surg 1989;1 3:328-342
8. Fishman EK, Ney DR, Magid D. Three-dimensional imaging: clinical applications in orthopedics. In: Hahne KH, Fuchs H, Pizer SM, eds.
3D-Imaging in medicine: algorithms, systems, applications, NATO
AS/ series F. Berlin: Springer-Verlag, 1990:425-440
9. Bomans M, Hahne KH, Tiede U, et al. 3D-Segmentation of MR-images
of the head for 3D-display. IEEE Trans Med Imaging
19900-9:177-183
10. Hahne KH, Hanson WA. Interactive 3D-segmentation of MRI and CT volumes using morphological operations. J Comput Assist Tomogr 1992; 16:285-294
11. Schiemann T, Bomans M, Tiede U, Hahne KH. Interactive 3D-segmentation. In: Proc SPIE 7808: Visualization in biomedical com-puting II. Chapel Hill, NC:1992, in press
12. Tiede U, Hahne KH, Bomans M, et al. Investigation of medical 3D-rendering algorithms. IEEE Comput Graphics Appl 1990; 10:41-53 13. Jansen W, Baak JP, Smeulder A W, eta!. A computer based handbook
and atlas of pathology. Pathol Res Pract 1989; 185:652-656 14. Greitz T, Bohm C, Holte S, et al. A computerized brain atlas:
construction, anatomical content, and some applications. J Comput Tomogr 1991;15:26-38
15. Evans AC, Beil C, Marrett S, et al. Anatomical-functional correlation using an adjustable MRI-based region of interest atlas with positron
emission tomography. J Cereb Blood Flow Metab 1988;8:513-530
16. Lehmann ED, Hawkes DJ, Hill DL, Bird CF, Robinson GP, Colchester AC, Maisey MN. Computer-aided interpretation of SPECT images of the brain using an MRI-derived 3D neuro-anatomical atlas. Med lnf 1991 ;151-166
17. Mana I, Suto Y, Suzuki M, et al. Computerized three-dimensional normal atlas. Radiat Med 1990;8:50-54
18. Brinkley JF, Prothero JS, Prothero JW, et al. A framework for the design of knowledge-based systems in structural biology. In: Proc
SCAMCWashington, DC: 1989:61-65
19. Wahler-Luck M, Schutz T, Kretschmann H-J. A new anatomical representation of the human visual pathways. Graefes Arch Clin Exp
Ophtha/mo/1991;229:201-205