J. Exp. Biol. (1967), 46, 557-570 With 1 plate and 7 text-figures Printed in Great Britain
THE ABILITY OF LIMULUS TO SEE VISUAL PATTERNS*
BY CHRISTOPH VON CAMPENHAUSENfJ
California Institute of Technology
(Received 16 December 1966)
INTRODUCTION
The horseshoe crab, Limulus polyphemus, is an excellent subject for electrophysio-logical studies of a compound eye, but there are few records of behavioural responses to visual stimuli. Early observations (Loeb, 1893) indicated that the larvae of Limulus swim towards the light during a period immediately after hatching, whereas older larvae crawl away from the light. Later experiments (Northrop & Loeb, 1923) demonstrated that young Limulus, when stimulated by two lights, swim in a direction such that the light intensities at the two lateral eyes are equal. Experiments by Cole (1922) showed that young Limulus walk in circles when one eye is covered by black paint and they are transferred to bright light. Flickering light attracts young Limulus (Wolf & Zerrahn-Wolf, 1937); the attractiveness increases, with the size of the field and with the frequency of flicker. Light has been used successfully as a conditioning stimulus (Smith & Baker, i960) in experiments where adult animals received electric shocks after exposures to light. The question of whether Limulus follows or avoids the light under normal conditions has been discussed (Cole, 1923), but the problem is not yet settled. The available evidence of behavioural responses to visual stimuli appears to be very small compared with the body of knowledge relating to the physio-logical properties and the mechanism of transformation of visual information in
Limulus (review on this subject by Ratliff, 1965). It is not known whether Limulus
can discriminate between, or respond to, visual patterns. An experiment on optokinetic responses was chosen as the approach to this problem.
INITIAL OBSERVATIONS
It is not always possible to see a response when one casts a beam of light on a horse-shoe crab. The animals may lie on the bottom either in or out of the water and may fail to react in any way to the stimulus. An essential condition for any response to light seems to be that the animals are in movement, i.e. not resting, and that they are crawling on a smooth surface. It was found possible under these circumstances to obtain responses from both young and old animals by shining a patch of light on one side of them in an otherwise dark room. Some animals were always attracted, others consistently avoided the light. On another day a formerly positive phototactic animal could respond
* This research was supported by the National Institute of Health, USPH Grant Number NB 03627-03.
t Travel expenses sponsored in part by the European Office of Aerospace Research, Grant AF-EOAR 62-41.
X Present address: Institut fiir Vergleichende Tierphysiologie der Universitat, 5 Koln-Lindenthal,
negatively, and vice versa. This change of the phototactic response occurred when the animals had not been handled in between; it therefore seems unlikely that the animals move under normal conditions towards the light and avoid it only when they are disturbed (Cole, 1923). The phototactic reaction can also be demonstrated when an animal lies on its back and tries to right itself. Positively phototactic animals will roll towards the light, negative ones in the opposite direction. No reason has been found for the reversal of the phototactic response.*
Preliminary experiments showed that it is rarely possible to see a clear phototactic response when the animals are disturbed by having been handled. They then display their digging behaviour; on a soft substratum this would drive them head foremost into the sand, but on the hard floor of a tank they often fall to one side and turn over. The experiments therefore were designed to avoid handling of the animals before the test.
Attempts to elicit an optomotor response from the animals by keeping them in a circular glass dish with a vertical wall surrounded by a rotating cylinder painted inside with vertical black and white stripes failed. Animals which were restrained rigidly or loosely at the centre of the glass dish either worked hard to get free or stopped moving altogether. In rare cases they performed swimming or crawling motions for some time and turned eventually in the direction of movement of the pattern, but the results in this arrangement were erratic. When the animals were allowed to crawl around freely in the glass dish they usually moved along the vertical wall behind which the pattern was visible to them. They often changed from crawling in the direction of movement of the pattern movement to the opposite direction. The consistency of responses could not be improved by using striped patterns of a variety of stripe width and contrast, by changing the angular velocity of the drum, by varying the background light-intensity or by changing the temperature of the sea water. The movements of the tail spine gave no clue as to whether the animals were influenced by the movement of their surroundings or not.
As an outcome of these observations the different experimental apparatus was designed and is described in the next paragraph.
THE EXPERIMENTAL APPARATUS
The first observations had shown that the animals respond to light more regularly when they are allowed to crawl around freely and when they are not disturbed by having been handled previously to the test. A method was therefore developed which allowed the animals to stay in their experimental environment for several hours before the experiment started. The idea of the design can be summarized as follows. The experi-mental apparatus provided a situation in which the animals had the choice of going to the right or left. Their decision was biased by showing them a moving pattern whose direction of movement could cause an optomotor turning response, which would have an influence on their decision to take one direction rather than the other. Whether or not to participate in the experiment was left to the animals.
Ability of Limulus to see visual patterns 559
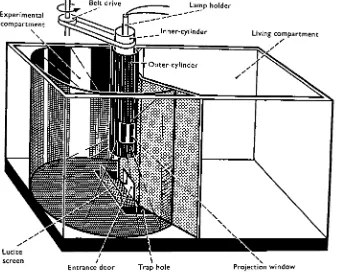
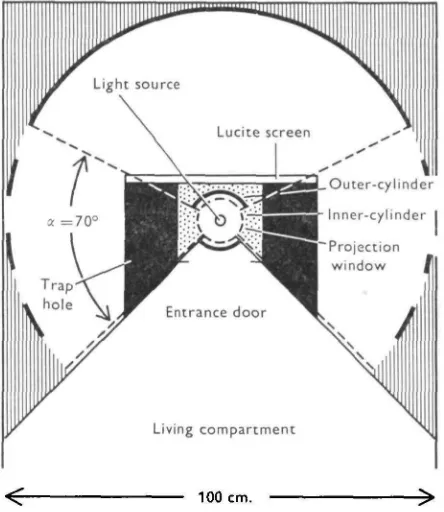
Details of the experimental apparatus are described in the legends of Figs. 1 and 2. It consisted of a large wooden tank filled with sea water which was subdivided into two compartments by an internal wall with a small door. At the beginning of the experiment all the animals were in the living compartment. They were free to enter the circular experimental compartment through the little door when the shutter was opened. Immediately after entering the experimental compartment they had to make the decision whether to go to the right or to the left, for a transparent Lucite screen prevented them from proceeding straight ahead. After having turned to the right or
Experimental compartment
\
\
Lamp holder
Living compartment
Entrance door
\
[image:3.451.60.398.181.455.2]Trap hole Projection window
left they fell into one of the trap holes, in which they stayed until they were counted and transferred back to the living compartment. When the animals entered the experi-mental compartment they could see a moving pattern which consisted of vertical light and dark stripes. The stripe pattern was projected on the circular wall by a tungsten filament lamp through a set of two Lucite cylinders in the middle of the experimental compartment. The stationary outer cylinder was transparent only at two rectangular projection windows, through which the light fell on the right and left side of the experimental compartment. The inner cylinder was rotated around its long axis by an electric motor via a belt. Stripes of black material were glued vertically to the wall
Outer-cylinder
Inner-cylinder
100 cm.
Fig. 2. Schematic plan of the experimental compartment of the tank. The diameter of the com-partment is ioocm.; the central area on which the animals can manoeuvre before they are trapped is 20 cm. in diameter, thus allowing them to move between 5 and 10 cm. to either side before they glide over the rim of the trap hole. The projection windows in the outer cylinder restrict the horizontal extension of the pattern at the wall to 700.
[image:4.451.113.335.176.432.2]Ability of Limulus to see visual patterns 561
free to crawl 5-10 cm. to either side before they slid into one of the trap holes. A solar cell which was mounted on the wall of the experimental compartment recorded the changing light intensity when the pattern was moving along the wall. Two recordings
100 -i
o
50-
2- 02-
0-\J
..m-AI/T
t
A/
jr--T
1"!
time »
Fig. 3. Record of the light intensity at the wall of the circular compartment in the experi-mental tank as the projected stripe pattern moves around. A solar cell was fastened to the wall midway between the floor and ceiling of the experimental compartment and the voltage across it was recorded. The solar cell was calibrated in situ by means of neutral density filters of known transmission. The non-linear scale of the ordinate takes account of the logarithmic character-istic of the solar cell. The graph shows recordings from the two patterns used in this paper. The pattern wavelength A is the total angle subtended by a pair of light and a dark stripes at the centre of the circular compartment. The heavy line represents the 6oc pattern, the fine line the 200 pattern. The contrast m = A7/J is about 092 for the 60° and 088 for the 200 pattern. The unevenness of the recordings in the light is due to droplets of condensed water inside the Lucite cylinders. The maximal intensity at the wall was between 50 and 60 ft. candles.
1 10°
[image:5.451.68.383.343.541.2]6 [degree]
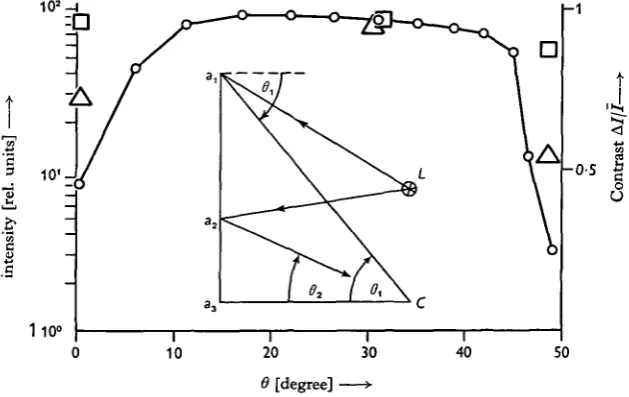
Fig. 4. Light intensity and contrast of the stimulus pattern. Inset: The intensity of the light from the lamp L in the centre of the experimental compartment was measured with a solar cell at several sites along a vertical line ax a3 at the circular wall. The wall was painted with a
white non-reflecting paint, which made it similar to a Lambert radiator. The light intensity which is reflected back from the wall to the bottom centre C of the experimental compartment, from where it is seen by the animal, is therefore proportional to the viewing angle 6 and to the intensity at the corresponding sites alt a2,...at the wall. Diagram: the relative intensity at which the
are shown in Fig. 3. The wall was painted with a white non-reflecting paint, having approximately the same characteristics as a Lambert surface, i.e. a surface that reflects incident light maximally in the direction perpendicular to the surface and in other directions proportionally to the cosine of the angle with the normal. The light in-tensity at the wall was measured at several places along a vertical line, as shown in Fig. 4. It was possible to calculate the relative intensity for any point in the pattern as it appeared to the animal. In this way it was demonstrated that the pattern appeared in approximately uniform brightness over a range of viewing angle 6 from io° to 450, as shown in Fig. 4. The contrast, A///, as defined in Fig. 3, was fairly constant within this field, as shown in Fig. 4. The experimental tank was continuously supplied with fresh sea water which kept the temperature at about 220 C. The incoming sea water caused small perturbations near the surface, as observed by watching small particles suspended in the water. This can hardly have influenced the animals, since they were at the bottom of the tank and by their own movements caused greater perturbations of the water.
EXPERIMENTAL PROCEDURES
Ninety young horseshoe crabs were sent by air express in the spring from Woods Hole, Mass, to Los Angeles. They were kept in sea-water tanks at the Kerkoff Marine Laboratory of the California Institute of Technology. The animals used in the experi-ments ranged in size from 32 to 85 mm. carapace width, the majority being between 50 and 70 mm. Only horseshoe crabs with intact eyes which showed a clear ' pseudo-pupil' (see Fig. 6, PI. 1) were employed in the tests.
The experiments were performed during the night because the animals seemed to be more active then than during the day. The median eyes were covered by a black paste, consisting of 'Vaseline' and lamp black, which stayed in the small cavity at the median eyes. In nearly half of the experiments each animal was numbered with a white figure painted on its back. At least 1 hr. before the experiment started the animals were transferred to the living compartment of the experimental tank. The light in the living compartment was adjusted so that the entrance door appeared slightly brighter because of the light filtering through from the experimental compart-ment. When the room light was turned off, so that the entrance door appeared very bright, the animals would enter so frequently that often several of them would arrive at the same time in the experimental compartment. At the chosen intensity of room light, entrance of more than one animal at a time was rare. The animals which went through the door were probably those who were positive phototactic at the time of the experiment.
Ability of Limulus to see visual patterns 563
twenty-nine different days in July and August. The total number of decisions between the right and left side which were observed in these experiments was 8441.
ANALYSIS OF THE RESULTS
The 406 experiments of this investigation consist of seventeen classes which are distinguished by different combinations of the wave length A of the moving pattern and the angular velocities w. In half of the experiments of a class the pattern moved to the left, in the other half to the right, as shown by the subscripts L and R. The numbers (s) of animals in the left trap and (d) in the right trap were recorded after each experiment and summed up for each class separately in the following way:
The numerical subscripts indicate the numbers which were given to the experiments in the records. SL is, for instance, the total number of animals counted in the left trap
in those experiments of a class in which the pattern was moving to the left. The ratio of the number of animals in the left trap to the total number of animals trapped was taken, and the difference between the ratio of the two sets of experiments, with pattern movement to the left and to the right, was calculated:
S
% = M. (a)
The difference M was used as the measure of response. It is zero when the ratios are equal, which would be expected if the pattern has no influence on the decision.
M = + 1 if all animals turn in the direction of the pattern motion, and M = — 1 if
they all turn against the direction of the pattern movement. Only small responses M were recorded in this work. Expression (2) can be algebraically transformed to the measure which was employed by Hassenstein (1951, 1958) to calculate the optomotor turning response of the weevil Chlorophanus viridis using right and left choices of this insect on the Y-maze-globe.
It turned out that the recorded optokinetic response was so weak that the significance of the data had to be checked by statistical methods. The following consideration was applied. Upon entering the experimental compartment the animals have the choice of crawling to the right or to the left and no other. The probability to be caught in the left trap is therefore given by equations (3 a) and (3 b)
(3*)
L(3*)
optokinetic response the ratios will have different values. Since the number of de-cisions is not infinite, one must expect that upon repeating the experiments several times, one would get different ratios pL and pB. The different values of pL and pR
would be scattered around a mean value pL and pB.
The description around the mean value can be described by a binomial distribution, since pL and pB depend on the numbers SL and SB which are independent decisions
between two possibilities of choice: the right- and the left-hand side.
From the theory of the binominal distribution (Hoel, 1963; Weber, 1964) one can derive the standard deviations aL and <rB of pL and pB which is for pL
where nL = SL + DL. To check whether this procedure is useful, crL and aB of the
data from the experiments with patterns of A = 200 were also calculated in a more cumbersome way taking into account the deviations of the single experiments. No significant difference was found.
Thus equation (2) can be written as follows:
(PL±<rL)-(pR±<rR) = M. (5)
The aim is now to find out whether the difference M between the two ratios in (5) is significantly different from zero. Under the conditions provided by the data (p was always close to 0-5 and n in most cases greater than 500), the binominal distribution is very similar to the normal distribution. It is therefore possible to test the confidence in the response M in equation (6) by Student's f-test, which is based on the theory of the normal distribution (Patau, 1943; Hoel, 1963). The result is a number P, which indicates the probability that the value of M arises merely by chance. The value of P is listed in Fig. 5 for each class of experiments.
THE OPTOKINETIC RESPONSE
The behaviour of the animals during the experiments was not uniform; often two-thirds of them and sometimes even more were inactive. Some turned consistently away from the light as they approached the entrance door. The following kinds of behaviour were observed when an animal entered the experimental compartment:
(1) The animal would approach the entrance door slowly and crawl through the middle of it. On the central field of the experimental compartment the animal would stop and wait, sometimes for up to 1 min. Then it would turn to one side and slide into the trap after a few steps.
(2) More often the animal would crawl along the wall and enter the circular com-partment at one side of the door. It would then almost certainly turn to the same side within the experimental compartment, maintaining contact with the wall along which it had been moving, until it fell into the trap.
(3) Sometimes it would enter the circular compartment so quickly so that there seemed to be no time for a change in direction, and it proceeded straight into the trap at one side.
compart-Ability o/Limulus to see visual patterns 565
ment before the preceding one had cleared the central field. Under these circum-stances one animal could push the other into one of the traps.
(5) It was repeatedly observed that the average number of animals trapped on one side of the tank in a consecutive series of experiments with alternating direction of pattern motion was higher than on the other; but this was not always at the same side. It could not be excluded that one side was sometimes more attractive to the animals than the other for unknown reasons, possibly some smell.
These observations show that some influences, in addition to the visual stimulus, on the right-left decision were operative in the experimental arrangement.
0-2
0-1
004
13° 1
i i 1 1 1 1 1 1 oik n P, 10 Ik n P.
0 0 3 370 0-42 0 0 9 192 0 3
0 0 9 641 0 6 2 0 2 8 446 0-89
IV
a [degree, sec. ']
0' 1(
1 1 1 1 1 1 1 1
0-5 432 0 7 2
0-28 832 001 0-83 437 0-18 1-5 433 0-36 083 959 003 2-5 523 0 0005 4-5 350 0-68 20° pattern 60° pattern K / )2 2-5 970 0-45 7-5 553 0-92
N
i i i
7-5 640 0 46 22-5 316 0-96 /
[image:9.451.72.376.192.408.2]III1 0 3 22-5 261 0-27 67-5 90 0 7
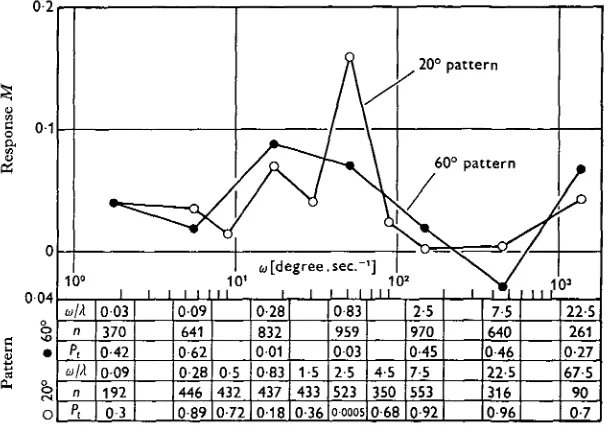
Fig. 5. Optokinetic response M versus angular velocity u> of two vertical stripe patterns. The spacial wavelengths of the patterns were A = 200 and A = 6o°. The response is defined as
where 5 and D are the numbers of animals which turned to the left and right side respectively in experiments where the patterns moved to the left or right as marked by the subscripts
L and R. The table gives for each point in the graph the probability Pt that the deviation from
zero is due to chance. Thus significant responses at the 97 % level or better occurred at angular velocities between (0 = 10 and 100 degree sec."1. The table shows also the number of choices n on which the statistical test was based and the contrast frequency <o/A (sec."1), i.e. the frequency of the light intensity change at the eye, caused by the movement of the pattern.
Systematic errors were minimized by taking the difference between the results of experiments with opposite directions of movement stimuli. Asymmetric influences on the right-left decision which were due to the experimental apparatus and not to the visual movement stimulus are thereby eliminated.
response arises by chance, based on the number n of choices, which is also listed in the table. It becomes clear from Fig. 5 that there is a range of angular velocities within which M is significantly different from zero; in other words the animals have been influenced by the visual movement stimulus. They turned more often to the side to which the stripe pattern was moving along the wall. The positive response was found for the 6o° pattern as well as for the 200 pattern at angular velocities between roughly w = 10 and 100 degrees.sec."1. Negative responses of significant amplitude were not obtained.
The contrast frequency, 0) which is a measure of the flicker frequency at the ommatidia produced by the moving stripe pattern, is below w = 0-83 sec."1 in the range in which the animals show a response to the 6o° pattern, and for the 200 pattern is above this value. The optimal contrast frequency appears to be in the region
0) = 1 sec."1. This optimal contrast frequency w is the same as the greatest frequency response of the receptor potential in the retinular cells of the lateral eyes of Limulus (Fuortes, personal communication). The same relation of the maximal behavioural and electrophysiological response has been reported for the weevil, Chlorophanus (Hassenstein, 1959; Kirschfeld, 1961), for the honey bee, Apis (Autrum & Stoecker, 1950; Kunze, 1961), and for the housefly, Musca (Fermi & Reichardt, 1963; Vowles, personal communication).
It should be noted that the reaction to the 6o° pattern was not greater than to the 200 pattern. As demonstrated in Fig. 3 the contrast m in the stripe patterns which were used was almost the same. But since the ommatidia have a finite angular field of view over which presumably the light intensity is integrated before it stimulates the sensory cells, the contrast will be reduced in the compound eye. The opening angle Ap of an ommatidium has been defined as the half width of the sensitivity distribution of the ommatidium plotted against the angle at which the light enters. Its value has been found to be approximately Ap = 10° under water (Waterman, 1954; Kirschfeld & Reichardt, 1964). It is possible to compute the loss of contrast in the eye when the opening angle Ap and the wavelength A of the pattern are known. Using the mathe-matical relation between Ap, A, and the effective contrast (Gotz, 1964), one finds that after passing through the optics of the eye the contrast of the 200 pattern is roughly five times smaller than the contrast of the 60° pattern. It is therefore astonishing that the response to both patterns is approximately the same, whereas optomotor reactions of insects have been found to be strongly dependent on contrast (Hassenstein, 1959; Kunze, 1961; Fermi & Reichardt, 1964; Gotz, 1964).
The small numbers of choices which have been obtained from single animals are not sufficient to determine individual reactions to the visual movement stimulus. It was never observed that one particular animal always went to the same side regardless of how the pattern was moving. Nor were there any animals which turned more often
Journal of Experimental Biology, Vol. 46, No. 3
Plate 1
CHRISTOPHER VON CAMPENHAUSEN
Ability o/Limulus to see visual patterns 567
in the direction of the pattern movement than other animals. It can be assumed therefore that the individual animal responded in a similar way, and as weakly, to the visual movement stimulus as the whole group.
These experiments demonstrate the existence of an optokinetic response and that the animal is capable of detecting the movement of patterns with its lateral eyes; but the response is very weak. The structure of the eye was therefore investigated to find out whether the interommatidial angles are small enough in the young animal to resolve the stripe patterns used in the experiments.
STRUCTURAL PROPERTIES OF THE LATERAL EYES
The lateral eyes of Litnulus differ from the compound eyes of most insects in the irregularity of their structure. Fig. 6 (PI. 1) shows a photograph of a lateral eye. The small animals which were used in the experiments had between 300 and 400 ommatidia
3 0
2 0
-c
•3
s
o
1 0
-1—1
1 1 1
n \
- 2 2 41 I I 10 12I
'™H I
14 16I [image:13.451.91.359.256.474.2]interommatidial angle <fi [degree]
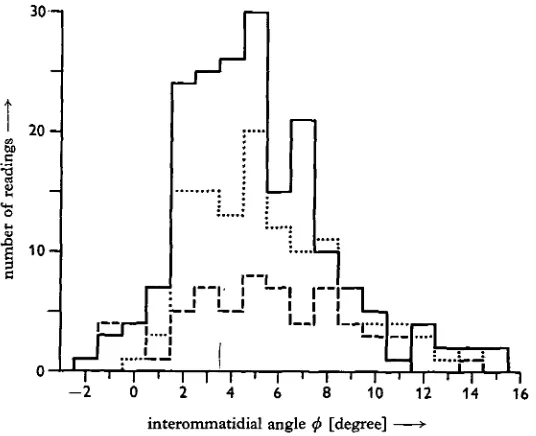
Fig. 7. Interommatidial angles in the lateral eyes of three different specimens of limulus. The carapace width of these animals was between 62 and 68 mm. Each histogram gives angles as measured in one eye. The procedure of measurement is described in the text. Corrections for under-water vision have been made.
in each lateral eye. The ommatidia are distributed in a more or less random manner over the eye; the highly ordered pattern of ommatidia in the compound eyes of insects is lacking here. The spacing, the diameter and the shape of the ommatidia vary remarkably. The same is true for the interommatidial angles as demonstrated in Fig. 7. A great variation of interommatidial angles within one eye has been reported earlier (Waterman, 1954).
antero-posterior direction. When the sections were kept in sea water they did not change in curvature; this was checked by transferring them back to the eye; no change in curva-ture was observed. The sections, which were not thicker than i-o or 1*5 ommatidial diameters, were inspected under a microscope. When two or more adjacent ommatidial cones lying in the plane of section and cut through the middle were found, or if there were neighbouring cones which were not cut at all, the section was projected and these cones were drawn on paper. The interommatidial angles were then determined graphically.
The cornea has a high refractive index, /i = 1-5 (Kirschfeld & Reichardt, 1964). The direction of propagation of the light changes therefore upon entering the cornea unless it impinges on the eye perpendicular on the corneal surface. Since the axes of most ommatidial cones do not stand perpendicular to the corneal surface, the effective interommatidial angle is not identical with the angle between the morphological axes of adjacent ommatidia. A correction of the morphological ommatidial axis was made when the angle between the morphological axis and the cornea deviated from the perpendicular by more than 2-5°. The effective interommatidial angle was then measured between the corrected ommatidial axes. This correction was based on Snell's law of refraction; since the experiments were performed under water, the refractive index for water was used in the calculation.
An estimation of the error introduced by the measuring technique can be made in the following way: (1) The cones were probably not lying accurately in the horizontal plane of the section. Deviation of 300 from the horizontal would have been clearly detectable and would have introduced an error of 14% of the effective interommatidial angle under the worst circumstances. (2) Repeated determination of the angle between the morphological axes and the corneal surface varied maximally by i°; the effective interommatidial angle would be in error by 2° in the worst case. (3) The final measure-ment of the interommatidial angle was also subject to a maximum error of i°. In the very worst case the reading of an interommatidial angle could therefore be in error by 30 and 14% of its value. The real variation of interommatidial angles is far greater.
This great variation was found in all parts of the eye. Fig. 7 shows that the angles between ommatidial cones which lie in the horizontal plane of the section vary from 15° divergence to 2° convergence, in most cases being less than io°. But there is no reason to assume that only the ommatidia in the plane of the section work together in the perception of movement. Movement may be detected by the co-operation of ommatidia which are displaced relative to one another in both the horizontal and the vertical directions. The distribution of angles between ommatidia which contribute to movement perception might therefore include the very small angles in the hori-zontal plane between neighbouring ommatidia which are displaced relative to one another in the vertical direction. The interommatidial angles A0 are therefore suf-ficiently small to enable both the 20°-pattern and the 6o°-pattern to be resolved.
Ability q^Limulus to see visual patterns 569
1951; Kunze, 1961; Gotz, 1964). In the animals which were used in this work the majority of the interommatidial angles were smaller than io°, whereas the funda-mental wavelength of the stripe pattern was twice this angle or greater. The structure of the eye thus suggests that the horseshoe crab should be able to see the stripe pattern with its lateral eyes.
DISCUSSION
Our knowledge of vision in Limulus is based almost exclusively on electrophysio-logical and morphoelectrophysio-logical evidence. Behavioural studies in several laboratories have been unsuccessful in providing any experimental method capable of supporting the current theory of vision in Limulus. Such evidence is necessary to supplement the physiological data and to establish an acceptable theory. The method used in this paper is cumbersome, but it indicates that Limulus responds to certain visual movement stimuli. However, the results obtained with this method show that in Limulus opto-kinetic responses cannot be obtained as readily as in insects. It appears possible that further investigations of this subject may not be profitable. Support for this view can be drawn from the initial observation that the dominant stimuli operative in orientation are other than visual. The ventrally located mechanical and chemical sense organs (Barber, 1956, i960; Pringle, 1956) may be sufficient for this purpose. The primary function of the lateral eye would then appear to be that of distinguishing different light intensities in the phototactic behaviour. This is probably of value to the animal in ambivalent situations as, for instance, when it has the choice of avoiding an obstacle by going to the right- or the left-hand side, or when it is lying on its back and has to decide which way to turn in order to right itself. It was noticed that in situations of this kind positive or negative phototaxis determines the decision to turn to the right or to the left. It appears possible that Limulus normally does not use its lateral eyes for higher visual functions such as the perception form or motion. On the basis of this assumption it appears doubtful whether behavioural investigations can provide data sufficiently detailed to extend the analysis of the visual system in Limulus.
SUMMARY
1. Phototactic reactions of young and adult Limulus are described.
2. A method has been developed for studying the optokinetic responses of young animals to moving patterns.
3. Evidence is presented that young animals can see the movement of patterns which consist of light and dark vertical stripes.
4. The response is weak, and visual stimuli appear to have little influence on the behaviour of Limulus. Reasons for this are discussed.
I wish to thank Dr D. Fender for discussion and my wife and Mr H. Wenzel for the drawings.
REFERENCES
AUTRUM, H. & STOECKER, M. (1950). Die Verschmelzungsfrequenz des Bienenauges. Z. Naturforsch.
5b,
38-43-BARBER, S. B. (1956). Chemoreception and proprioception in Limulus. J. exp. Zool. 131, 51-68. BARBER, S. B. (i960). Structure and properties of Limulus articular proprioceptors. J. exp. Zool. 143,
283-322.
COLE, W. H. (1922). Circus movements of Limulus and the tropism theory. J. gen. Physiol. 5, 417-26. COLE, W. H. (1923). The effect of laboratory age upon the phototrophic reactions of Limulus. J. gen.
Physiol. 6, 295^7.
FERMI, G. & REICHARDT, W. (1963). Optomotorische Reaktionen der Fliege Musca domestica.
Kyber-netik 2, 15-28.
VON GAVEL, L. (1939). Das Ma6 der Sehscharfe bei Drosophila. Z. vergl. Physiol. 27, 80-135. GOTZ, K. G. (1964). Optomotorische Untersuchung des visuellen Systems einiger Augenmutaten der
Fruchtftiege Drosophila. Kybernetik, 2, 77-92.
HASSENSTEIN, B. (1951). Ommatidienraster und afferente Bewegungsintegration (Versuche an dem Riisselkafer Chlorophanus viridis). Z. vergl. Physiol. 33, 301-26.
HASSENSTEIN, B. (1958). Die Starke von optokinetischen Reaktionen auf verschiedene Musterges-schwindigkeiten. Z. Naturf. 136, 1-6.
HASSENSTEIN, B. (1959). Optokinetische Wirksamkeit bewegter periodischer Muster (Nach Messungen am Riisselkafer Chlorophanus viridis), Z. Naturf. 14b, 659-74.
HOEL, P. G. (1963). Introduction to Mathematical Statistics. Wiley Publications in Mathematical Statistics. New York and London.
KIRSCHFELD, K. (1961). Quantitative Beziehungen zwischen Lichtreiz und monophasischem Elektro-retinogramm bei RUsselklfern, Z. vergl. Physiol. 44, 371-413.
KIRSCHFELD, K. & REICHARDT, W. (1964). Die Verarbeitung stationarer optischer Nachrichten im Komplexauge von Limulus. Kybernetik 2, 43-61.
KUNZE, P. (1961). Untersuchungen des Bewegungssehens fixiert fliegender Bienen. Z. vergl. Physiol. 44, 656-84.
LOEB, J. (1893). Ober kiinstliche Umwandlung positiv heliotropischer Tiere in negativ heliotropische und umgekehrt. Pfltig. Arch. 53, 81-107.
NORTHROP, J. H. & LOEB, J. (1922). The photochemical basis of animal heliotropism. J. gen. Physiol. S.
58i-95-PATAU, K. (1943). Zur statistischen Beurteilung von Messungsreihen. Biol. Zbl. 63, 152-68. PRINGLE, J. W. S. (1956). Proprioception in Limulus. J. exp. Biol. 33, 658-67.
RATLIFF, F. (1965). Mach Bands. San Francisco, London, Amsterdam.
SMITH, J. C. & BAKER, H. D. (i960). Conditioning in the horseshoe crab. J. comp. Physiol. Psychol. 53, 279-81.
WATERMAN, T. H. (1954). Directional sensitivity of single ommatidia in the compound eye of Limulus.
Proc. nat. Acad. Set. (Wash.) 40, 252-7.
WEBER, E. (1964). Grundifi der Biologischen Statistik, VEB Gustav Fischer, Jena.