1462
Correlation of Multiple Sclerosis Measures Derived from
T2-Weighted, T1-Weighted, Magnetization Transfer, and
Diffusion Tensor MR Imaging
Giuseppe Iannucci, Marco Rovaris, Laura Giacomotti, Giancarlo Comi, and Massimo Filippi
BACKGROUND AND PURPOSE: In multiple sclerosis (MS), the severity of tissue damage
can vary from edema and inflammation to irreversible demyelination and axonal loss.
Com-pared with conventional T2-weighted MR imaging, magnetization transfer (MT) and diffusion
tensor (DT) MR imaging provide quantitative indices with increased specificity to the most
destructive aspects of MS. To increase our understanding of the pathophysiologic processes of
MS, we assessed the correlations between MT and DT MR imaging–derived metrics and the
correlations between these quantities and measures derived from conventional MR in patients
with MS.
METHODS: T2-weighted, T1-weighted, MT, and DT MR images of the brain were obtained
from 34 patients with relapsing-remitting MS (RRMS) and 15 age-matched control subjects.
T2 and T1 lesion volumes (LV) and brain volume were measured. MT ratio (MTR), mean
diffusivity (D
¯ ), and fractional anisotropy (FA) histograms from the overall brain tissue (BT)
and the normal-appearing brain tissue (NABT) were obtained. Average lesion MTR, D
¯ , and
FA were also calculated. The correlations between T2 and T1 LV, brain volume, MT-, and
DT-derived metrics were assessed with the Spearman rank correlation coefficient.
RESULTS: No significant correlations were found between MT and FA histogram–derived
metrics and quantities derived from conventional MR scans (T2 and T1 LV and brain volume).
On the contrary, T2 and T1 LV (but not brain volume) were significantly correlated with the
average D
¯ values of BT and NABT (r values ranging from 0.52 to 0.78). No significant
corre-lation was found between MT- and DT-derived metrics.
CONCLUSION: These results suggest that MT and DT MR imaging provide, at least
par-tially, independent measures of lesion burden in patients with RRMS. This suggests that a
multiparametric MR approach has the potential for increasing our ability to monitor MS
evolution.
Multiple sclerosis (MS) is an immune-mediated
disorder selectively affecting the central nervous
system. The pathologic hallmark of MS is
inflam-matory demyelination, which can be limited by
re-parative mechanisms (including remyelination) or
can become irreversible and ultimately lead to
tis-sue loss (1). In MS, the progressive accumulation
of tissue damage is likely to be one of the major
Received December 6, 2000; accepted after revision February 28, 2001.
From the Neuroimaging Research Unit (G.I., M.R., L.G., M.F.) and Clinical Trials Unit (G.C.), Department of Neuro-science, Scientific Institute and University Ospedale San Raf-faele, Milan, Italy.
Address reprint requests to Massimo Filippi, MD, Neuro-imaging Research Unit, Department of Neuroscience, Scientif-ic Institute Ospedale San Raffaele, via Olgettina 60, 20132 Milan, Italy.
qAmerican Society of Neuroradiology
MT is based on the interactions between protons
in a relatively free environment and those wherein
motion is restricted. In the brain, these two states
correspond to the protons in tissue water, and in the
macromolecules of myelin and cell membranes.
Off-resonance irradiation is applied that saturates
the magnetization of the less mobile protons and is
then transferred to the mobile protons, thus
reduc-ing the observable signal intensity. Low MT ratio
(MTR) indicates a reduced capacity of the
macro-molecules in brain tissue to exchange
magnetiza-tion with the surrounding water molecules,
reflect-ing damage to myelin or to the axonal membrane
(9). A postmortem study found a correlation
be-tween low MTR and the percentage of residual
ax-ons in MS lesiax-ons (10). Animal studies have also
shown that low MTR correlates with
histopatho-logic findings of myelin loss and axonal destruction
(11), whereas edematous lesions result in slightly
increased MTR values (12). Dramatically reduced
MTR is also seen in the ‘‘pure’’ demyelinating
le-sions of patients with progressive multifocal
leu-koencephalopathy (13) or central pontine
myeli-nolysis (14).
Diffusion is the microscopic random
translation-al motion of molecules, and water molecular
dif-fusion can be measured in vivo by use of difdif-fusion-
diffusion-weighted MR imaging (15). Because diffusion is
affected by the properties of the medium wherein
molecular motion occurs (16), the measurement of
diffusion inside biological tissues provides
infor-mation about tissue structure at a microscopic level
(17). The motion of water molecules can be
hin-dered by the presence of structural barriers at a
cel-lular or subcelcel-lular level. Pathologic processes that
alter tissue organization by decreasing or increasing
the number of barriers to water molecular motion
or that alter the permeability of the barriers cause
abnormal water diffusivity. In addition, diffusion is
inherently a three-dimensional process, and in
some tissues with an oriented microstructure, such
as brain white matter, the molecular mobility is not
the same in all directions. This property is called
anisotropy, and results in a variation in the
mea-sured diffusivity with tissue measurement direction
(18, 19). White matter fiber tracts consist of aligned
myelinated axons and, therefore, hindrance of
wa-ter diffusion is much greawa-ter across rather than
along the major axis of axonal fibers (20). Under
these conditions, a full characterization of diffusion
can only be found in terms of a tensor (21), a
3
3
3 matrix where the on-diagonal elements
rep-resent the diffusion coefficients along the axes of
the reference frame, whereas the off-diagonal
ele-ments account for the correlations between
molec-ular displacement along orthogonal directions.
From the tensor, it is possible to derive some scalar
indices, invariant to the changes in the frame of
reference, which reflect the diffusion characteristics
of the tissue. These measures include 1) the mean
diffusivity (D
¯ ) (equal to one third of the trace of
the diffusion tensor), which is a measure of the
average molecular motion independent of any
tis-sue directionality and is affected by cellular size
and integrity (22, 23); and 2) the fractional
anisot-ropy (FA), which is one of the most commonly
used measures of deviation from isotropy (22) and
reflects the degree of alignment of cellular
struc-tures within fiber tracts, as well as their structural
integrity. The pathologic elements of MS have the
potential to alter the permeability or geometry of
structural barriers to water molecular diffusion in
the brain and, consistent with this, water diffusivity
is higher and FA lower in MS lesions than in
NAWM and in white matter of healthy volunteers
(24–26).
MT and DT characteristics can be analyzed on a
region of interest (ROI) basis or on a more global
basis by using histogram analysis (8, 27–30), an
approach that allows evaluation of all the brain
tis-sue, thus providing an assessment of both
macro-scopic and micromacro-scopic disease burden in MS.
Be-cause the relative contributions of conventional,
MT, and DT MR imaging to study MS in vivo have
never been investigated, aims of this study were to
investigate the magnitude of the correlations
be-tween various MT and DT MR imaging–derived
metrics and between these quantities and measures
derived from conventional MR imaging.
Methods
Subjects
We studied 34 patients (21 female and 13 male patients) with clinically definite, relapsing-remitting MS (RRMS) (31). Their mean age was 34.8 years (SD, 7.5), the median duration of the disease was 6.5 years (range, 1–20), and the median Expanded Disability Status Scale (EDSS) score (32) was 1.5 (range, 0.0–4.5). All patients had neither relapses nor steroid treatment during the 3 months preceding study initiation. Fif-teen age-matched healthy volunteers (nine female and six male subjects) served as controls. Their mean age was 34.0 years (SD, 9.6). All subjects signed a written informed consent form prior to study entry. The study was approved by the local eth-ics committee.
Image Acquisition
Brain MR imaging was performed at 1.5 T. During a single session, the following were performed without moving the subject from the unit: 1) dual-echo turbo spin-echo imaging (3300/16–98 [TR/TE]; acquisition, 1; echo train length, 5); 2) T1-weighted conventional spin-echo imaging (768/15 [TR/ TE]; acquisitions, 2); 3) 2D gradient-echo (GE) imaging (600/ 12 [TR/TE]; acquisitions, 2; flip angle, 208), with and without an off-resonance RF saturation pulse (offset frequency, 1.5 kHz; gaussian envelope duration, 7.68 ms; flip angle, 5008); and 4) a pulsed-gradient spin-echo echo-planar pulse sequence (interecho spacing, 0.8; TE, 123), with diffusion gradients ap-plied in eight noncolinear directions, chosen in order to cover three-dimensional space uniformly. The duration and maxi-mum amplitude of the diffusion gradients were 25 ms and 21 mTm21, respectively, giving a maximum b factor in each
di-rection of 1044 s mm22. In order to optimize the measurement
of diffusion, only two b factors were used (33) (b1ø0, b25 1044 s mm22). Fat saturation was performed using a 4-RF
For the dual-echo, T1-weighted, and GE images, 24 contig-uous interleaved axial sections were acquired with a 5-mm section thickness, 2563256 matrix, and 2503250-mm field of view. The sections were positioned to run parallel to a line that joins the most inferoanterior and inferoposterior parts of the corpus callosum (34). For the DT MR images, 10 axial sections with a 5-mm section thickness, 128 3 128 matrix, and 2503250-mm field of view were acquired, with the same orientation as the other images and the second-last caudal sec-tion posisec-tioned to match exactly the central slices of these sets. This brain portion was chosen because the periventricular area is a common location for MS lesions. In addition, these central sections are less affected by the distortions due to B0 field inhomogeneity, which can affect image coregistration.
Image Analysis and Postprocessing
An experienced observer examined the hard copies of the proton density (PD)-weighted and T1-weighted scans and marked the PD hyperintense and the T1 hypointense lesions. T2-weighted images were always used to increase confidence in lesion identification. Using the marked hard copies as a refer-ence, a trained technician outlined lesions as ROI on a computer display and measured the T2 and T1 lesion volumes (LV) using a semiautomated technique based on local thresholding (35).
Brain volume was measured from T1-weighted images by using a seed growing technique for brain parenchyma segmen-tation. This method is based on signal intensity thresholding. A seed point was positioned in any part of the cerebral paren-chyma, and from this seed, an ROI was grown. This ROI con-tained all connected pixels within two given signal intensity values. The upper and lower signal intensity for seed growing could be interactively changed on a section-by-section basis. If the ROI crossed the border of interest, a manual boundary was drawn to limit the seed growing. At the end of the seg-mentation process, the tissue volume was calculated by mul-tiplying the number of pixels included in the ROI for the voxel size. All brain volume measurements were done by the same observer who identified the MS lesions.
From the two GE images, with and without the saturation pulse, MTR maps were derived pixel-by-pixel according to the following equation: MTR5(M02MS)/M03100%, in which
M0 is the signal intensity for a given pixel without the
satu-ration pulse and MSis the signal intensity for the same pixel
when the saturation pulse is applied. MTR maps were then coregistered with the dual-echo T2-weighted images by using an algorithm based on mutual information (36).
DT MR images were first corrected for distortion induced by eddy currents by using an algorithm that minimizes mutual information between the diffusion unweighted and weighted images (36). Then, assuming a monoexponential relationship between signal intensity and the product of the b matrix (a 3
33 matrix that expresses the relationship between the signal attenuation and the elements of the diffusion tensor matrix) and diffusion tensor matrix components, the diffusion tensor was calculated for each pixel according to the following equation:
6 6
M
5exp
1
2O O
b Dij ij2
, M0 i51 j51where M is the measured signal intensity, M0is the
T2-weight-ed signal intensity, bij are the elements of the b matrix, and Dijare the elements of the diffusion tensor matrix. The tensor
was estimated by nonlinear regression using the Marquardt-Levenberg method. After diagonalization of the estimated ten-sor matrix, D¯ and FA were derived for every pixel. The dif-fusion images were interpolated to the same image matrix size as that of the dual-echo images, and then the b 5 0 step of the echo-planar scans (T2-weighted, but not diffusion-weight-ed) was coregistered with the dual-echo T2-weighted images by using an algorithm based on mutual information (36). The
same transformation parameters were then used to coregister the D¯ and FA images to the dual-echo images.
Lesion outlines on PD-weighted images were automatically transferred onto the coregistered MTR, D¯ , and FA images, and the area, D¯ , and FA of each lesion measured. Then the average lesion D¯ and FA, weighted by lesion area (28), were calculated for each patient.
Histograms of MTR, D¯ , and FA maps were created as pre-viously described (8, 27, 28), after removal of the extracerebral tissue and of CSF, by using the same technique applied to segment lesions (35). Only the brain portion covered by both MT and DT MR images (ie, the central 10 sections) entered the histogram analysis. To correct for the between-subject dif-ferences in brain volume, each histogram was normalized by dividing the height of each histogram bin by the total number of pixels contributing to the histogram. MTR and D¯ histograms were derived from the overall brain tissue studied (BT) and from the normal-appearing brain tissue (NABT) (ie, the tissue not involved by macroscopic T2 hyperintense lesions). To ob-tain the MTR and D¯ histograms of NABT, MS lesion outlines from T2-weighted scans were automatically transferred onto the coregistered MTR and D¯ maps and then nulled out. FA histograms were derived only from the BT. For all the histo-grams, the average MTR, D¯ , and FA values were calculated, as well as the heights and locations of the peaks of the histograms.
Statistical Analysis
The univariate correlations between the different MR-de-rived measures and between the different MR-deMR-de-rived mea-sures and EDSS were assessed using the Spearman rank cor-relation coefficient. Group comparisons were assessed using a two-tailed Student t test for non-paired data. To reflect the large number of statistical comparisons, only P values,.001 were considered statistically significant. Owing to the exploratory nature of this study, we did not apply a more rigorous statis-tical correction for multiple comparisons in order to minimize the risk of type II errors. Only the correlations that were found to be statistically significant or whose magnitude was at least moderate (ie, with an r value$0.3) are reported.
Results
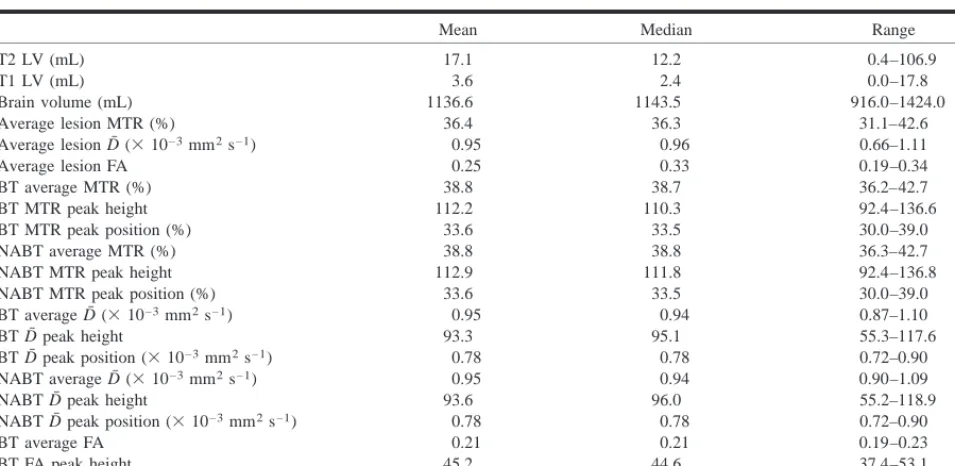
In Table 1, the values of the different
conven-tional, MT, and DT MR quantities studied are
re-ported for the whole patient sample. No
T2-hyper-intense or T1-hypoT2-hyper-intense lesions were found on
the scans of healthy control subjects. Average D
¯
was significantly lower (0.90
3
10
23mm
2s
21, P
5
.0001) and average MTR significantly higher
(40.3%, P
5
0.0001) in control subjects than in
patients. All the other MTR and D
¯
histogram–de-rived metrics also significantly differed between
control subjects and MS patients (P values ranging
from .003 to .0001).
TABLE 1: Measures derived from conventional, MT, and DT MR imaging from 34 RRMS patients
Mean Median Range
T2 LV (mL) T1 LV (mL) Brain volume (mL) Average lesion MTR (%)
Average lesion D¯ (31023mm2s21)
Average lesion FA
17.1 3.6 1136.6 36.4 0.95 0.25
12.2 2.4 1143.5 36.3 0.96 0.33
0.4–106.9 0.0–17.8 916.0–1424.0
31.1–42.6 0.66–1.11 0.19–0.34 BT average MTR (%)
BT MTR peak height BT MTR peak position (%) NABT average MTR (%) NABT MTR peak height NABT MTR peak position (%)
38.8 112.2 33.6 38.8 112.9 33.6
38.7 110.3 33.5 38.8 111.8 33.5
36.2–42.7 92.4–136.6 30.0–39.0 36.3–42.7 92.4–136.8 30.0–39.0 BT average D¯ (31023mm2s21)
BT D¯ peak height
BT D¯ peak position (31023mm2s21)
NABT average D¯ (31023mm2s21)
NABT D¯ peak height
0.95 93.3
0.78 0.95 93.6
0.94 95.1
0.78 0.94 96.0
0.87–1.10 55.3–117.6 0.72–0.90 0.90–1.09 55.2–118.9 NABT D¯ peak position (31023mm2s21)
BT average FA BT FA peak height BT FA peak position
0.78 0.21 45.2
9.9
0.78 0.21 44.6 10.0
0.72–0.90 0.19–0.23 37.4–53.1 8.0–12.0
Note.—See text for abbreviations.
TABLE 2: Correlations between D¯ histogram–derived metrics and T2 and T1 LV in 34 RRMS patients
T2 Lesion Volume
r P
T1 Lesion Volume
r P
BT D¯ (31023mm2s21)
BT D¯ peak height
BT D¯ peak position (31023mm2s21)
NABT average D¯ (31023mm2s21)
NABT D¯ peak height
NABT D¯ peak position (31023mm2s21)
0.78
20.68 0.58 0.77
20.65 0.57
,.001
,.001
,.001
,.001
,.001
,.001
0.71
20.65 0.53 0.70
20.63 0.52
,.001
,.001
,.001
,.001
,.001
,.001
Note.–See text for abbreviations and statistical analysis.
No significant correlations were found among
the corresponding quantities of the MTR, D
¯ , and
FA histograms. Modest, but statistically
insignifi-cant correlations were found among the average BT
D
¯ and FA (r
5 2
0.39), the peak positions of the
MTR histograms, and the average D
¯ values from
both BT and NABT (r values ranging from
2
0.34
to
2
0.43) and among the average FA and the peak
heights of BT or NABT D
¯ histograms (r
5
0.32).
Average lesion MTR, D
¯ , and FA were neither
sig-nificantly correlated nor showed a trend toward
significance.
None of the MR quantities we measured were
significantly correlated with patient EDSS score.
EDSS was modestly, but not significantly,
corre-lated only with T1 LV (r
5
0.36).
Discussion
Although the assessment of lesion burden from
T2-weighted MR scans is widely used as a
surro-gate marker of disease evolution in MS studies (4),
abnormalities seen on T2-weighted images do not
[image:4.612.43.528.357.454.2]which is important in multifocal and widespread
diseases, such as MS. Previous MS studies used
MT or DT MR imaging in isolation and, therefore,
did not have the opportunity to investigate the
cor-relation among quantities derived from these
tech-niques. Because different MR techniques
necessar-ily provide overlapped information, defining the
magnitude of such a correlation is an important
pre-requisite to avoid the acquisition of redundant MR
data.
In this study, we found that quantities derived
from MTR histogram analysis of the BT and
NABT are not significantly correlated with the
cor-responding quantities from D
¯ and FA histograms.
This confirms and extends the results of a previous
study that used diffusion-weighted MR imaging
and showed a lack of correlation between average
MTR and D
¯ of BT (27). We also did not find
sig-nificant correlations between lesion MTR, D
¯ , and
FA. These observations suggest that MT and DT
MR imaging provide relatively independent
mea-sures of MS pathologic abnormalities and that their
combined use might result in a gain of relevant
information leading to an understanding of the
mechanisms underlying the clinical manifestations
of the disease. Although correlative studies with
histopathology are needed, we believe that the lack
of correlation between MTR and DT MR metrics
in the brain tissue is the result of the complex
re-lationship between destructive (inflammation,
de-myelination, and axonal loss) and reparative
(re-myelination and gliosis) mechanisms occurring
within and outside T2-visible lesions and their
var-iable effects on MTR, D
¯ , and FA values. That MTR
and DT MR metrics provide complementary and
partially independent information is supported by
another finding that DT histogram metrics are
strongly correlated with T2 and T1 LV, whereas
quantities derived from MTR histograms are
mod-estly, but not significantly, correlated.
We did not find any correlation between brain
volume and quantities derived from MT and DT
MR imaging. The measurement of brain volume
has recently been suggested as a marker of MS
se-verity with the potential to monitor the disease
evo-lution accurately (39). Several studies found that
MR imaging measures of brain atrophy were
cor-related with the level of disability or the course of
the disease (40–44) and found moderate correlation
between brain volume and MTR histogram–derived
metrics (45–47). The discrepancy between our
re-sults and those of previous studies (45–47) might
be due to the clinical characteristics of the patients
we studied, who were mildly disabled by RRMS.
Although brain volumes vary markedly in healthy
individuals and, as a consequence, a normalization
of brain volumes would have been desirable (43),
this observation suggests that brain atrophy
mea-surement might not be sensitive to the most early
and subtle aspects of the MS pathologic
abnormal-ities. It is indeed conceivable that brain atrophy in
MS is a late phenomenon, which follows the
ap-pearance of other evidences of tissue loss and
dis-organization, detectable by MT and DT MR
im-aging. This is consistent with recent MR
spectroscopy findings, indicating that the presence
of axonal damage can be detected in RRMS
pa-tients in the absence of concomitant decreases of
brain volume (48).
Conclusion
Although preliminary and warranting further
in-vestigation, our results suggest that the application
of different MR techniques with variable sensitivity
to the heterogeneous pathologic aspects of MS
might contribute to a better understanding of MS
pathophysiology and call for a multiparametric MR
approach in the study of patients with MS.
References
1. Coles AJ, Wing MG, Molyneux P, et al. Monoclonal antibody treatment exposes three mechanisms underlying the clinical course of multiple sclerosis. Ann Neurol 1999;46:296–304 2. Arnold DL. Magnetic resonance spectroscopy: imaging axonal
damage in MS. J Neuroimmunol 1999;98:2–6
3. Filippi M. The role of non-conventional magnetic resonance techniques in monitoring evolution of multiple sclerosis. J Neurol Neurosurg Psychiatry 1998;64Suppl 1:S52–S58 4. Miller DH, Grossman RI, Reingold SC, McFarland HF. The role
of magnetic resonance techniques in understanding and man-aging multiple sclerosis. Brain 1998;121:3–24
5. Filippi M, Campi A, Dousset V, et al. A magnetization transfer imaging study of normal-appearing white matter in multiple sclerosis. Neurology 1995;45:478–482
6. Filippi M, Tortorella C, Bozzali M. Normal-appearing-white-matter changes in multiple sclerosis: the contribution of mag-netic resonance techniques. Mult Scler 1999;5:273–282 7. Loevner LA, Grossman RI, Cohen JA, Lexa FJ, Kessler D, Kolson
DL. Microscopic disease in normal-appearing white matter on conventional MR images in patients with multiple sclerosis: assessment with magnetization-transfer measurements. Radi-ology 1995;196:511–515
8. Tortorella C, Viti B, Bozzali M, et al. A magnetization transfer histogram study of normal-appearing brain tissue in MS. Neu-rology 2000;54:186–193
9. Grossman RI. Magnetization transfer in multiple sclerosis. Ann Neurol 1994;36[Suppl]:S97–S99
10. van Waesberghe JH, Kamphorst W, De Groot Cj, et al. Axonal loss in multiple sclerosis lesions: magnetic resonance imaging insights into substrates of disability. Ann Neurol 1999;46: 747–754
11. Brochet B, Dousset V. Pathological correlates of magnetization transfer imaging abnormalities in animal models and humans with multiple sclerosis. Neurology 1999;53[Suppl] 3:S12–S17 12. Dousset V, Grossman RI, Ramer KN, et al. Experimental allergic
encephalomyelitis and multiple sclerosis: lesion characteriza-tion with magnetizacharacteriza-tion transfer imaging. Radiology 1992;182: 483–491
13. Dousset V, Armand JP, Lacoste D, et al. Magnetization transfer study of HIV encephalitis and progressive multifocal leuko-encephalopathy. Groupe d’Epidemiologie Clinique du SIDA en Aquitaine. AJNR Am J Neuroradiol 1997;18:895–901 14. Silver NC, Barker GJ, MacManus DG, Miller DH, Thorpe JW,
Howard RS. Decreased magnetisation transfer ratio due to de-myelination: a case of central pontine myelinosis. J Neurol Neu-rosurg Psychiatry 1996;61:208–209
15. Le Bihan D, Breton E, Lallemand D, Grenier P, Cabanis E, Laval-Jeantet M. MR imaging of intravoxel incoherent motions: ap-plication to diffusion and perfusion in neurologic disorders. Radiology 1986;161:401–407
17. Le Bihan D, Turner R, Moonen CT, Pekar J. Imaging of diffusion and microcirculation with gradient sensitization: design, strat-egy, and significance. J Magn Reson Imaging 1991;1:7–28 18. Chenevert TL, Brunberg JA, Pipe JG. Anisotropic diffusion in
human white matter: demonstration with MR techniques in vivo. Radiology 1990;177:401–405
19. Cleveland GG, Chang DC, Hazlewood CF, Rorschach HE. Nucle-ar magnetic resonance measurement of skeletal muscle: an-isotropy of the diffusion coefficient of the intracellular water. Biophys J 1976;16:1043–1053
20. Beaulieu C, Allen PS. Determinants of anisotropic water dif-fusion in nerves. Magn Reson Med 1994;31:394–400
21. Basser PJ, Mattiello J, Le Bihan D. Estimation of the effective self-diffusion tensor from the NMR spin-echo. J Magn Reson B 1994;103:247–254
22. Basser PJ, Pierpaoli C. Microstructural and physiological fea-tures of tissues elucidated by quantitative-diffusion-tensor MRI. J Magn Reson B 1996;111:209–219
23. Pierpaoli C, Jezzard P, Basser PJ, Blarnett A, Di Chiro G. Dif-fusion tensor MR imaging of the human brain. Radiology 1996; 201:637–648
24. Droogan AG, Clark CA, Werring DJ, Barker GJ, McDonald WI, Miller DH. Comparison of multiple sclerosis clinical subgroups using navigated spin echo diffusion-weighted imaging. Magn Reson Imaging 1999;17:653–661
25. Filippi M, Iannucci G, Cercignani M, Assunta Rocca M, Pratesi A, Comi G. A quantitative study of water diffusion in multiple sclerosis lesions and normal-appearing white matter using echo-planar imaging. Arch Neurol 2000;57:1017–1021 26. Werring DJ, Clark CA, Barker GJ, Thompson AJ, Miller DH.
Diffusion tensor imaging of lesions and normal-appearing white matter in multiple sclerosis. Neurology 1999;52: 1626–1632
27. Cercignani M, Iannucci G, Rocca MA, Comi G, Horsfield MA, Filippi M. Pathological damage in MS assessed by diffusion-weighted and magnetization transfer MRI. Neurology 2000;54: 1139–1144
28. Filippi M, Iannucci G, Tortorella C, et al. Comparison of MS clinical phenotypes using conventional and magnetization transfer MRI. Neurology 1999;52:588–594
29. Nusbaum AO, Tang CY, Wei TC, Buchsbaum MS, Atlas SW. Whole-brain diffusion MR histograms differ between MS sub-types. Neurology 2000;54:1421–1427
30. van Buchem MA, McGowan JC, Kolson DL, Polansky M, Gross-man RI. Quantitative volumetric magnetization transfer anal-ysis in multiple sclerosis: estimation of macroscopic and mi-croscopic disease burden. Magn Reson Med 1996;36:632–636 31. Lublin FD, Reingold SC. Defining the clinical course of multiple
sclerosis: results of an international survey. National Multiple Sclerosis Society (USA) Advisory Committee on Clinical Trials of New Agents in Multiple Sclerosis. Neurology 1996;46: 907–911
32. Kurtzke JF. Rating neurological impairment in multiple scle-rosis: an expanded disability status scale (EDSS). Neurology 1983;33:1444–1452
33. Bito Y, Hirata S, Yamamoto E. Optimal gradient factors for ADC measurements [abstract]. Proc Intl Soc Magn Reson Med 1995;2:913
34. Miller DH, Barkhof F, Berry I, Kappos L, Scotti G, Thompson AJ. Magnetic resonance imaging in monitoring the treatment of multiple sclerosis: concerted action guidelines. J Neurol Neu-rosurg Psychiatry 1991;54:683–688
35. Rovaris M, Filippi M, Calori G, et al. Intra-observer reproduc-ibility in measuring new putative MR markers of demyelin-ation and axonal loss in multiple sclerosis: a comparison with conventional T2-weighted images. J Neurol 1997;244:266–270 36. Studholme C, Hill DL, Hawkes DJ. Automated
three-dimen-sional registration of magnetic resonance and positron emis-sion tomography brain images by multiresolution optimization of voxel similarity measures. Med Phys 1996;24:25–35 37. Filippi M, Tortorella C, Rovaris M, et al. Changes in the normal
appearing brain tissue and cognitive impairment in multiple sclerosis. J Neurol Neurosurg Psychiatry 2000;68:157–161 38. Iannucci G, Tortorella C, Rovaris M, Sormani MP, Comi G, Filippi
M. Prognostic value of MR and magnetization transfer imag-ing findimag-ings in patients with clinically isolated syndromes sug-gestive of multiple sclerosis at presentation. AJNR Am J Neu-roradiol 2000;21:1034–1038
39. Jagust WJ, Noseworthy JH. Brain atrophy as a surrogate mark-er in MS: fastmark-er, simplmark-er, bettmark-er? Neurology 2000;54:782–783 40. Filippi M, Mastronardo G, Rocca MA, Pereira C, Comi G.
Quan-titative volumetric analysis of brain magnetic resonance im-aging from patients with multiple sclerosis. J Neurol Sci 1998; 158:148–153
41. Fox NC, Jenkins R, Leary SM, et al. Progressive cerebral at-rophy in MS: a serial study using registered, volumetric MRI. Neurology 2000;54:807–812
42. Ge Y, Grossman RI, Udupa JK, et al. Brain atrophy in relapsing-remitting multiple sclerosis and secondary progressive multi-ple sclerosis: longitudinal quantitative analysis. Radiology 2000;214:665–670
43. Losseff NA, Wang L, Lai HM, et al. Progressive cerebral at-rophy in multiple sclerosis. A serial MRI study. Brain 1996; 119:2009–2019
44. Rudick RA, Fisher E, Lee JC, Simon J, Jacobs L. Use of the brain parenchymal fraction to measure whole brain atrophy in relapsing-remitting MS. Multiple Sclerosis Collaborative Research Group. Neurology 1999;53:1698–1704
45. Phillips MD, Grossman RI, Miki Y, et al. Comparison of T2 lesion volume and magnetization transfer ratio histogram analysis and of atrophy and measures of lesion burden in pa-tients with multiple sclerosis. AJNR Am J Neuroradiol 1998;19: 1055–1060
46. Rovaris M, Bozzali M, Rodegher M, Tortorella C, Comi G, Filippi M. Brain MRI correlates of magnetization transfer imaging metrics in patients with multiple sclerosis. J Neurol Sci 1999; 166:58–63
47. Miki Y, Grossman RI, Udupa JK, et al. Differences between re-lapsing-remitting and chronic progressive multiple sclerosis as determined with quantitative MR imaging. Radiology 1999; 210:769–774