Curing MRI
A study on MRI workflow to increase productivity after changing to a new location with new state of the art MRI equipment
2010
Master thesis J.S. Kooij
Curing MRI
A study on MRI workflow to increase productivity after changing to a new location with new state of the art MRI equipment
J.S. Kooij
Student Industrial Engineering & Management, University of Twente Health Care Technology & Management
Student number s0071897
1st Supervisor: Prof. Dr. Ir. J.J. Krabbendam
Professor of Operations Management University of Twente School of Management and Governance
Dep. of Operations, Organisation and Human Resources
2nd Supervisor: Prof. Dr. H.G. Bijker
Professor of Change Management in Healthcare School of Management and Governance
Dep. of Operations, Organisation and Human Resources
External supervisor: L. Manshanden
Manager Sales Support Healthcare Siemens Nederland N.V
External supervisor: P. Elshout
Business Partner Healthcare Siemens Nederland N.V
External supervisor: H. Gereadts
Henry Ford in 1922:
Executive Summary
Introduction
As a result of the changes in the entire health care system, hospitals are working towards becoming more efficient as well as more effective. This focus provides opportunities for the health care industry. At the end of 2009, Siemens Healthcare and the Jeroen Bosch hospital (JBZ) came to an agreement for a partnership for the delivery and maintenance of medical imaging systems for the JBZ. The planned changes of the JBZ towards a new hospital building and the use of new medical imaging systems provide the opportunity to redesign the workflow. This research focuses on the MRI service.
Problem description
In April 2011, the MRI service of the JBZ should be treating its first patients on the new location with the new MRI systems. The planned changes have influence on the workflow, throughput, quality of diagnosis, job satisfaction, and demand for the MRI service. These influences cause uncertainty for all MRI stakeholders. In addition to the uncertainty resulting from the planned changes, the MRI service has an access time of four weeks, yearly production targets have not been met and the MRI service acts as a bottleneck in the entire care process. The goal of this research is to analyze the change of medical imaging systems and the change to a new location of the JBZ in order to improve the MRI service. The analysis should result in recommendations for both the JBZ and Siemens.
Approach
This research uses an Operations Management approach to analyze the current situation, find alternative solutions and redesign the MRI workflow of the JBZ. Since the JBZ has to be operational on the new location with the MRI systems within nine months, change management literature is used to improve adoption. The current situation is analyzed using quantitative and qualitative data and results in the identification of areas for improvement (1). These areas for improvement are the main subjects in a benchmark between four Dutch, non-academic hospitals. The benchmark is used to interpret the results from the analysis of the current situation and identify best-practice. In addition to the benchmark, we have used manufacturing improvement theories as Lean and Theory of Constraints to create a list of possible improvement interventions (2). To redesign the workflow for the new situation, we have combined both (1) and (2). We have organized presentations, involved and informed MRI actors to improve adoption of workflow interventions.
Results
Future State Value Stream Map. The application of the ToC concept provides options to eliminate the MRI service as the bottleneck in the entire care process.
On the new location the request form should directly result in an appointment for the patient. Patient preparation should be done outside the MRI room. During the examination, radiographers should be able to make all the decisions concerning additional sequences. The result of the MRI examination should be processed into a report on the same day. Planning should result in the availability of patients in the waiting room at all times and inpatient blocks should be eliminated. After all actors have adopted the new workflow and MRI systems in their routines, less staff could be used due to a shared control room. New MRI systems improve performance on productivity, quality of care, and quality of labor. The creation of a common goal, team culture and cooperative attitude should have high priority. The use of due dates and multi disciplinary teams are useful solutions.
Conclusions
The MRI service will be improved on the new location since the concentration of all the facilities on one location eliminates some of the current restrictions and also the state of the art technology of the new MRI systems improves productivity as well as quality. However, our analysis showed important inefficiencies in the MRI organization which provides opportunities to improve the performance of the MRI service even more. The success of the change towards the new location and the implementation of the advised improvements will be greatly influenced by the involvement, insight and acceptance from stakeholders. The creation of a common goal, team culture and cooperative attitude should have high priority.
Recommendations
JBZ Management
We recommend changing the workflow as given in the future state value stream map. New information systems (EMR, RIS) should have priority to enable complete digital workflow and establishing a team culture to improve adoption. Planning should be focused on flexibility of using a central waiting room to adapt on variability. Data collection should be improved to continuously monitor performance. Performance data should be made transparent to all actors in radiology to enable continuous improvements by radiology actors. Our last recommendation is to communicate problems, wishes and ideas with Siemens to attain joint value creation. Recommendations for Siemens Healthcare
This research has provided insight in how customers manage their services. An important conclusion we can derive from this project is that when using workflow improvement (opportunities) as a key selling point, additional advice on how to design their service can be a valuable addition. The benchmark has showed that many radiology managers have interest in improving their service. Business partners should be able to advise customers on how to improve their workflow to fully benefit from the capabilities of the medical imaging systems.
Preface
To finish my master Industrial Engineering & Management, a final project was needed. After my bachelor project I was looking for a new challenge. One of my requirements for a company or organization that would facilitate my graduation was that it should be a potential future employer. Several opportunities showed up, but it took a while before I came in contact with Siemens. On a symposium at the University of Twente about market forces in healthcare that was organized by Professor Krabbendam and Professor Bijker, the presentation from Siemens Healthcare greatly interested me.
During the first meetings with Siemens a deal was closed between Siemens and the Jeroen Bosch hospital. Their partnership became the playing-field for my research. On Friday the 25th of December I was introduced in the hospital. The situation of the Jeroen Bosch hospital is unique since they are about to change from hospital location and medical imaging systems. My experience from my BSc-project in Australia could be used to quickly start up the BSc-project and understand the radiology issues. However, my research in Australia on workflow in radiology did not include solution generation and implementation. The opportunity to do this in this unique project was very motivating.
Since the start of my project in January, I have enjoyed being part of two organizations. I would like to thank John Peeters and Harm Geraedts from the Jeroen Bosch hospital for their time, effort and knowledge. I hope this report and my presentations provide valuable insights in their problems and opportunities. I would also like to thank Patrick Elshout, who was my supervisor from Siemens in the last six months. Our conversations where efficient and effective, which was also very important in my own workflow. Working in the hospital was mostly about gathering information and providing insights in the results. My actual analysis however was mostly done on the fourth floor of the Siemens office in The Hague. Very valuable were the moments with Lia Manshanden when going through my work. She provided critical feedback that I greatly appreciated.
Important moments were also the conversations with my supervisors from the University of Twente: Prof. Dr. Ir. Koos Krabbendam and Prof. Dr. Henk Bijker. Your enormous experience in health care (research) and personalities provided me valuable insights and enthusiasm to make the best of my research.
Finally, I would like to express my gratitude towards Lotte, my parents and my friends for their support and interest.
I hope you will enjoy reading this thesis.
Jelle Kooij
Table of Contents
Executive Summary ... 4
Preface ... 6
Table of Contents ... 7
List of Figures ... 9
List of tables ... 10
Chapter 1 - Research framework ... 11
1.1 Introduction to the research environment ... 11
1.2 Problem identification ... 12
1.3 Theoretic framework ... 13
1.3.1 Management of Change ... 13
1.3.2 Operations Management ... 16
1.3.3 Research model ... 18
1.4 Research Goals and Questions ... 19
1.5 Methodology ... 20
Chapter 2 – OM in radiology ... 23
2.1 Operations Strategy... 23
2.2 Input ... 24
2.2.1 Technology ... 24
2.2.2 Staff ... 25
2.2.3 Information ... 25
2.2.4 Patients ... 26
2.3 Transformation ... 26
2.3.1 Design ... 27
2.3.2 Planning & Control ... 27
2.3.3 Improvements ... 29
2.4 Output ... 32
2.5 Conclusions ... 32 Chapter 3 – Current Situation ... Fout! Bladwijzer niet gedefinieerd.
3.1 Operations Strategy... Fout! Bladwijzer niet gedefinieerd.
3.2 Input ... Fout! Bladwijzer niet gedefinieerd.
3.2.1 Technology ... Fout! Bladwijzer niet gedefinieerd.
3.2.2 Staff ... Fout! Bladwijzer niet gedefinieerd.
3.2.4 Patients ... Fout! Bladwijzer niet gedefinieerd.
3.3 Transformation ... Fout! Bladwijzer niet gedefinieerd.
3.3.1 Design ... Fout! Bladwijzer niet gedefinieerd.
3.3.2. Planning & Control ... Fout! Bladwijzer niet gedefinieerd.
3.3.3 Improvements ... Fout! Bladwijzer niet gedefinieerd.
3.4 Output ... Fout! Bladwijzer niet gedefinieerd.
3.5 Conclusions ... Fout! Bladwijzer niet gedefinieerd.
Chapter 4 – Alternative solutions ... Fout! Bladwijzer niet gedefinieerd.
4.1 Benchmark MRI workflow ... Fout! Bladwijzer niet gedefinieerd.
4.1.1 Hospital characteristics ... Fout! Bladwijzer niet gedefinieerd.
4.1.2 Process design ... Fout! Bladwijzer niet gedefinieerd.
4.1.3 Output ... Fout! Bladwijzer niet gedefinieerd.
4.1.4 Conclusions from the benchmark ... Fout! Bladwijzer niet gedefinieerd.
4.2 Possible improvements ... Fout! Bladwijzer niet gedefinieerd.
4.2.1 Remove Waste and improve flow ... Fout! Bladwijzer niet gedefinieerd.
4.2.2 Optimize bottleneck ... Fout! Bladwijzer niet gedefinieerd.
4.3 Decision ... Fout! Bladwijzer niet gedefinieerd.
Chapter 5 – New location ... Fout! Bladwijzer niet gedefinieerd.
5.1 Operations Strategy... Fout! Bladwijzer niet gedefinieerd.
5.2. Input ... Fout! Bladwijzer niet gedefinieerd.
5.2.1 MRI systems ... Fout! Bladwijzer niet gedefinieerd.
5.2.2 Information ... Fout! Bladwijzer niet gedefinieerd.
5.3 Transformation ... Fout! Bladwijzer niet gedefinieerd.
5.3.1 Process design ... Fout! Bladwijzer niet gedefinieerd.
5.3.2 Planning & Control ... Fout! Bladwijzer niet gedefinieerd.
5.3.3 Improvements ... Fout! Bladwijzer niet gedefinieerd.
5.4. Output ... Fout! Bladwijzer niet gedefinieerd.
5.5 Conclusion ... Fout! Bladwijzer niet gedefinieerd.
Chapter 6 - Conclusions and Recommendations ... Fout! Bladwijzer niet gedefinieerd.
6.1 Conclusions ... Fout! Bladwijzer niet gedefinieerd.
6.2 Recommendations... Fout! Bladwijzer niet gedefinieerd.
6.3 Recommendations for further research ... Fout! Bladwijzer niet gedefinieerd.
6.4 Limitations of research ... Fout! Bladwijzer niet gedefinieerd.
7. Afterword ... Fout! Bladwijzer niet gedefinieerd.
8. References ... Fout! Bladwijzer niet gedefinieerd.
Annex 1 – Information JBZ ... Fout! Bladwijzer niet gedefinieerd.
Annex 2 – Organization chart radiology JBZ ... Fout! Bladwijzer niet gedefinieerd.
Annex 3 – Flow chart JBZ ... Fout! Bladwijzer niet gedefinieerd.
Annex 4 – Value Stream Mapping symbols ... Fout! Bladwijzer niet gedefinieerd.
Annex 5 – FTE calculation ... Fout! Bladwijzer niet gedefinieerd.
Annex 6 – MRI Planning overview ... Fout! Bladwijzer niet gedefinieerd.
Annex 7 – Production hours calculation... Fout! Bladwijzer niet gedefinieerd.
Annex 8 – JBZ handout ... Fout! Bladwijzer niet gedefinieerd.
Annex 9 - Benchmark questionnaire ... Fout! Bladwijzer niet gedefinieerd.
Annex 10 – Layout new location JBZ ... Fout! Bladwijzer niet gedefinieerd.
Annex 11 – Benchmark report ... Fout! Bladwijzer niet gedefinieerd.
List of Figures
Figure 1: Research scope ... 12
Figure 2: Stakeholder classifications (Mitchell, Agle, & Wood, 1997) ... 14
Figure 3: Conflict - handling modes (Thomas, 2008) ... 15
Figure 4: The four worlds of the hospital (Glouberman & Mintzberg, 2001a) ... 15
Figure 5: 10-step model for inducing change (Grol & Wensing, 2004) ... 16
Figure 6: Relation between process and planning ... 18
Figure 7: Basic research model ... 19
Figure 8: Research model ... 20
Figure 9: Research methodology ... 22
Figure 10: Relation demand, capacity and queue ... 29 Figure 11: Radiology actors and their importance ... Fout! Bladwijzer niet gedefinieerd.
Figure 12: Information systems ... Fout! Bladwijzer niet gedefinieerd.
Figure 13: high level workflow ... Fout! Bladwijzer niet gedefinieerd.
Figure 14: Current State Value Stream ... Fout! Bladwijzer niet gedefinieerd.
Figure 15: Variation in demand and production ... Fout! Bladwijzer niet gedefinieerd.
Figure 16: Relations performance objectives ... Fout! Bladwijzer niet gedefinieerd.
Figure 17: Geographical position benchmark hospitals ... Fout! Bladwijzer niet gedefinieerd.
Figure 18: Reporting time ... Fout! Bladwijzer niet gedefinieerd.
Figure 19: Factors influencing performance ... Fout! Bladwijzer niet gedefinieerd.
Figure 20: New JBZ building ... Fout! Bladwijzer niet gedefinieerd.
List of tables
Table 1: Comparison of manufacturing and hospital operations (Rhyne & Jupp, 1988) ... 17 Table 2: Operations strategy perspectives ... 23 Table 3: Improvement theories (Nave, 2002) ... 30 Table 4: Sub questions part 1 ... Fout! Bladwijzer niet gedefinieerd.
Table 5: Patient casemix ... Fout! Bladwijzer niet gedefinieerd.
Table 6: Requesting departments ... Fout! Bladwijzer niet gedefinieerd.
Table 7: Screening statistics ... Fout! Bladwijzer niet gedefinieerd.
Table 8: Staff types ... Fout! Bladwijzer niet gedefinieerd.
Table 9: Planning slots ... Fout! Bladwijzer niet gedefinieerd.
Table 10: Access times 2009 (JBZ HIS) ... Fout! Bladwijzer niet gedefinieerd.
Table 11: Production improvements ... Fout! Bladwijzer niet gedefinieerd.
Table 12: Production per examination ... Fout! Bladwijzer niet gedefinieerd.
Table 13: Production per MRI system ... Fout! Bladwijzer niet gedefinieerd.
Table 14: Production per radiologist ... Fout! Bladwijzer niet gedefinieerd.
Table 15: Reporting time statistics ... Fout! Bladwijzer niet gedefinieerd.
Table 16: Access time statistics ... Fout! Bladwijzer niet gedefinieerd.
Table 17: Input characteristics (1) ... Fout! Bladwijzer niet gedefinieerd.
Table 18: Input characteristics (2) ... Fout! Bladwijzer niet gedefinieerd.
Table 19: Throughput characteristics ... Fout! Bladwijzer niet gedefinieerd.
Table 20: Hospital opening hours ... Fout! Bladwijzer niet gedefinieerd.
Table 21: Planning characteristics ... Fout! Bladwijzer niet gedefinieerd.
Table 22: Differences before examination ... Fout! Bladwijzer niet gedefinieerd.
Table 23: Production development ... Fout! Bladwijzer niet gedefinieerd.
Table 24: Production per hour ... Fout! Bladwijzer niet gedefinieerd.
Table 25: Planned utilization ... Fout! Bladwijzer niet gedefinieerd.
Table 26: Workflow scores ... Fout! Bladwijzer niet gedefinieerd.
Table 27: Sources of waste ... Fout! Bladwijzer niet gedefinieerd.
Table 28: Sub questions part 3 ... Fout! Bladwijzer niet gedefinieerd.
Chapter 1 - Research framework
The first chapter of this thesis outlines the research framework and sets the research goals. In Section 1.1 the research environment is described. In this research environment, we identify the problems. The research problems will be elaborated upon in Section 1.2. In Section 1.3 the theoretic framework for this research is described. The research goals and corresponding questions are stated in Section 1.4. The last section in Chapter 1 provides the answer to the question about how we should answer the research questions.
1.1 Introduction to the research environment
Global developments as the increased knowledge and understanding of health and the accelerated technological revolution are multiplying the potential for improving health. These developments have caused the growth of health expenditures with 35% in the period between 2000 and 2005 (World Health Organization, 2008) and therefore redesign initiatives are currently implemented. To reduce costs and improve quality the Dutch government has introduced market forces in health care. The responsibility to purchase care is shifting from government to insurance companies and health care providers are competing. Hospitals are partly financed by the health care insurance companies via diagnosis related groups (DBC in Dutch). As a result of the current financial system and competition due to the rise of private initiatives, hospitals are working towards becoming more efficient as well as more effective.
The increased focus on achieving work efficiencies provides opportunities for the health care industry. The medical equipment industry is changing their offer from pure technology based, to a combination of technology and services to meet customer demand (Postema, 2007). Developments are pointing towards more extensive involvement of the vendor with the hospital. The main vendors in the Netherlands for medical imaging systems are Siemens, Philips and GE. At the end of 2009, Siemens Healthcare and the Jeroen Bosch Hospital (JBZ) came to an agreement for a partnership for the delivery and maintenance of medical imaging systems for the new JBZ hospital.
Siemens Healthcare in The Netherlands is situated in Den Haag (NL) and offers medical imaging solutions, services and IT solutions. Activities include the sales, marketing and implementation of modalities, consultancy, maintenance, training and IT implementations. The goal of Siemens Healthcare is to support the primary care process as good as possible and offers next to radiology also services for urology, cardiology, nuclear medicine and the operating rooms. The production and research and development facilities are situated outside the Netherlands and therefore added-value of the Siemens Healthcare division in the Netherlands is mainly achieved through the services offered (Siemens Nederland N.V., 2005).
In 2007, the JBZ started with the construction of a new location. This location will replace the three other main locations and should offer modern, patient-centered care (Jeroen Bosch Ziekenhuis, 2010). The hospital invested in new medical imaging solutions from both Siemens and Philips. Because of the total change of vendors of the MRI systems and the need for narrowing down the scope of this research, this research will focus on MRI and the corresponding process.
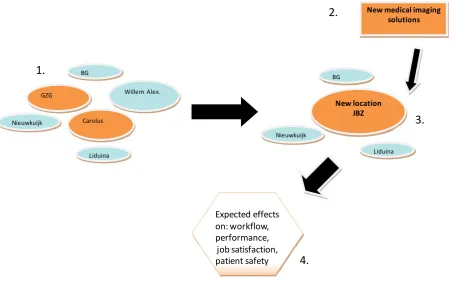
Figure 1 is a graphical presentation of the research scope. The orange objects are the areas of focus for this research. In the left part (1) the current situation is displayed, where the orange objects are the locations where MRI function is located. The large blue object is the Willem Alexander location which is closed. The smaller blue objects are the outpatient clinics of the hospital. There is no MRI service available in these clinics, but medical specialists in these clinics are able to request a MRI. The new situation will be in a new hospital building (3) and will use new medical imaging solutions (2). These changes will have effects on the MRI service of the JBZ (4).
Figure 1: Research scope
1.2 Problem identification
It is anticipated that by April 2011 the new Jeroen Bosch hospital should be treating its first patients. Before that time however, technology, people and processes should be installed as good as possible. Since 2007 management and staff of the different locations have merged into one team. In addition to that, the MRI processes have been standardized to enable job rotation between the two locations. The new medical imaging equipment (three new MRI systems Siemens Healthcare) will replace current equipment (two MRI systems from GE Healthcare, one from Philips). The result of this change in technology is that the users of the scanners have to deal with new user interfaces (software) and tasks. Questions in the radiology management team exist about how to prepare the users to continue or increase production. In addition, anxiety exists about losing retrieved knowledge or experience with the current MRI systems. The new equipment has influence on the workflow,
BG
Liduina GZG
Carolus
Willem Alex.
Nieuwkuijk
New location JBZ
New medical imaging solutions
Expected effects on: workflow, performance,
job satisfaction, patient safety
BG
Liduina Nieuwkuijk
2.
1.
3.
throughput, quality of diagnosis, job satisfaction and demand. The new MRI scanners will be used at the new location, and as a consequence the MRI workflow could be re-developed to eliminate inefficiencies. The new location should have an effective and efficient process, and should offer high-quality, patient-centered care. The design and planning for tactical and operational use has not been made yet.
In addition to uncertainty about the planned changes, current performance of the MRI service is lacking. The access time for outpatients is estimated at four weeks, production targets have not been met and the MRI service acts as a bottleneck in the entire care process.
With the new MRI systems situated at the new location, the management of radiology has the goal to increase efficiency and effectiveness to keep up with the described market developments. The planned changes give the opportunity to restructure the MRI process in order to improve the MRI service.
After interviews with stakeholders, we defined the problem statements. Because both Siemens Healthcare and the JBZ have their own issues we have presented the following statements:
Siemens Healthcare:
“How should we support our customers in making their processes more efficient and effective?”
The Jeroen Bosch Hospital:
“How should we design our MRI organization in order to improve the MRI service?”
1.3 Theoretic framework
After our description of the research scope and the specified problem area, relevant literature can be selected to give structure to our research (definitions, models and research approach). Theory is used from the field of “Management of Change” and “Operations Management”. In addition to structure, theory also gives the necessary tools for analysis and solution generation.
In the first part of this section, we combine several theories from the field of Management of Change and Organizational Behavior. The goal is to present an approach that improves adoption of restructuring the MRI organization and workflow. The second part of this section handles Operations Management concepts and leads towards our research model.
1.3.1 Management of Change
of it) in improving health care. Process theories refer to the preferred implementation activities: how they should be planned, organized, and scheduled in order to be effective (the organizational plan) and how the target group will utilize and be influenced by the activities (the utilization plan). The ideal model for change in health care would encompass both types of theories (Grol, Bosch, Hulscher, Eccles, & Wensing, 2007).
A consistent finding in literature on planned improvements in health care organizations is that change is difficult to achieve (Sachdeva, Williams, & Quigley, 2007; Grol, Bosch, Hulscher, Eccles, & Wensing, 2007; Grol & Wensing, 2004). A significant reason is the lack of understanding of incentives for, as well as barriers to change. These barriers are raised by the different actors that are involved in the MRI service. Therefore, it is also important to identify which groups in the hospital are important, and what their goals and incentives are. Given that the project aims at operational issues, only actors from the radiology department are included.
Freeman (1984) defines actors or stakeholders as:
“Any group or individual who can affect or is affected by the achievement of the organizations objectives”
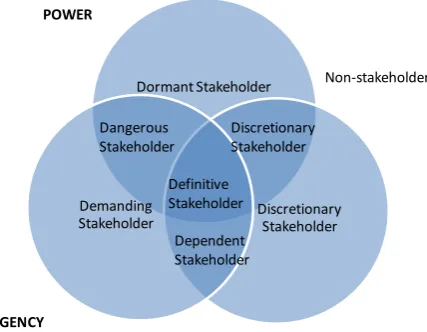
[image:14.595.191.405.405.571.2]Mitchell, Agle and Wood (1997) propose a theory on stakeholder identification to understand who and what really counts. They describe three attributes that can be used to classify stakeholders into eight different types (Figure 2).
Figure 2: Stakeholder classifications (Mitchell, Agle, & Wood, 1997)
When managers perceive that a stakeholder has all attributes (power, urgency and legitimacy), the stakeholder should have priority. It becomes increasingly difficult if stakeholders with the same priority have conflicting goals or interests. Other factors that could cause conflict situations are scarce resources, unclear job boundaries, communication breakdowns, personality clashes, power and status differences (Daft, 2003, 6th edition). Thomas (1992; 2008) developed an instrument in 1974 to help managers understand how different conflict styles affect personal and group dynamics. It measures five “conflict-handling modes” or ways of dealing with conflict: competing, collaborating, compromising, avoiding, and accommodating. These five modes can be described along two dimensions; assertiveness and cooperativeness. Assertiveness refers to the extent to which one tries
Dormant Stakeholder
Discretionary Stakeholder Demanding
Stakeholder
POWER
URGENCY
LEGITIMACY
Definitive Stakeholder Dangerous
Stakeholder
Discretionary Stakeholder
Non-stakeholder
to satisfy his or her own concerns. Cooperativeness refers to the extent to which one tries to satisfy the concerns of another person.
Figure 3: Conflict - handling modes (Thomas, 2008)
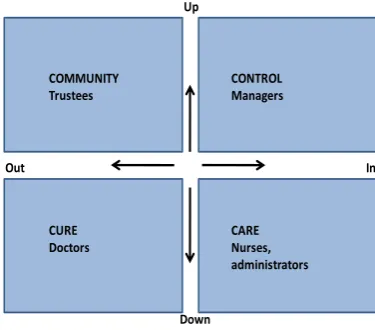
Typical for a hospital organization however, is the existence of departments, groups or individuals working in silos (Glouberman & Mintzberg, 2001a). The fragmented character of hospitals is caused by professional roles and organizational position. This fragmented character is strongly embedded in the culture of hospitals. Glouberman and Mintzberg (2001a; 2001b) published two articles concerning the question why hospitals are complex. They stated that the hospital organization consists of four worlds: community, control, cure and care (Figure 4).
Figure 4: The four worlds of the hospital (Glouberman & Mintzberg, 2001a)
These three theories or frameworks can be used to analyze, understand and solve barriers to change. Glouberman and Mintzberg argue that four worlds exists in hospitals, and results in all the aforementioned factors that could cause conflict. Using both the stakeholder identification theory from Mitchell and conflict handling modes of Thomas and Killman, actors concerning the MRI services should be informed, involved, and encouraged to make the change successful. The analysis
COMMUNITY Trustees
CONTROL Managers
CARE Nurses, administrators CURE
Doctors
In Up
Out
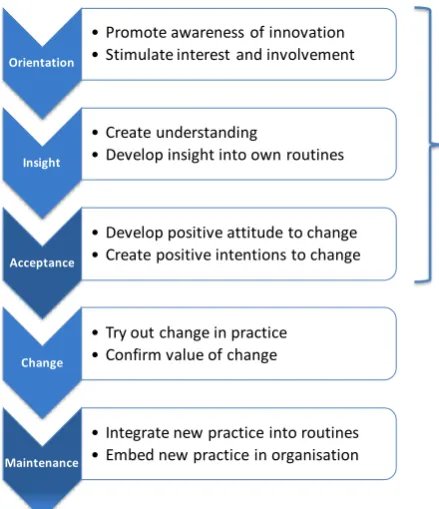
[image:15.595.194.382.474.639.2]combining stakeholder theory, conflict theory, and the ‘four worlds’ framework, should be the earlier mentioned utilization plan, on how the target group will utilize and be influenced by the activities. The process plan we will adopt in this thesis is described in the publication of Grol and Wensing (2004; 2007). Their 10-step model for inducing change in behavior is an integration of several stages-of-change theories (Figure 5). Whilst all ten stages are important, the first three stages are targeted in this research because of the timeframe of this research.
Figure 5: 10-step model for inducing change (Grol & Wensing, 2004)
1.3.2 Operations Management
Operations Management (OM) is a scientific approach to problem solving that encompasses the effective (doing the right thing) and efficient (doing things right) control of organizational processes (Wagner, 1970). The goal of OM is to facilitate managerial decision-making and enable organizations to solve problems and to find optimal solutions.
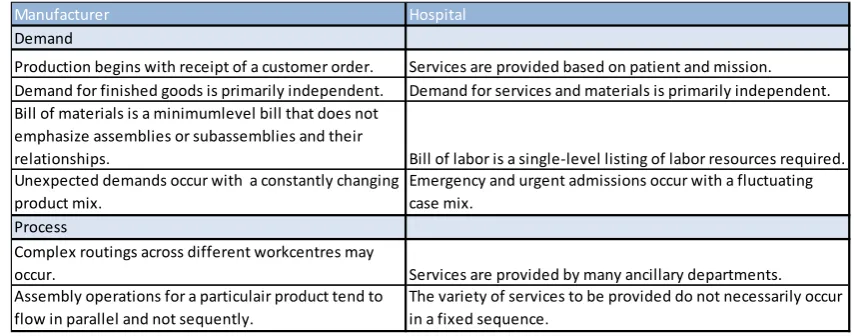
Organizations can be classified in manufacturing and service organizations (Daft, 2003). There are two main reasons for the differences between the two organizations. The first reason is that in service organizations the customer is involved in the actual production process. The seconds reason is that services, which are intangible, cannot be stored in a warehouse. Hospitals are a special kind of service organizations. In Table 1 the differences between hospitals and manufacturing organizations are summarized (Rhyne & Jupp, 1988).
Orientation
• Promote awareness of innovation • Stimulate interest and involvement
Insight
• Create understanding
• Develop insight into own routines
Acceptance
• Develop positive attitude to change • Create positive intentions to change
Change
• Try out change in practice • Confirm value of change
Maintenance
• Integrate new practice into routines • Embed new practice in organisation
Table 1: Comparison of manufacturing and hospital operations (Rhyne & Jupp, 1988)
Both service and manufacturing organizations have the aim to satisfy the needs of the customer. These aims or objectives can be translated in (performance) objectives (Slack, Chamber, & Johnston, 2004, 4th edition) and can be divided in the following categories:
Quality: Error-free processes
Speed: Fast throughput
Dependability: Reliable operation
Flexibility: Ability to change
Costs: High total productivity
These objectives should be prioritized using the operations strategy. A prioritization is required since organizations cannot perform equally well on all objectives (Skinner, 1974). On process level, other measures are used. Hopp & Spearman (2001, 2nd edition) described the behavior of production lines. They defined the following concepts:
Throughput: The average output of an production process
Capacity: An upper limit on the throughput of a production process
WIP: The inventory of between the first and last workstation of a production process
Cycle time: The time a part spends as WIP
Utilization: The fraction of time that a workstation is not idle for lack of parts
To meet customer demand and ensure delivery, capacity needs to be planned and controlled. The purpose of planning and control is to ensure that the operation’s processes run effective and efficient and produce products and services as required by customers (Slack, Chamber, & Johnston, 2004, 4th edition).
Planning and control activities are concerned with managing the ongoing activities of the operation so as to satisfy customer demand under constraints imposed by operations design (Slack, Chamber, & Johnston, 2004, 4th edition). It is about balancing demand and supply. Planning involves an estimation of what could happen at some time in the future. Because a plan is based on estimations, day-to-day operations changes occur. Control is about the process that copes with these changes.
Manufacturer Hospital
Demand
Production begins with receipt of a customer order. Services are provided based on patient and mission. Demand for finished goods is primarily independent. Demand for services and materials is primarily independent. Bill of materials is a minimumlevel bill that does not
emphasize assemblies or subassemblies and their
relationships. Bill of labor is a single-level listing of labor resources required. Unexpected demands occur with a constantly changing
product mix.
Emergency and urgent admissions occur with a fluctuating case mix.
Process
Complex routings across different workcentres may
occur. Services are provided by many ancillary departments. Assembly operations for a particulair product tend to
flow in parallel and not sequently.
According to Slack (2004, 4th edition), planning & control enhances four activities; loading, scheduling, sequencing, monitoring and control. Loading is about the amount of work that is allocated to a workstation or defining operating capacity. Sequencing is about the order in which jobs are handled and scheduling places the defined order in a timetable. The monitoring and control activity monitors the previous activities and acts on deviations from the plan.
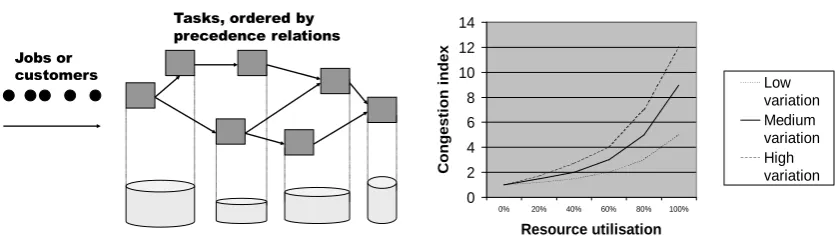
Figure 6: Relation between process and planning
It is important to understand the relationship between the process and planning. Jobs or customers are scheduled according to the different resources (Figure 6). The process time a resource needs, affects the total number of jobs a resource is able to process in a period of time. Variability of jobs has an effect on the flow and utilization of resources. High variability is harder to schedule and results in queues or inventory. When designing a process, the variability has to be accounted for.
1.3.3 Research model
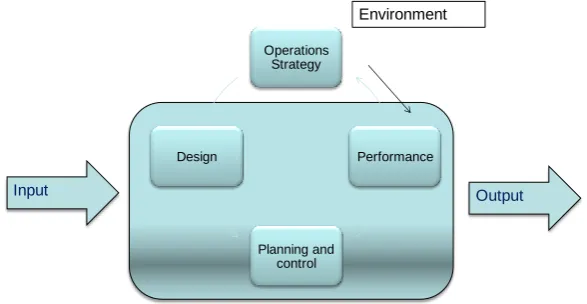
Slack (2004, 4th edition) offers the operation management model from an operations point of view. The model is derived from two parts: the transformation model and the activities of operations management. The transformation model is derived from the general Systems Theory and states that an “open system” receives various inputs, transforms these inputs and exports output (Kast & Rosenzweig, 1972). Our research scope focuses on the system “radiology department”, which acts as a service department to the hospital. According to Slack, input can be divided in input transforming resources and input transformed resources. Transforming resources are staff and facilities (e.g. medical imaging systems) and work on the input transformed resources. Transformed resources could be could be materials, information, and customers. Customers in health care are hard to define because in most industries customers make the purchasing decision and pay for the product or service. In healthcare the purchasing decision, service, and payment are separated (Lim, Tang, & Jackson, 1999). Lim, Tang and Jackson (1999) also state that the hospital is a multi-customer organization.
The transformation process consists of different activity areas or OM concepts. These concepts are:
Operations strategy
The design of operation’s products, services and processes.
Planning and control
Improvement
Tasks, ordered by precedence relations Jobs or
customers
Performance Curves for the System
0 2 4 6 8 10 12 14
Combining the transformation model with the OM concepts, we use Figure 7 as our basic model. Relevant theory about the different activities in operations management will be discussed in Chapter 2.
Figure 7: Basic research model
1.4 Research Goals and Questions
The goal of our research is to analyze the change of medical imaging solutions and the change to a new location from the Jeroen Bosch Hospital. The analysis should result in recommendations for Siemens and the JBZ.
In order to attain the project goals and solve the identified problems several steps are needed. The first step is to analyze the current situation and identify problems and bottlenecks. The resultant main research question is:
1. What are the characteristics of the current MRI process and what are areas for improvement?
The goal of the first part is to gain a deeper understanding of the current situation. Important aspects are the input for the process, the successive sub processes, the actors, and the output of the process. The second main research question takes the project outside the world of the JBZ. Literature research, expert interviews and a benchmark should provide input for the design of the new situation. Therefore, the second research question is:
2. What are the possible solutions for designing the new situation and what is best-practice in other hospitals?
Linking the two previous questions, we focus on the new location of the JBZ in the third part. As a result, the third research question is:
3. How should the MRI process on the new location be designed and what will be the expected effects?
The three research questions can be separated in a series of sub questions. These questions are constructed using the model of Slack, described in Section 1.3 of this chapter, and will be answered in their corresponding part of the thesis:
Operations Strategy
Design
Planning and control
Performance
Environment
Part 1: Current Situation
What is the operational strategy of the radiology department regarding MRI?
What are the characteristics from the input of the MRI process?
What are the successive sub processes after a RFI and how do people in this process interact with other people, technology and processes?
How is the planning & control function being performed?
What is the performance of the MRI process?
Part 2: Alternative solutions
2.1 What is best-practice in MRI in other Dutch hospitals?
2.2 How could manufacturing improvement theories be applied to improve the MRI service?
Part 3: New location
3.1 What are the differences between old and new MRI systems?
3.2 How should the MRI process on the new location be designed?
3.3 How should the planning & control function be performed?
3.4 Which steps should Siemens and the JBZ take to ensure a successful change?
3.5 What will be the expected effects?
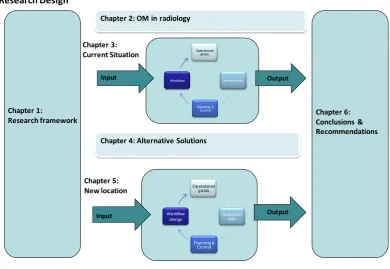
[image:20.595.105.496.368.637.2]Figure 8 represents a graphical display of the sub questions in the research model.
Figure 8: Research model
1.5 Methodology
In this last section of Chapter 1 we deal with the methods needed to answer the proposed questions from Section 1.4. The JBZ problem area is handled as a design problem. The proposed questions are the result of explorative research with the use of primary and secondary data research, explorative interviews and meetings. As showed in our research model (Figure 8), we have divided the analysis in three steps and four chapters.
Operational goals
performance
Planning & Control Workflow
Chapter 1:
Research framework
Input Output
Chapter 3: Current Situation
Operational goals
Actions to take
Planning & Control Workflow
design
Input Output
Chapter 5: New location
Chapter 4: Alternative Solutions
Research Design
Chapter 2: OM in radiology
The first step is about the current situation of the MRI service of the JBZ. The MRI service is available on two locations in Den Bosch, which both will be taken into account. We used observation, process mapping, data analysis, and interviews.
Observation
During the entire project period, observation is done to understand all the actions needed in the entire MRI process and to involve actors in the project. To minimize our effect on employees’ behavior, we do not plan our observations. To validate our results we use the interactions with actors during the observations.
Process mapping
To create our process map, we used general flow chart symbols using the software MS Visio. After the initial observations, we created the first version. This version is continuously changed in order to ensure that all actors agreed on the final version of the process map. We used Value Stream Mapping theory to represent the current situation.
Data collection
We gathered data from the information systems of the hospital. Information systems exist in different levels of the organization and gather data from different sources. We derive our primary data from the radiology information system (RADOS). We chose to use all the MRI data per exam from 2009. It was anticipated that the total number of cases (12,788) should offer a robust presentation of the MRI process. According to different actors from JBZ, the demand (and thereby the production) is not heavily influenced by seasonal characteristics. An exemption is the high access times caused by days off in December. To validate the data, we used data from Cognos (the hospital information system). In our analysis, we found that the data from Cognos showed a higher number of performed scans. This difference is caused by the existence of double examinations in RADOS. In our calculations we use the exams from RADOS (N=12,778).
The combination of the process map and the availability of time stamps of the different steps in the process caused the need for additional data collection. This data collection was conducted for two weeks by the receptionists to capture the delay caused by screening the requests for MRI services. Receptionist noted the time, date, patient number and the requesting department on paper.
Interviews
To capture the operational strategy on MRI and to create an understanding of the demand from the hospital and the role and activities of the radiologists, semi-structured interviews were conducted. These interviews were recorded using a digital sound recorder.
The second research question is about alternative solutions. We used two methods to generate possible alternatives to organize the MRI service.
Benchmark
First, we conducted a benchmark. We used four non-academic general hospitals located in different areas of the Netherlands. For all benchmark partners, we used the same approach:
A start-up interview to inform on objectives and methods.
A questionnaire to capture quantitative data (see Annex 8).
The second semi-structured interview focused on problems, processes and planning.
We presented our findings in a dynamic presentation and used the availability of MRI workflow professionals to quantify the differences between hospitals. In the second part of Chapter 4 we apply theories, which are proven in manufacturing, to generate alternative solutions.
[image:22.595.104.496.216.433.2]The third part of the analysis combines the first two parts to design the new location’s process and planning & control function. In this part we also describe priorities for the implementation process using the literature on change from Chapter 1.
Figure 9: Research methodology
Change
This graduation project took place in a period where all actors in radiology knew that significant changes were about to occur (new location and new medical imaging systems), and as a result of these anticipated changes uncertainty existed. However, planning and preparation for the large changes is conducted by either people who are not involved in operational processes or people from outside the hospital. During all stages of this graduation project we have tried to interest, inform and involve actors in the MRI workflow.
This research combines quantitative and qualitative research, which also increases acceptance and sustained organizational change (Sachdeva, Williams, & Quigley, 2007).
Part 1: Current Situation
Theory Methods Objectives
Operations Management Process Mapping Proces map
Data analysis Identification bottleneck Interviews Capture operations strategy Change management Communicate with actors Create understanding for change
Part 2: Alternative Solutions
Theory Methods Objectives
Improvement theories literature research How to improve current situation Benchmark Benchmark identify best practice
Change Management Communicate with actors Involvement with solutions
Decision making Select design
Part 3: New Location
Theory Methods Objectives
Operations Management Design process
Improvement theories Combine part 1 & 2 Design planning & Control
Factory planning Implementation plan
Change management Data analysis Estimate effects
Change
Chapter 2 – OM in radiology
In Section 1.3 a theoretic framework was constructed combining Operations Management (OM) with Change Management. To analyze the current situation and identify areas for improvement, a thorough understanding is needed of the individual OM activities. Therefore, in this chapter we will focus on the OM activities as defined in Section 1.3.
Section 2.1 deals with the operational strategy. In Section 2.2 the input of the MRI system is described. By ‘system’ we mean the entire MRI process, the planning & control function, people and decision making. Our definition of the MRI system results from the model displayed in Figure 7 in Chapter 1 (page 19). Section 2.3 presents literature on the design, planning & control and improvement functions. After the described relevant theory on the transformation process, we focus in Section 2.4 on the output of the MRI system.
2.1 Operations Strategy
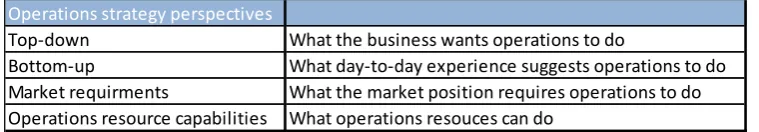
[image:23.595.111.491.354.420.2]Operations strategy concerns the pattern of strategic decisions and actions which set the role, objectives and activities of the operation (Slack, Chamber, & Johnston, 2004, 4th edition). The operations strategy is a part of the total strategy and can be divided into four perspectives. These perspectives all have their influences on the operations strategy (Table 2).
Table 2: Operations strategy perspectives
The top-down perspective is about what and who the company would like to be. At the corporate level, mission, vision and goals are defined and are translated into strategic plans. A part of the strategic plan is about operations. At the business-unit level these strategic plans are translated in functional objectives, where the role and contribution to the overall strategy is defined.
An alternative to the top-down perspective is the bottom up perspective. Operational, day-to-day experiences provide input for the strategic plans. This notion of strategy being shaped by operational level experiences is also called emergent strategy (Slack, Chamber, & Johnston, 2004, 4th edition). A third perspective is the focus on market requirements. It is therefore necessary to understand the market requirements and the right mix and level of performance objectives. As described in Section 1.3, the performance objectives are:
Quality: Error-free processes
Speed: Fast throughput
Dependability: Reliable operation
Flexibility: Ability to change
Costs: High total productivity
The relative priority of these performance objectives is influenced by the stakeholders and their ability to influence. The key stakeholders in radiology according to Boland (2006) are referring
Operations strategy perspectives
Top-down What the business wants operations to do
physicians, patients, hospital administration and radiologists. Boland describes five key expectations for radiologists:
1. Patient access to imaging 2. Customer service
3. Expedited report turnaround and image availability 4. Quality of the readings
5. An understanding of the business of the radiology
It is important to note that Boland does not mention radiographers (in literature also known as (radiological) technologists) as being a key stakeholder. This could be because of differences in radiology practice between the Netherlands and the US. Since radiographers are essential in the radiology workflow, we argue that their expectations towards radiologists should be assessed. The fourth possible objective is the operations resources perspective and is based on the resource-based view (RBV). The RBV states that organizations with a good strategic performance are likely to have gained their sustainable competitive advantage because of the core-competences (or capabilities) of their resources.
2.2 Input
The second part in this chapter is focused on the input of the MRI process. As described in Section 1.3, inputs of the process can be divided in transformed and transforming resources. Transforming resources are acting upon/with the patients and information. In a radiology department these are specialized technology and highly educated staff, who are (partly) responsible for the diagnostic outcomes.
Slack (2004) states that materials, information and customers are transformed resources and that usually one of these categories is dominant in operations. In case of a radiology department, patients /customers are the objects that undergo the diagnostic process and will be described in Section 2.3.4. Less dominant, but still important is the information that is received and starts the process. The information is described in Section 2.3.3.
2.2.1 Technology
Radiology is a medical specialty that uses medical imaging technologies to diagnose and in some instances treats diseases. Radiology is heavily dependent on technological resources. Due to technological advancements, radiology is now frequently used as the primary diagnostic tool. The radiology department traditionally facilitates diagnostic capabilities not present in other parts of the hospital. This is mainly based on the facts that modalities represent a large investment and that the interpretation of the images requires specialized knowledge (Postema, 2007). A radiology department could posses the following modalities: general X-ray, Ultra Sound (US), Computed Tomography (CT) and Magnetic Resonance Imaging and works closely together with the discipline Nuclear Medicine.
useful in neurological, musculoskeletal, cardiovascular and oncological imaging. In few MRI examinations foreign contrast media are required into the body.
Safety and risks
MRI does not use ionizing radiation (x-rays). Instead, MRI uses a strong magnetic field and RF frequencies. There is no scientific proof of negative effects for the human body (Kane, 2003; Softways Medical Imaging Group, 2010). However, because of RF frequencies body temperature can slightly rise (regulations state max 1⁰ C) because of absorption of the RF energy. In addition to the rise of body temperature, the magnetic field can attract ferromagnetic objects (e.g. iron objects) with enormous force. This is known as the missile effect and could cause seriously injure people in or around the MRI and damage the hardware (Kane, 2003). Patients who go into the MRI room should remove everything that contains ferromagnetic materials. Also implants (e.g a pacemaker) could be damaged by the magnetic field; so patients who have active implants or ferromagnetic materials in specific parts of the body (e.g. the eyes) are not permitted to go into the MRI room.
Technological & medical developments
Medical and technological developments go hand in hand. MRI technology developments result in higher field strengths that provide a better signal to noise ratio (resolution) and faster image acquisition. Current MRI systems with low field strengths (0,3T – 1,0T), will be replaced by 1,5 or 3,0T MRI systems . Higher field strengths result in a possible restriction of the amount of energy absorbed by the body (SAR). The doubling of the field strength from 1,5T to 3,0T leads to a quadrupling of SAR. The technological developments result in new MRI applications like examinations of the heart and dynamic MRI (known as fMRI). The more advanced applications require more knowledge from both radiographers as radiologists and leads to longer examination times.
Given that hospitals show an increasing focus on efficiency, developments are also aimed at workflow and support through automated solutions. Due to the fact that MRI applications are growing and no ionizing radiation is used, demand is for MRI service is growing. Examples of future developments are interventional MRIs and the combination of MRI with PET. MRI examinations that currently are only provided in specialized academic hospitals will become available more broadly.
2.2.2 Staff
Since a radiology department is a service department, people are important assets. People can be categorized according to their characteristics as training and experiences, objectives and organizational position.
We have already discussed the model of Glauberman and Mintzberg indicating the existence of different worlds in hospitals. Inside these groups however, differences also exist. According to Salancik and Pfeffer (1978), job attitude and motivation could be explained by the fact that people have needs (authority, respect, reimbursement) and jobs have characteristics (tasks, organizational position). Salancik and Pfeffer argue however, that also social influences should be addressed.
2.2.3 Information
efficiency gains due to the widespread adoption of filmless radiology systems, electronic radiology reporting systems and speech recognition (Halsted & Froehle, 2008). Entire functions have disappeared in the radiology due to filmless practices. Most of the information technology improvements are focused on the primary activities after the examinations have been conducted. Workflow gains and error minimization in the information input and communication with other department seem to be the next steps (supporting processes).
In 2004 a benchmark was conducted to compare process parameters, like cycle time and process cost for staff, with implemented IT systems (Weseloh, Reiff, & Braitinger, 2004). The IT systems compared are PACS (Picture Archiving and Communications System), RIS (Radiology Information System), HIS (Hospital Information System) and technological specifics as the use of electronic image distribution, tele-radiology and speech recognition. Best practice for handling the imaging request was achieved with a combination of an electronic request with mandatory fields to be filled out, so that no or minimum time was needed for the clarification process between the parties. The other institutes suffered illegible referral slips and missing information, leading to avoidable communication steps and information exchange iterations. Best results in the reporting phase are achieved using speech recognition software in combination with self-correction. (Weseloh, Reiff, & Braitinger, 2004)
2.2.4 Patients
Patients are the main reason for the existence of hospitals. In the first part of the entire care path, a diagnosis should be made. In addition to a diagnosis, patients can be referred to radiology after surgery/treatment to check the healing process and for interventional radiology.
Patients can originate from inside or outside the hospital and can be grouped into three main categories:
Outpatients
Inpatients
Emergency patients
These categories all have distinct demand characteristics (Green, Savin, & Wang, 2006). Outpatient appointments are typically scheduled days or weeks in advance and sometimes result in no-shows. Inpatient demand is usually generated the same day as needed and emergency patients must be serviced as soon as possible following the emergency doctor’s request. Another possible difference between patients can be their mobility. This has logistical impact because of the extra actions needed to transfer usually inpatients from the hospital bed onto the MRI table (this cannot happen inside the MRI room because of the magnetic field).
2.3 Transformation
2.3.1 Design
Design in operations management is a very broad term that enhances activities at the strategic as well as at the operational level. At the strategic level, process design means designing the supply network of operations that deliver products and services to customers. At a more operational level, process design is concerned with the physical arrangement of the operation’s facilities, technology and people (Slack, Chamber, & Johnston, 2004, 4th edition). Given that this project has an operational focus, we will not go into strategic aspects of design.
Process Design
The layout of an operation is concerned with the physical location of its transforming resources and it determines the flow of the transformed resources. The transformed resources are described in Section 2.3 and are the patients and corresponding information.
Many authors have published on process improvement or process redesign, but little is written about how to design a new health care process or facility that optimizes capabilities of technological advancements (Thrall, 2005). A critical goal in building the facilities that house expensive high-technology equipment is to design the space and workflow so that high-cost procedure rooms are not used for patient preparation and post procedure recovery steps, as is common in current practice. Architectural design must support work process efficiency and productivity. Another example is the minimization of background noise in areas where voice recognition systems are used (Thrall, 2005).
As described in Chapter 1, variability of jobs has an effect on the flow and utilization of resources. Imaging patients have a wide array of diseases as well as differences in severity and diagnostic alternatives for the same disease (clinical variability). In addition, there is a random scheduling of appointments in radiology departments (flow variability). Furthemore, among health professionals and health providers, there is variability on the techniques requested (professional variability). Thus, the proper identification of variability is crucial in the efficient operation of a radiology department (Ondategui-Parra, et al., 2004). Variability has negative effects on delays and queues, working conditions and clinical outcomes (Villa, Barbieri, & Lega, 2009).
Job Design
The hospital organization is a service organization where human resources are very important. In radiology, technological resources usually have priority, but the question below is very important:
“Who does what and why?”
Job design is about how we structure each individual’s job, the workplace they work in and their interface with the technology they use (Slack, Chamber, & Johnston, 2004, 4th edition). Many elements of job design are about practical arrangements (workplace and safety issues). However, more interesting for this project are the decisions of which tasks to allocate to certain staff and how many people are needed for completing the tasks.
2.3.2 Planning & Control
“Establish an appointment schedule for outpatients and design a system of dynamic priority rules for admitting patients in real time”
Appointment scheduling consists of determining the duration, number, and timing of examination slots for a particular day (Green, Savin, & Wang, 2006). This task may be further complicated by outpatient cancellations and “no-shows.” Dynamic priority rules provide real-time control of access to the facility.
The decisions on planning and control could affect different aspects of the performance. An important decision is about the balance between the objectives of low costs versus low access times. Capacity levels in excess of demand mean under-utilization and thereby higher costs per unit, but also shorter access times (Slack, Chamber, & Johnston, 2004, 4th edition; Hopp & Spearman, 2001). This conflict in demand is typical for hospitals because of the complexity of the hospital organization (Houdenhoven, Wullink, Hans, & Kazemier, 2007). Elkhuizen et al. (2007) have proven that it is possible to improve utilization and lower access times.
There exists an important question on capacity. Is the lack of capacity to meet patient demand the major reason why patients wait? In the article of Silvester, Lendon, Bevan et al. (2004)they state that capacity is rarely the problem. In their research they have examined four hypotheses on the reason of the existence of waiting lists:
1. H1: Demand is greater than capacity
2. H2: There is a fundamental mismatch between the variation in demand and the variation in capacity.
3. H3: We have queues to keep the use of expensive resources at 100% in the belief that use (or occupancy) is related to productivity (output/working hours) and efficiency.
4. H4: Having a queue discourages people from using scarce resources.
Figure 10: Relation demand, capacity and queue
Long access times (or queues) are used in the expectation that some non-urgent patients recover or go elsewhere. Urgent or inpatients are usually treated using specific slots in the planning. This is known as carving-out or ring-fencing capacity; this results in making the overall waiting time for patients worse (Silvester, Lendon, Bevan, & al, 2004).
2.3.3 Improvements
In today’s hospital environment, with rising imaging costs, growing demand and the shift towards a central role in clinical practice, OM can help radiology managers to solve their problems and achieve their goals. Radiology managers, who are usually inexperienced with process management and redesign systems, may resolve their problems in their departments by using ineffective strategies (Ondategui-Parra, et al., 2004). Examples of inefficient strategies include adding information systems and medical equipment to the existing systems and implementing higher performance standards and holding employees responsible.
Ondategui-Parra et al. (2004) also state that simply building on an existing system of suboptimal work does not lead to an improvement in performance. It is only through a systematic change in the way departments operate, with involvement of all stakeholders and informed by the demands of patients and referring physicians, that higher levels of performance can be attained. The main concentration areas should be managing the bottleneck and reducing the variation to create a smooth flow through the organization (Silvester, Lendon, Bevan et al, 2004).
Silvester, Lendon, Bevan et al. (2004) describe that NHS teams all work using a well-understood process improvement approach. The key steps are as follows:
Understand the system:
o Understand the demand and capacity of the system at a macro level and the impact that different flows have on each other (e.g. variation in emergency and elective admissions)
o Map the patients’ journeys through the clinical processes
Simplify the processes
Control the variation
o Identify patients with similar flow characteristics and separate these flows where appropriate (segmentation)
Reduce the variation
o Measure the demand and capacity continuously over time
o Understand the causes of variation that affect the demand and capacity of the system
Make the system safe for patients and staff
o Set the capacity appropriately to account for the variations and minimize the delay for all patients
Improvement methods
[image:30.595.129.469.361.465.2]The described NHS improvement steps are derived from proven applications in manufacturing (Silvester, Lendon, Bevan, & al, 2004). Learning from similar methods to deliver higher quality health care at lower costs would be extremely valuable, but we must also consider the patient’s experience (Young et al, 2004). Three main process improvement theories have often been discussed in literature, but their value in health is debated. These theories all have their specific focus and methods (Table 3) (Nave, 2002).
Table 3: Improvement theories (Nave, 2002)
Lean thinking started with Toyota in the 1950s and was developed by Womack and Jones. It seeks to provide what the customer wants, quickly, efficiently and with little waste (Young et al, 2004; Nave, 2002). Applying Lean in healthcare should minimize delay, repeated visits, errors, and inappropriate procedures. An important tool is Value Stream Mapping. A value stream is all the actions currently required to bring a product through the main flow essential to every product (Rother & Shook, 2003). Once value adding activities are identified, improvement efforts are directed towards making activities flow. Major inhibitors of flow are work in queue, batch processing, and transportation. These are all relevant factors in a hospital. However, difficulties start with identifying value; which is defined as ‘how the specific product (or service) meets the customer’s needs, at a specific price and time’. The customer seems to be a clear concept, but as discussed in Chapter 2, there is not one single customer involved. Both Radnor and Boaden (2008) as Benders and Santbergen (2007) report that many hospitals use some tools or techniques related to the lean concept, however hospitals do not incorporate all aspects of lean thinking.
There are some challenges which still face the implementation of lean thinking in the public sector and which to date still have not been fully addressed including (Radnor & Boaden, 2008):
Improvement Theories
Theory Six Sigma Lean thinking Theory of constraints
goal Reduce variation Remove waist Manage constraints
Application 1 Define 1 Identify value 1 Identify constraint
guidelines 2 Measure 2 Identify value stream 2 Exploit constraint
3 Analyze 3 Flow 3 Subordinate processes
4 Improve 4 Pull 4 Elevate constraint
5 Control 5 Perfection 5 Repeat cycle