Abstract—This paper describes an application of data mining
techniques to study certain aspects of tea industry in Sri Lanka using different types of data available. This study showed that exports and production continuously increase with time. It further revealed how production vary with the three elevations they are grown, namely, High, Low and Mid. Time series analysis produced ART(p) models for production and price. The study resulted in significant insights and knowledge about the tea industry which contributes significantly to the Sri Lankan economy.
Index Terms—Data mining, cluster analysis, time series
analysis
I. INTRODUCTION
Data mining (DM) is a powerful new technology to analyze information in large databases and extract hidden predictive information from them. There is a growing interest to use this new technology to convert large passive databases into useful actionable information. The advantage of data mining techniques is that they can be used to explore massive volumes of data automatically unlike queries posed by a human analyst.
The process of data mining consists of three stages: (i) the initial exploration, (ii) model building or pattern identification and (iii) deployment [8]. The initial exploration usually starts with data preparation which may involve cleaning data, data transformations, selecting subsets of records and - in case of data sets with large numbers of variables - performing some preliminary feature selection operations to bring the number of variables to a manageable range. Data Mining lends techniques from many different disciplines such as databases ([9], [13], [15], [16], [18], [24], and others), statistics [12], Machine Learning/Pattern Recognition [5], and Visualization [14].
The aim of this study is to investigate how data mining techniques can be used to find relationships among factors such as production, export and auction price of tea. It is possible to obtain comparatively large sets of data on tea exports from different sources, namely, Sri Lanka Tea Board Manuscript received December 30, 2007
H. C. Fernando (corresponding author to provide phone: +94-11-230-1904; fax: +94-11-230-1906; e-mail: [email protected])., and W. M. R Tissera are with the Sri Lanka Institute of Information Technology, Level #16, BOC Merchant Tower, St. Micheals Road, Colombo 03. Sri Lanka.. (e-mail: [email protected])
R. I. Athauda is with the Faculty of Science and Information Technology, School of Design, Communication and Information Technology, The University of Newcastle, NSW 2308. Australia. (e-mail: [email protected])
(SLTB) [4], Central Bank of Sri Lanka [1], [3], Sri Lanka Customs [23] and Department of Census and Statistics [6]. The data of this study was provided by SLTB. We hope that the identified patterns in this study would help to make policy decisions in improving tea production and exports, which contributes significantly to the national economy of Sri Lanka.
II. METHODOLOGY
The initial exploration started with preparing data to be comparable with respect to currency. The currency of the auction prices is recorded in Sri Lanka Rupee (LKR). Due to the fluctuations of the exchange rates and currency depreciation, comparable price in USD was calculated as follows:
USD in rate exchange average
Monthly
kg per LKR in price auction average monthly
Actual
_ _ _ _
_
_ _ _ _ _ _ _
_
Monthly average exchange rates [2] were used to perform this transformation. As there were only a few variables, reduction of the dimension of the data was not necessary. It was essential to select data for the same period of time for a given variable. Preliminary analysis was carried out as the next step of initial exploration using SPSS [20].
Microsoft SQL Sever [19], [21], [26] is a powerful Database Management Systems (DBMS) that offers different DM algorithms and techniques and is user friendly. Therefore, we selected Microsoft SQL Server 2005 due to its DBMS capabilities and DM algorithms [19], [26].
A. Clustering
Cluster analysis is a branch of statistics that has been successfully applied to many applications. Its main goal is to identify clusters present in the data. There are two main approaches to clustering, namely, hierarchical clustering and partitioning clustering. The Microsoft clustering algorithm,
k-means [10], is a partitioning algorithm which creates
partitions of a database of N objects into a set of k clusters. It minimizes total intra-cluster variance, or, the squared error function (V)
2
1
∑ ∑
= ∈
− = k
i x S
i j
i j
x
V μ
where, there are k clusters Si ,
i
=
1
,
2
,...,
k
and µi is thecentroid or mean point of all the points
x
i∈
S
i.Monthly data was available for production and prices but
Gaining Insights to the Tea Industry of Sri Lanka
using Data Mining
not for exports in our data set. Therefore, cluster analysis was possible only for the three variables: time, price and production for the three types of tea.
B. Time series analysis
The trends of the variables with time (monthly or yearly) were analyzed using time series analysis. SQL Server provides the facility to perform time series analysis using Autoregressive tree model (ART) [17]. An ART is a piecewise linear autoregressive model in which the boundaries are defined by a decision tree and leaves of the decision tree contain linear autoregressive models. An ART(p) model is an ART model in which each leaf of the decision tree contains AR(p) model, and the split variables for the decision tree are chosen from among the previous p
variables in the time series. ART(p) models are more powerful than AR models because they can model non-linear relationships in time series data [25]. ART models are particularly suitable for data mining because of the computationally efficient methods available for learning from data. Also, the resulting models yield accurate forecasts and are easily interpretable.
ART (p) model is given by:
i i p j i j t ij i L i i t p t t i L i t p t
ty y f y y y Nm by
y f Φ = − = Φ − − = − − =∏ =∏ +
∑
1 2 1 1 11, ) ( ,..., , ) ( , )
,...,
( θ θ σ
where L is the number of leaves, θ=(θ1,...,θL) , and
) , ,..., ,
( 2
1 ip i
i i
i m b b σ
θ = , are the model parameters for the linear regression at leaf
l
i,i
=
1
,...,
L
.The experiment is carried out for three different data sets.
Data set I: Annual export and production of tea from 1911 to 2006.
Data set II. Monthly production according to the elevation from 1986 to 2006.
Data set IIIMonthly auction prices according to the
elevation from 1986 to 2006.
III. RESULTS
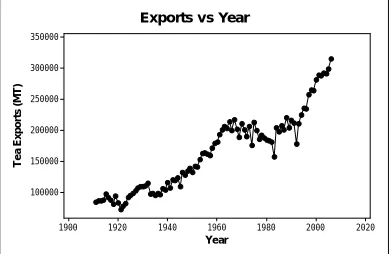
Data set I contains annual figures of export and production of tea (in metric tons) of any elevation. Fig. 1 shows a continuous progress in production with time. The same relationship was found for exports and time too (see Fig. 2). It is important to observe that we have exported more than the production in some instances (see Fig. 3). This was possible because tea was imported to blend with Ceylon tea, thereby adding more tea to the production of Sri Lanka (e.g. In 2006, export as a percentage of production was 102%). We have been able to export any amount we produced so far (see Fig. 6).
Data set II contains how the average production of a particular month for a period of 20 years is distributed (see Fig. 4 and Fig. 5) among the three elevations they are grown, namely, High, Low and Mid [23]. Low grown tea is produced at 1500-1800 feet. Mid-grown tea is from heights between 1800-3500 feet. High grown tea is produced at the height of 3500 to 7500 feet. Low grown tea contributes to almost half of the production (see Fig. 4). Mid grown tea production is
the least throughout the year (see Fig. 5).
Ye a r
Te a P rod uc ti o n ( M T) 2020 2000 1980 1960 1940 1920 1900 350000 300000 250000 200000 150000 100000
[image:2.612.326.530.74.201.2]Production v s Y e ar
Figure 1. Production by year
Year T e a E x po rt s ( M T ) 2020 2000 1980 1960 1940 1920 1900 350000 300000 250000 200000 150000 100000
[image:2.612.333.529.256.383.2]Exports vs Year
Figure 2. Exports by year
75 80 85 90 95 100 105
1977 1979 1981 1983 1985 1987 1989 1991 1993199519971999200120032005
Year %
Figure 3. Export as a percentage of production by year
51%
20% 29%
Low grown tea
Mid grown tea
High grown tea
A. Regression of exports on production
Data set I consists of yearly exports and production of tea from 1911 (see Fig. 1 and Fig. 2). Fig. 1 shows a continuous progress in exports with time. The same relationship was found for production and time too. This indicates that exports and production follows the same pattern with time. It is shown that the more tea is produced, more can be exported (see Fig. 3). Since the scatter plot showed a strong linear correlation (r =0.993) between these two variables, a simple linear regression was fitted (export = 6625 + 0.914*production; R2=0.98). Fig. 6 shows how well the regression line fits the data. It shows a positive trend, which amounts to an increase of 914,000 kg per year for exports of tea, further justifying our earlier comments.
Data set III contains monthly auction prices according to the elevation of tea (see Fig. 7). On average, the price of low grown tea stands above that of the other types. However, prices of all three types decrease in the period of June-July. It is important to note that the price is not governed by mere production. The simple linear regressions explain almost nothing of the variation in price in all three types of tea (Low: R-Sq = 7.8%, Mid: R-Sq = 1.8% and High: R-Sq = 0.2%). This indicates that the auction price is independent of the amount of production.
B. Cluster analysis for production and price
This section presents the results of cluster analysis using
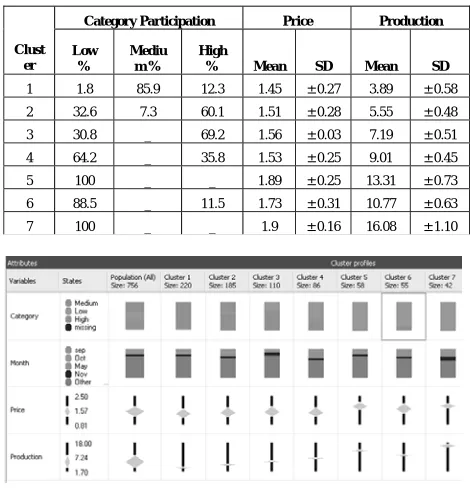
K-means algorithm [19], [26] available in Microsoft SQL Server 2005. This analysis was performed only for monthly production and prices. Since, monthly data was not available for exports, it was excluded from cluster analysis. We were able to obtain seven clusters as presented in Fig. 8 and Table I. It is important to note that low grown tea forms two distinct clusters: cluster 5 and 7. The constitution of cluster 7, which gives the highest average production, is 100% low grown tea. The other cluster, which consists of 100% low grown tea, namely, cluster 5, gives second highest average production. The third highest average production is found in cluster 6, which consists of 88.5% of low grown tea, and the balance is high grown tea. It can be concluded that low grown tea is the main contributor to the production. The pattern in clustering of price is the same as of production. That is, the highest average price is found in cluster 7, followed by cluster 5 and cluster 6. Therefore, the most significant contributor to the price of tea is low grown tea.
0.00 2.00 4.00 6.00 8.00 10.00 12.00 14.00
M o nt h
[image:3.612.329.538.70.146.2]L-aver age M-aver age H-aver age
Figure 5. Average tea production by elevation
production (MT)
E
x
p
o
rts
(M
T
)
350000 300000 250000 200000 150000 100000 350000
300000
250000
200000
150000
100000
Exports vs production
Figure 6. Regression graph between exports and production of tea
0.00 0.50 1.00 1.50 2.00
Jan Feb Mar Apr May Jun Jul Aug Sep Oct Nov Dec
Month
Compa
rabl
e
Avg.
T
e
a
Pr
ic
es L
[image:3.612.87.282.81.169.2]M H
Figure 7. Average price distribution by elevation
Table I . Distribution of Mean and Standard Deviation by cluster
Category Participation Price Production
Clust er
Low %
Mediu m %
High
% Mean SD Mean SD
1 1.8 85.9 12.3 1.45 ± 0.27 3.89 ± 0.58 2 32.6 7.3 60.1 1.51 ± 0.28 5.55 ± 0.48 3 30.8 _ 69.2 1.56 ± 0.03 7.19 ± 0.51 4 64.2 _ 35.8 1.53 ± 0.25 9.01 ± 0.45 5 100 _ _ 1.89 ± 0.25 13.31 ± 0.73 6 88.5 _ 11.5 1.73 ± 0.31 10.77 ± 0.63 7 100 _ _ 1.9 ± 0.16 16.08 ± 1.10
[image:3.612.78.294.373.514.2] [image:3.612.307.542.427.671.2]C. Time series analysis for export and production
It is important to know the trend for production and export so that the recent future can be predicted. One of the data mining techniques, time series [25] was used to identify the trend of exports and production. For this analysis time frame was fixed from 1977, in which year open economy was introduced to the country. After introducing the open economy the exports have increased considerably.
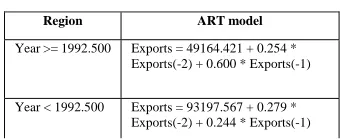
In order to fit a time series model for the trend found in exports the following ART model was calculated (Table II). The decision tree produces two distinct nodes. One node represents period before mid 1992 and the other node represents period after mid 1992 (see Fig. 9).
[image:4.612.317.536.60.125.2]
The two time series model for the two periods mentioned above is given in Table II. They both show that the export figure for a given month only depends on export figures of the previous two months. Also, exports are continuously increasing with time. The time series model predicts a continuous growth in exports (i.e. coefficients are positive) (see Table II).
In order to fit a time series model for the trend found in production, the following ART model was calculated (see Table III). The decision tree produces two distinct nodes (see Fig. 11).
One node represents period before 1993 and the other node represents period after 1993 (see Fig. 10).
The two time series models for the two regions show that the production figure for a given month only depends on production figures of the previous three months (see Table III). Also, production is continuously increasing with time. The time series model predicts a continuous growth in production but slow.
In order to investigate how the exports and production predicted to vary by the two time series model, Fig. 11 was constructed. This graph uses the data calculated by the two time series models. The gap between export and production is predicted to exist in future too. This shows that the production doesn’t meet the continuous increase in the export adequately (see Fig. 11).
D. Time series analysis for Prices
This analysis was carried out separately for the three types of tea. As low-grown tea is the highest contributor, we started this analysis with low grown tea. The decision tree for this model had only the root node, hence one leaf (see Fig. 12). Therefore, the linear autoregressive model needs to be calculated only for one region and is presented in Table IV. This model shows a positive trend in price of low grown tea, which only depends on the price of the previous month
The decision tree for mid-grown tree also has only the root node, hence one leaf (see Fig. 13). Therefore, the linear autoregressive model needs to be calculated only for one region and is presented in Table V. This model shows a positive trend in price of mid grown tea, which only depends on the price of the previous two months.
[image:4.612.78.268.212.280.2]Figure 9. Decision Tree of ART model of annual exports
Table II. ART model for annual exports
Region ART model
Year >= 1992.500 Exports = 49164.421 + 0.254 * Exports(-2) + 0.600 * Exports(-1)
Year < 1992.500 Exports = 93197.567 + 0.279 * Exports(-2) + 0.244 * Exports(-1)
[image:4.612.328.539.240.344.2]Figure 10. Decision Tree of ART model of annual production
Table III. ART model for production
Region ART model
Year >= 1993 Production = 73215.369 + 0.166 * Production(-3) + 0.232 * Production(-2) + 0.379 * Production(-1)
Year < 1993 Production = 99579.595 + 0.629 * Production(-3) + 0.049 * Production(-1) -0.149 * Production(-2)
290000 300000 310000 320000 330000 340000
2007 2010 2013 2016 2019 2022 Year
Q
u
a
n
ti
ty
(
M
T
)
Exports
Production
Figure 11. Prediction using ART model
Figure 12. Decision Tree of ART model for prices of
Low-grown tea
Table IV. ART model for price of low grown tea
Region AR model
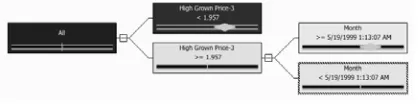
[image:4.612.98.272.402.472.2] [image:4.612.350.488.505.544.2] [image:4.612.74.290.545.619.2]The decision tree for high-grown tree produced three regions (see Fig. 14). The piecewise linear autoregressive model was calculated for three regions and is presented in Table VI. This model revealed that the price of high grown tea is constant at present.
IV. CONCLUSION
This section discusses a study carried out with some data related to the Sri Lankan tea industry. Sri Lanka considers export of tea as a lucrative business. Understanding the different parameters such as production, costs, prices, and others can assist in growth, development and higher profitability in this sector.
As discussed, the strong correlation between production and exports makes us to believe that the tea production is the only aspect governing tea exports. Ninety eight per cent of the variation in exports is explained by production. This is further proven by the fact that the auction price has little/no correlation over exports of all types of tea.
As shown in Fig. 5, mid and high grown tea production is considerably lower than that of low grown tea. The auction prices for tea start rising by end of July. From August to March prices remain comparatively high. Also, low grown tea seems to fetch an average higher price when compared to others. It would be interesting to find out the profitability of each type of tea (high, mid and low) considering the cost of production.
Considering monthly data, it is important to note that in February, March, September and October, the production is comparatively low (see Fig. 5 and Fig. 7). In 1994, 1998 and 2003, there had been marked differences in prices for all three types of tea. When considering the auction prices for different categories of tea from 1986 to 2006, the highest prices for different categories of tea have been reported in the period 1996-1997. One of the significant events took place in 1996 was wining the “World Cup” in cricket. The marketing campaign and the publicity obtained by the country may have helped to improve the prices of tea. If the correlation between marketing and prices of tea can be established then considering different strategies to market tea can result in higher auction price for tea. This correlation (although possible) remains to be shown by future research.
The authors believe that further research in data analysis with respect to the tea industry can result in significant insights and knowledge, which can be utilized for better alignment and growth in the sector contributing to the Sri Lankan economy.
This paper demonstrates the possibility of applying techniques such as data mining to gain useful insights in sectors such as tea industry. In future, we plan to further investigate this area of research in close collaboration with domain experts from the tea sector.
ACKNOWLEDGMENT
This research was inspired and necessary data were provided by Sri Lanka Tea Board (SLTB). We would like to acknowledge Mr. Palitha Sarukkali, Statistician, SLTB, for his valuable guidance and support.
REFERENCES [1] Annual report, 2005, Central Bank of Sri Lanka.
[2] Average monthly exchange rates , [cited Aug. 2007] [online], available from World Wide Web [http://www.cbsl.gov.lk/info/ _cei/er/e_1 .asp]. [3] Central bank of Sri Lanka: Official web page for Central bank of Sri
Lanka [cited Aug 2007] [online], available from [http://www.cbsl.gov.lk/].
[4] Ceylon tea board: Official web site for Ceylon tea board [online], [cited Aug 03 2007], available from World Wide Web [http://www.pureceylontea.com].
[5] Crone S.F., Lessmann S. and Stahlbock R., “Utility based data mining for time series analysis: cost-sensitive learning for neural network predictors,” Chicago, pp. 59 – 68, 2005.
[6] Department of Census and Statistics of Sri Lanka: Official web page for Census and Statistics Department of Sri Lanka [cited Aug 2007] [online], available from [http://www.statistics.gov.lk/].
[7] Department of Commerce: Official web page for Department of Commerce [cited Aug 2007] [online], available from [http://www.doc.gov.lk/].
[8] Dunham M.H., “Data Mining Introductory and Advanced Topics,” Pearson, 2005.
[9] Ester. M., Kriegal. H., and Schubert M., “Web Site Mining: A new way to spot Competitors, Customers and suppliers in the World Wide Web,” Proceedings of SIGKDD-2002, 2002.
[10] Faber V., “Clustering and the Continuous k-Means Algorithm,” Los Alamos Science, Number 22, 1994.
[11] Grabmeier J., and Rudolph A., “Techniques of Cluster Algorithms in Data Mining,” Data Mining and Knowledge Discovery, Springer Netherlands Vol. 6, No 4 , pp 303-360,2002.
[12] Hosking R. M. J.,. Edwin P. D and Sudan M., “A statistical perspective on data mining,” Future Generation Computing Systems, special issue on Data Mining, 1997.
[13] Julisch. K., and Dacier. M., “Mining Intrusion Detection Alarms for Actionable Knowledge,” Proceedings of KDD-2002, 2002.
Figure 13. Decision Tree of price of mid- grown tea
Table V. ART model for comparable price fluctuations of Mid grown tea
Region AR model
All Mid Grown Price = 0.132 + 1.093 * Mid Grown Price(-1) -0.183 * Mid Grown Price(-2)
Figure 14. Decision Tree of price of High- grown tea
Table VI. ART model for price of High grown tea
Region AR model
High Grown Price-3 >= 1.957 High Grown Price = 1.651 High Grown Price-3 >= 1.957
and Month >= 5/19/1999
High Grown Price = 1.651
High Grown Price-3 >= 1.957 and Month < 5/19/1999
[image:5.612.79.288.284.336.2][14] Keim. D.A, “Information visualization and visual data mining,” Proceedings of IEEE Transactions on Visualization and Computer Graphics, Vol. 8, pp 1-8, 2002.
[15] Kitts. B., Freed. D., and Kommers. J, “Cross –sell: A Fast Promotion – Turntable Customer item Recommendation Method Based on Conditionally Independent Probabilities.,” Proceedingsof KDD-2000, 2000.
[16] Ma Y., Liu B., Wong C. K., Yu P.S., Lee S. M., “Targeting the Right Student Using Data Mining,” Proceedings of KDD 2000,Boston, MA USA,2000.
[17] Meek C., Chickering D.M, and Heckerman D., “Autoregressive Tree Models for Time-Series Analysis,” 2002.
[18] Roset. S., Murad U., Neumann. E., Idan.Y., and Pinkas.G., “Discovery of Fraud Rules for Telecommunications – Challenges and Solutions.,” Proceedings of KDD-99, 1999.
[19] SQL Server 2005 Data Mining information: [cited Aug 2007] [online], available from World Wide Web [http://www.sqlserverdatamining.com].
[20] SPSS: Official web page for SPSS: [cited Jan 2008] [online], available from [http://www.spss.com/spss/]
[21] SQL Server 2005: Official web page for SQL Server 2005 [cited Aug
2007] [online], available from [http://www.microsoft.com/sql/default.mspx].
[22] Sri Lanka Customs: Official web page for Department of Commerce [cited Aug 2007] [online], available from [http://www.customs.gov.lk/].
[23] The story of the Ceylon tea [cited Aug. 2007] [online], available from World Wide Web [http://www.angelfire.com/wi/SriLanka/ ceyl_tea.htm].
[24] Tissera. W.M.R., Athauda. R. I., and Fernando H.C., “Discovery of Strongly Related Subjects in the Undergraduate Syllabi using Data Mining,” Proceeding of ICIA 2006,2006.
[25] Tong H., “Threshold models in Nonlinear Time Series Analysis,” Springer-Verlag, New York,1983.