Original Article
Serum uric acid level is a prognostic indicator and
improves the predictive ability of the IPI score in
diffuse large B-cell lymphoma
Yiwei Li, Pengfei Shi, Yaping Xie, Shenxian Qian
Department of Hematology, Hangzhou First People’s Hospital, Hangzhou 310006, China
Received July 15, 2017; Accepted November 1, 2017; Epub March 15, 2018; Published March 30, 2018
Abstract: Background: High levels of serum uric acid (SUA) have been shown to associate with negative clinical outcome in various malignancies. This study investigates whether SUA, at the time of diagnosis, has a prognostic significance in patients with diffuse large B-cell lymphoma (DLBCL). Methods: We retrospectively evaluated 167 Chinese patients with newly diagnosed DLBCL under rituximab (R)-CHOP or CHOP-like immune-chemotherapy from January 2008 to July 2016. The optimal cutoff value of SUA was determined by applying receiver operating curve (ROC) analysis. The prognostic influence of SUA and other factors were studied by Kaplan-Meier curve as well as uni-variate and multiuni-variate Cox proportional analysis. The influence of SUA on the predictive accuracy of IPI score was subsequently calculated using the Harrell’s concordance index (c-index). Results: ROC analysis showed the cutoff value of SUA with best sensitivity and specificity was 6.4 mg dl-1. Increased SUA level shown by Kaplan-Meier curve had a shorter progression free and overall survival (PFS and OS, p<0.001, respectively). In multivariate analysis, an independent significant association between elevated SUA levels and poor clinical outcome for PFS (HR=3.851; 95% CI 1.816-8.167, p<0.001) and OS (HR=4.007; 95% CI 1.884-8.523, p<0.001) was identified. The estimated concordance index, using IPI stratification measures (0.777), improved to 0.837 when SUA was integrated in. Con-clusions: In the present study, we concluded that increased SUA level at diagnosis is an independent predictor for worse clinical outcome in DLBCL patients. Integrating SUA to the IPI score might improve the survival prediction and risk stratification.
Keywords: Diffuse large b-cell lymphoma, serum uric acid, prognosis, new risk model
Introduction
Diffuse large B-cell lymphoma (DLBCL) is the most common lymphoma subtype. It is a het-erogeneous neoplasm with clinical, biologic and pathologic diversity [1]. A reliable predic-tion tool for patient’s stratificapredic-tion paves the way for successful individualized treatments. The International Prognostic Index (IPI) has been the most commonly used risk stratifica-tion model for patients with aggressive lympho-mas for extended period of time [2]. However, the discriminative capacity of the IPI weakened with the advancement in therapeutic regimen, especially among higher risk patients in the rituximab (R) era [3]. This promoted the intro-duction of revised IPI (R-IPI). In contrast to the conventional IPI targeted at DLBCL patients treated with standard immune-chemotherapy, Zhou et al. [4] further improved IPI by refining
categorization of age, normalizing serum lac-tate dehydrogenase (LDH) and revising qualifi-cation of extranodal diseases by drawing data from National Comprehensive Cancer Network (NCCN) database. NCCN-IPI classifies patients into four risk groups, thereby enhancing dis-crimination for patients in the low- and high-risk subgroups. Nevertheless, a proportion of patients died of relapse or refractory disease remained poorly characterized [5]. Assessment of molecular marker is technically complicated, expensive and not broadly available. Therefore, the search for widely obtainable parameters remains valuable in discriminating among risk groups.
hypertension, cardiovascular, metabolic syn-drome or kidney disease [7]. While some stud-ies have demonstrated that SUA levels can be positively correlated with cancer development and progression [8-14], contradictory findings have been reported regarding the role of elevat-ed SUA level in cancer prevalence as well as mortality and prognoses [15, 16]. The underly-ing cause of the paradox remains largely unknown. In the current retrospective analysis, we aim to show the prognostic value of pre-treatment SUA in Chinese DLBCL patients, and compare the predictive ability of the existing IPI score to its SUA integrated variation.
Materials and methods
Subjects
167 consecutive patients with newly diagnosed DLBCL at Hangzhou Hospital Affiliated to Nanjing Medical University from January 2008 to July 2016 were enrolled in this retrospective study. The diagnosis was established based on tissue biopsy and the World Health Organiza- tion tumor classification criteria [17]. All patients received standard R-CHOP or CHOP-like immune-chemotherapy. Given their short follow-up time, 24 patients collected were excluded to reduce the bias in progression free survival (PFS) and overall survival (OS). 3
patients with a history of gout or renal failure were removed as well. In addition, patients who had missing laboratory parameters at the diag-nosis, or who were positive for human immuno-deficiency virus, primary central nervous sys-tem lymphoma and transformed Non-Hodgkin lymphoma (NHL) were excluded from subse-quent analyses. Patients who failed to follow-up were excluded.
A number of clinical and pathologic factors were extracted from medical charts including: age, gender, presence of B symptoms and bone marrow involvement, the number of extranodal locations, clinical stage; laboratory data in- cluded SUA, LDH, serum creatinine and β2microglobulin. These clinical data were used to review and reassess the IPI and NCCN-IPI. All laboratory parameters were routinely assessed before the start of chemotherapy. This study has been approved by the Institutional Review Board of the Nanjing Medical University. Statistical analysis
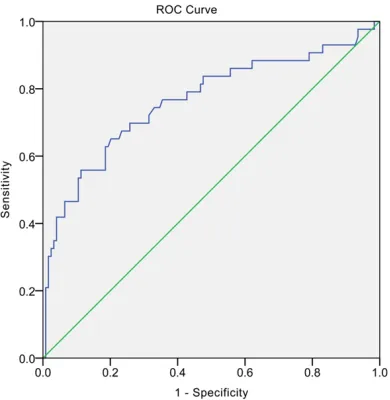
[image:2.612.92.287.71.271.2]The optimal cutoff value of uric acid was 6.4 mg dl-1, determined by applying receiver operating curve (ROC) analysis. Patients were subdivided into low- and high-SUA groups in accordance with the value. The association between uric acid levels and clinical characteristics was eval-uated by non-parametric tests (Pearson chi-square test, Fisher’s exact test). PFS was defined as time from first diagnosis to the first documentation of progressive disease or death from any cause. OS was calculated as time from first diagnosis to death from any cause. The Kaplan-Meier curve was used to determine correlation between SUA levels with OS and PFS and the comparison were assessed by the log-rank test. Furthermore, univariate Cox pro-portional analysis was calculated to identify independent prognostic factors for PFS and OS, followed by multivariate Cox analysis. The final multivariate model was chosen on the basis of the stepwise procedure as well as consider-ation of the clinical importance of variables in the model. Hazard ratios (HRs) estimated from the Cox analysis were reported as relative risks with corresponding 95% confidence intervals (CIs). Influence of SUA on the predictive accu-racy of the IPI score was calculated by Harrell’s concordance index (c-index). C-index was calcu-lated by R (The R Foundation for Statistical Computing, Vienna, Austria). All other data were Figure 1.The cutoff value for SUA via the ROC
analyzed by SPSS statistical software (version 21.0 SPSS, Chicago, IL, USA) and GraphPad Prism (version6.0; Graphpad Software, Inc, La Jolla, CA, USA), and the data-entry was ex-
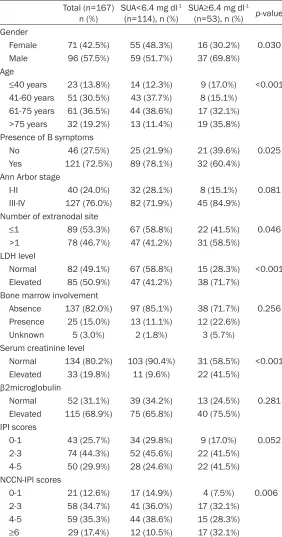
[image:3.612.93.375.85.622.2]1(31.7%) patients had high SUA (≥6.4 mg dl-1) while 114 (68.3%) had low SUA (<6.4 mg dl-1). The area under the curve (AUC) was 0.765 (95% confidence interval [CI] =0.672-0.857), with Table 1. Baseline characteristics of DLBCL patients
Total (n=167)
n (%) SUA<6.4 mg dl -1
(n=114), n (%) SUA≥6.4 mg dl -1
(n=53), n (%) p-value Gender
Female 71 (42.5%) 55 (48.3%) 16 (30.2%) 0.030 Male 96 (57.5%) 59 (51.7%) 37 (69.8%)
Age
≤40 years 23 (13.8%) 14 (12.3%) 9 (17.0%) <0.001 41-60 years 51 (30.5%) 43 (37.7%) 8 (15.1%)
61-75 years 61 (36.5%) 44 (38.6%) 17 (32.1%) >75 years 32 (19.2%) 13 (11.4%) 19 (35.8%) Presence of B symptoms
No 46 (27.5%) 25 (21.9%) 21 (39.6%) 0.025 Yes 121 (72.5%) 89 (78.1%) 32 (60.4%)
Ann Arbor stage
I-II 40 (24.0%) 32 (28.1%) 8 (15.1%) 0.081 III-IV 127 (76.0%) 82 (71.9%) 45 (84.9%)
Number of extranodal site
≤1 89 (53.3%) 67 (58.8%) 22 (41.5%) 0.046 >1 78 (46.7%) 47 (41.2%) 31 (58.5%)
LDH level
Normal 82 (49.1%) 67 (58.8%) 15 (28.3%) <0.001 Elevated 85 (50.9%) 47 (41.2%) 38 (71.7%)
Bone marrow involvement
Absence 137 (82.0%) 97 (85.1%) 38 (71.7%) 0.256 Presence 25 (15.0%) 13 (11.1%) 12 (22.6%)
Unknown 5 (3.0%) 2 (1.8%) 3 (5.7%) Serum creatinine level
Normal 134 (80.2%) 103 (90.4%) 31 (58.5%) <0.001 Elevated 33 (19.8%) 11 (9.6%) 22 (41.5%)
β2microglobulin
Normal 52 (31.1%) 39 (34.2%) 13 (24.5%) 0.281 Elevated 115 (68.9%) 75 (65.8%) 40 (75.5%)
IPI scores
0-1 43 (25.7%) 34 (29.8%) 9 (17.0%) 0.052 2-3 74 (44.3%) 52 (45.6%) 22 (41.5%)
4-5 50 (29.9%) 28 (24.6%) 22 (41.5%) NCCN-IPI scores
0-1 21 (12.6%) 17 (14.9%) 4 (7.5%) 0.006 2-3 58 (34.7%) 41 (36.0%) 17 (32.1%)
4-5 59 (35.3%) 44 (38.6%) 15 (28.3%) ≥6 29 (17.4%) 12 (10.5%) 17 (32.1%)
DLBCL, diffuse large b-cell lymphoma; SUA, serum uric acid; LDH, lactate dehydroge-nase; IPI, International Prognostic Index; NCCN-IPI, National Comprehensive Cancer Network-International Prognostic Index.
amined twice. A two-sided P<0.05 is considered stati-cally significant.
Results
Association between SUA level and other clinical char-acteristics in DLBCL
65.1% sensitivity and 20.2% specificity. (p<0.001, Figure 1).
The baseline characteristics according to cut- off point of pretreatment SUA were presented in Table 1. Males were more likely to develop high SUA level (p=0.030). High SUA level were significantly correlated with LDH and serum creatinine (p<0.001, p<0.001), age (p<0.001), B symptom (p=0.025), extranodal sites of dis-ease (>1, p=0.046), and NCCN-IPI score (P=0.006). Additionally, SUA level was negative associated with Ann Arbor stage disease (III/IV, p=0.081), bone marrow involvement (p=0.256), β2microglobulin level (p=0.281) and IPI score (p=0.052).
High uric acid level correlates with inferior OS and PFS
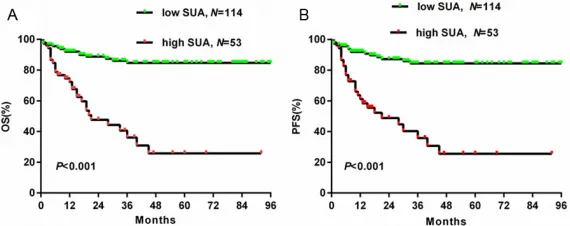
Among patients with the median follow-up time of 21 (range, 1-95) months, the low uric acid group had a significantly higher OS than the high uric acid group as shown in Figure 2A (2-year OS, 62.3% vs 26.3%, respectively; P<0.001). A Similar correlation could be found in PFS between the two groups as revealed in Figure 2B (2-year PFS, 58.8% vs 22.6%, respec-tively; p<0.001).
Univariate and multivariate cox regression analysis for overall survival
Potential influences of OS and PFS in these patients were identified using univariate cox regression model (Table 2). Analysis of a high SUA level (p<0.001), Ann Arbor stage disease (III/IV, p=0.031), presence of B symptoms (p<0.001), extranodal involvement sites (>1, p<0.001), an elevated LDH (p<0.001) and β2microglo-
11.650, p=0.027), SUA (HR=3.851; 95% CI 1.816-8.167, p<0.001) and NCCN-IPI (≥6, HR=4.861; 95% CI 1.992-11.861, p=0.001) emerged as independent and significant pre-dictors of increasing risk of cancer progression. For OS, similar findings were yielded (Table 3). Adding UA level to IPI score improves risk stratification
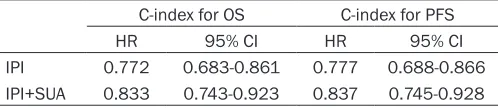
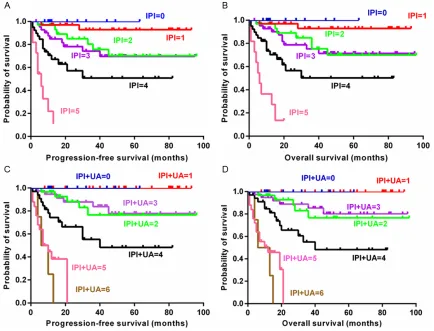
To further investigate the value of SUA in DLBCL, we incorporated the baseline SUA level (SUA<6.4 mg dl-1, 0 point; SUA≥6.4 mg dl-1, 1 po- int) into the IPI score and preformed Harrell’s C-statistics analysis. We identified SUA as a valuable prognostic factor; the c-index improved from 0.772 to 0.833 and 0.777 to 0.837 for OS and PFS respectively (Table 4). We also proved that the performance of new model surpassed the old one in both survival prediction and risk classification (Figure 3).
Discussion
Risk stratification models are crucial in the ini-tial classification and overall management of patients due to disease heterogeneity. The con-ventional IPI has been a common prognostic model for more than 20 years [2]. Advancement in the treatment of DLBCL breeds new modifi-cations on IPI, such as R-IPI and NCCN-IPI in the rituximab era. Other techniques including gene expression profiling (GEP), chromosomal aberration analysis and differential microRNA expression [18, 19] are precise but technically complicated, expensive and not broadly acces-sible. Thus, searching obtainable parameters to discriminate among risk groups remains important. SUA level is measured in routine laboratory tests and is readily available, sug-Figure 2. Kaplan-Meier curve for survival according to SUA level. A. Overall
survival (Log-rank test, p<0.001). B. Progression-free survival (Log-rank test, p<0.001).
[image:4.612.91.376.73.186.2]1.163-gesting a clinically significant potential in prog-nostic value. There have been several studies investigating the association between SUA and caner in both healthy people and cancer patients. A large prospective study [20] on more than 28000 elderly Austrian women
[image:5.612.92.533.87.272.2]These findings suggested that SUA derived from healthy people could be a pervasive parameter in the development of cancer. On the other hand, pretreatment SUA levels obtained from people with malignant tumor were also proven to be a prognostic marker in Table 2. Univariate Cox Regression Analysis of OS and PFS.
PFS OS
HR (95% CI) p-value HR [95% CI] p-value
Sex (male) 1.504 (0.803-2.816) 0.202 1.533 (0.818-2.871) 0.182 Age (>60 years) 1.659 (0.886-3.106) 0.114 1.650 (0.881-3.091) 0.118 B symptoms presence 4.941 (2.692-9.069) <0.001 4.766 (2.597-8.746) <0.001 Ann Arbor stage (III-IV) 2.785 (1.096-7.709) 0.031 2.657 (1.046-6.750) 0.04 Extranodal site (>1) 4.945 (2.474-9.882) <0.001 4.775 (2.393-9.530) <0.001 LDH (elevated) 8.620 (3.634-20.504) <0.001 8.173 (3.438-19.429) <0.001 Bone marrow presence 1.223 (0.566-2.641) 0.608 1.161 (0.538-2.504) 0.704 Serum creatinine (elevated) 2.974 (1.574-5.618) 0.001 3.083 (1.623-5.827) <0.001
[image:5.612.91.522.340.474.2]β2microglobulin (elevated) 4.053 (1.594-10.303) 0.003 3.930 (1.546-9.988) 0.004 IPI score (≥2) 4.298 (2.053-8.999) <0.001 4.042 (1.993-9.988) <0.001 NCCN-IPI score (≥6) 9.157 (4.867-17.230) <0.001 8.785 (4.674-16.512) <0.001 SUA (elevated) 6.170 (3.259-11.682) <0.001 6.145 (3.248-11.625) <0.001 OS, overall survival; PFS, progression-free survival; HR, hazard ratio; CI, confidence internal; SUA, serum uric acid; LDH, lactate dehydrogenase; IPI, International Prognostic Index; NCCN-IPI, National Comprehensive Cancer Network-International Prognos-tic Index.
Table 3. Multivariate Cox Regression Analysis of OS and PFS.
PFS OS
HR (95% CI) P-value HR (95% CI) P-value Sex (male) 1.418 (0.714-2.818) 0.318 1.579 (0.793-3.144) 0.194 Age (>60 years) 0.459 (0.196-1.073) 0.072 0.498 (0.214-1.158) 0.105 Ann Arbor stage (>2) 1.105 (0.334-3.651) 0.870 1.136 (0.343-3.759) 0.835 LDH (elevated) 3.681 (1.163-11.650) 0.027 3.919 (1.233-12.459) 0.021 Serum creatinine (elevated) 0.929 (0.441-1.959) 0.847 0.814 (0.380-1.743) 0.596 IPI score (≥2) 1.720 (0.580-5.101) 0.328 1.516 (0.515-4.464) 0.450 NCCN-IPI score (≥6) 4.861 (1.992-11.861) 0.001 4.704 (1.909-11.587) 0.001 SUA (elevated) 3.851 (1.816-8.167) <0.001 4.007 (1.884-8.523) <0.001 OS, overall survival; PFS, progression-free survival; HR, hazard ratio; CI, confidence internal; SUA, serum uric acid; LDH, lactate dehydrogenase; IPI, International Prognostic Index; NCCN-IPI, National Comprehensive Cancer Network-International Prognos-tic Index.
Table 4. Harrell’s C-statistics analysis for discriminatory values on survival
C-index for OS C-index for PFS
HR 95% CI HR 95% CI
IPI 0.772 0.683-0.861 0.777 0.688-0.866 IPI+SUA 0.833 0.743-0.923 0.837 0.745-0.928 IPI, International Prognostic Index; SUA, serum uric acid; OS, overall survival; PFS, progression-free survival.
[image:5.612.90.339.554.608.2]various cancer types such as acute myeloid leukemia (AML) [8], pancreatic cancer [11], soft-tissue sarcoma [13], as well as other termi-nally ill cancers [14]. Further investigation reported that patients with higher SUA levels associated with endocrine and metabolic showed increased risk to develop metastases in solid cancers [9, 12]. Our study also suggest-ed SUA level at diagnosis as a prognostic parameter in Chinese patients with DLBCL. However, positive associations between SUA level and survival in patients with certain can-cer types (e.g., colorectal cancan-cer and nasopha-ryngeal carcinoma) have also been reported [15, 16].
Such uncertainty in the prognostic use of SUA levels could be partially explained by the dual role theory of SUA. In one study, the presence of a molecular switch regulated by specific human organ microenvironment determined the role of SUA as an anti-oxidant or a pro-oxi-dant [22]. The anti-oxipro-oxi-dant role of SUA among
cancer patients was first explored by Ames [23] et al. showing that increased SUA level protect-ed against initiation and progression of tumor by scavenging singlet oxygen and preventing lipid peroxidation. Similar results from a ran-domized, placebo-controlled double-blind study [24] further strengthened uric acid’s anti-oxi-dant properties, in which reactive oxygen spe-cies (ROS) production was reduced, thereby inhibiting tumor cell proliferation and migration. In addition to the anti-oxidant aspect, the sur-veillance mechanism also helps to explain why SUA is protective against cancer. Degenerating/ dying cells release SUA and antigens that the host is not tolerant. This process stimulates the immune system and generates responses against cancer cells [25].
tion involving changes in adiponectin, C-reactive protein (CRP) and Leptin levels [6]. Accordingly, high SUA level reduces circulating adiponectin, which weakens bodily inhibition capacity against Wnt signaling, Akt activity and LKB1, thereby leads to increased cancer risk, recur-rence and metastasis [6]. SUA level was posi-tively correlated with CRP level, which increas-es risk for breast cancer (BC), gastric and renal cell cancers [27-29]. Elevated SUA level exhib-its an increase in leptin, a dependent poor prognostic marker in breast, colon, prostate, and ovarian cancer [30, 31]. In addition, high level of SUA in cancer cells diminishes Xanthine Oxidoreductase (XOR) expression and activity, which contributes to tumor differentiation and metastasis [6]. Moreover, hyperuricemia pre-dicts tumor lysis symptom (TLS) in patients with large tumor burden, especially hematologic malignancies [32]. TLS is characterized by mas-sive destruction of rapid proliferating neoplas-tic cells, leading to metabolic dysfunction and organ failures. The oxidative and pro-inflammation properties of SUA facilitate these organ injuries [32].
In the present study, we found that elevated SUA was associated with the presence of B symptom, higher counts of extranodal sites and higher level of LDH and serum creatinine. Therefore, the result coincides with previous publications that hyperuricemia reflects high tumor burden and rapid growth of tumor cells [33]. Furthermore, our study indicated that ele-vated SUA level was associated with worse OS and PFS in DLBCL patients. One explanation associated with serum creatinine is that elevat-ed SUA causelevat-ed by a relevat-eduction in renal excretion may indicate renal impairment. Patients with renal dysfunction tend to receive lower dosage on their initial chemotherapy. Insufficient con-centration of drug in combination with a high tumor burden in these patients contributes to poor outcomes.
To the best of our knowledge, there is one retro-spective analysis prior to ours concerned SUA level in BLDCL. Data from two Australian cen-ters demonstrated similar findings with minor statistical discrepancies such as the cutoff value of SUA [34]. Nevertheless, different eth-nic origins, population sample size and habits (e.g., diet) may be responsible for the different outcomes in the Australian study compared to
ours. One weakness of the current study is the relatively small patient cohort (167 patients). In addition, patient follow-up remained limited in the present study. Nonetheless, while statisti-cal analysis pointed SUA as an inexpensive and readily available parameter that improves risk stratification when integrated into the IPI score, further clinical research and external validation is needed.
Conclusion
In the present study, we suggested elevated SUA level at diagnosis as an independent pre-dictor for worse clinical outcome in DLBCL patients under rituximab (R)-CHOP or CHOP-like immune-chemotherapy. Plus, by integrating SUA to the IPI score, we could improve the sur-vival prediction and risk stratification of DLBCL patients.
Disclosure of conflict of interest
None.
Address correspondence to: Shenxian Qian, Department of Hematology, The Hangzhou Hospital Affiliated to Nanjing Medical University, 216 Huansha Road, Hangzhou 310006, P.R China. Tel: 008613750887628; E-mail: [email protected]
References
[1] Xie Y, Pittaluga S and Jaffe ES. The histological classification of diffuse large B-cell lympho-mas. Semin Hematol 2015; 52: 57-66. [2] Hasenclever D and Diehl V. A prognostic score
for advanced Hodgkin’s disease. International Prognostic Factors Project on Advanced Hodg-kin’s Disease. N Engl J Med 1998; 339: 1506-1514.
[3] Sehn LH, Berry B, Chhanabhai M, Fitzgerald C, Gill K, Hoskins P, Klasa R, Savage KJ, Shenkier T, Sutherland J, Gascoyne RD and Connors JM. The revised International Prognostic Index (R-IPI) is a better predictor of outcome than the standard IPI for patients with diffuse large B-cell lymphoma treated with R-CHOP. Blood 2007; 109: 1857-1861.
treated in the rituximab era. Blood 2014; 123: 837-842.
[5] Coiffier B, Thieblemont C, Van Den Neste E, Lepeu G, Plantier I, Castaigne S, Lefort S, Marit G, Macro M, Sebban C, Belhadj K, Bordessoule D, Ferme C and Tilly H. Long-term outcome of patients in the LNH-98.5 trial, the first random-ized study comparing rituximab-CHOP to stan-dard CHOP chemotherapy in DLBCL patients: a study by the Groupe d’Etudes des Lymphomes de l’Adulte. Blood 2010; 116: 2040-2045. [6] Fini MA, Elias A, Johnson RJ and Wright RM.
Contribution of uric acid to cancer risk, recur-rence, and mortality. Clin Transl Med 2012; 1: 16.
[7] Heinig M and Johnson RJ. Role of uric acid in hypertension, renal disease, and metabolic syndrome. Cleve Clin J Med 2006; 73: 1059-1064.
[8] Yamauchi T, Negoro E, Lee S, Takai M, Matsu-da Y, Takagi K, Kishi S, Tai K, Hosono N, Tasaki T, Ikegaya S, Inai K, Yoshida A, Urasaki Y, Iwa-saki H and Ueda T. A high serum uric acid level is associated with poor prognosis in patients with acute myeloid leukemia. Anticancer Res 2013; 33: 3947-3951.
[9] Rose DP, Haffner SM and Baillargeon J. Adi-posity, the metabolic syndrome, and breast cancer in African-American and white Ameri-can women. Endocr Rev 2007; 28: 763-777. [10] Dhankhar R, Dahiya K, Sharma TK, Ghalaut
VS, Atri R and Kaushal V. Diagnostic signifi-cance of adenosine deaminase, uric acid and C-reactive protein levels in patients of head and neck carcinoma. Clin Lab 2011; 57: 795-798.
[11] Stotz M, Szkandera J, Seidel J, Stojakovic T, Sa-monigg H, Reitz D, Gary T, Kornprat P, Scha-berl-Moser R, Hoefler G, Gerger A and Pichler M. Evaluation of uric acid as a prognostic blood-based marker in a large cohort of pan-creatic cancer patients. PLoS One 2014; 9: e104730.
[12] Tanriverdi O, Cokmert S, Oktay E, Pilanci KN, Menekse S, Kocar M, Sen CA, Avci N, Akman T, Ordu C, Goksel G and Meydan N. Prognostic significance of the baseline serum uric acid level in non-small cell lung cancer patients treated with first-line chemotherapy: a study of the Turkish Descriptive Oncological Research-es Group. Med Oncol 2014; 31: 217.
[13] Szkandera J, Gerger A, Liegl-Atzwanger B, Stotz M, Samonigg H, Ploner F, Stojakovic T, Gary T, Leithner A and Pichler M. Uric acid levels in blood are associated with clinical outcome in soft-tissue sarcoma patients. Clin Chem Lab Med 2015; 53: 493-497.
[14] Shin HS, Lee HR, Lee DC, Shim JY, Cho KH and Suh SY. Uric acid as a prognostic factor for
sur-vival time: a prospective cohort study of termi-nally ill cancer patients. J Pain Symptom Man-age 2006; 31: 493-501.
[15] Dziaman T, Banaszkiewicz Z, Roszkowski K, Gackowski D, Wisniewska E, Rozalski R, Fok-sinski M, Siomek A, Speina E, Winczura A, Marszalek A, Tudek B and Olinski R. 8-Oxo-7,8-dihydroguanine and uric acid as efficient pre-dictors of survival in colon cancer patients. Int J Cancer 2014; 134: 376-383.
[16] Lin H, Lin HX, Ge N, Wang HZ, Sun R and Hu WH. Plasma uric acid and tumor volume are highly predictive of outcome in nasopharyn-geal carcinoma patients receiving intensity modulated radiotherapy. Radiat Oncol 2013; 8: 121.
[17] Sabattini E, Bacci F, Sagramoso C and Pileri SA. WHO classification of tumours of haemato-poietic and lymphoid tissues in 2008: an over-view. Pathologica 2010; 102: 83-87.
[18] Alizadeh AA, Eisen MB, Davis RE, Ma C, Lossos IS, Rosenwald A, Boldrick JC, Sabet H, Tran T, Yu X, Powell JI, Yang L, Marti GE, Moore T, Hud-son J Jr, Lu L, Lewis DB, Tibshirani R, Sherlock G, Chan WC, Greiner TC, Weisenburger DD, Ar-mitage JO, Warnke R, Levy R, Wilson W, Grever MR, Byrd JC, Botstein D, Brown PO and Staudt LM. Distinct types of diffuse large B-cell lym-phoma identified by gene expression profiling. Nature 2000; 403: 503-511.
[19] Shepshelovich D, Ram R, Uziel O, Kushnir M, Lithwick-Yanai G, Hoshen M, Feinmesser M, Bairey O and Lahav M. MicroRNA signature is indicative of long term prognosis in diffuse large B-cell lymphoma. Leuk Res 2015; 39: 632-637.
[20] Strasak AM, Rapp K, Hilbe W, Oberaigner W, Ruttmann E, Concin H, Diem G, Pfeiffer KP and Ulmer H. The role of serum uric acid as an an-tioxidant protecting against cancer: prospec-tive study in more than 28 000 older Austrian women. Ann Oncol 2007; 18: 1893-1897. [21] Strasak AM, Lang S, Kneib T, Brant LJ, Klenk J,
Hilbe W, Oberaigner W, Ruttmann E, Kalten-bach L, Concin H, Diem G, Pfeiffer KP and Ul-mer H. Use of penalized splines in extended Cox-type additive hazard regression to flexibly estimate the effect of time-varying serum uric acid on risk of cancer incidence: a prospective, population-based study in 78,850 men. Ann Epidemiol 2009; 19: 15-24.
[22] Kang DH and Ha SK. Uric acid puzzle: dual role as anti-oxidantand pro-oxidant. Electrolyte Blood Press 2014; 12: 1-6.
[24] Waring WS, Webb DJ and Maxwell SR. System-ic urSystem-ic acid administration increases serum antioxidant capacity in healthy volunteers. J Cardiovasc Pharmacol 2001; 38: 365-371. [25] Shi Y, Evans JE and Rock KL. Molecular
identi-fication of a danger signal that alerts the im-mune system to dying cells. Nature 2003; 425: 516-521.
[26] Viazzi F, Bonino B, Ratto E, Desideri G and Pon-tremoli R. [Hyperuricemia, diabetes and hyper-tension]. G Ital Nefrol 2015; 32: Suppl 62. [27] Vona-Davis L, Howard-McNatt M and Rose DP.
Adiposity, type 2 diabetes and the metabolic syndrome in breast cancer. Obes Rev 2007; 8: 395-408.
[28] Shimura T, Kitagawa M, Yamada T, Ebi M, Mizoshita T, Tanida S, Kataoka H, Kamiya T and Joh T. C-reactive protein is a potential prog-nostic factor for metastatic gastric cancer. An-ticancer Res 2012; 32: 491-496.
[29] Saito K and Kihara K. Role of C-reactive protein as a biomarker for renal cell carcinoma. Expert Rev Anticancer Ther 2010; 10: 1979-1989. [30] Jarde T, Perrier S, Vasson MP and
Caldefie-Chezet F. Molecular mechanisms of leptin and adiponectin in breast cancer. Eur J Cancer 2011; 47: 33-43.
[31] Grossmann ME, Ray A, Nkhata KJ, Malakhov DA, Rogozina OP, Dogan S and Cleary MP. Obe-sity and breast cancer: status of leptin and adiponectin in pathological processes. Cancer Metastasis Rev 2010; 29: 641-653.
[32] Shimada M, Johnson RJ, May WS Jr, Lingegow-da V, Sood P, Nakagawa T, Van QC, Dass B and Ejaz AA. A novel role for uric acid in acute kid-ney injury associated with tumour lysis syn-drome. Nephrol Dial Transplant 2009; 24: 2960-2964.
[33] Sevinir B, Demirkaya M, Baytan B and Gunes AM. Hyperuricemia and tumor lysis syndrome in children with non-Hodgkin’s lymphoma and acute lymphoblastic leukemia. Turk J Haema-tol 2011; 28: 52-59.