Abstract - The objective of this research is to reduce the makespan error in production planning by providing a proper sequencing process which will lead to the minimization of overall processing time, or makespan. The company selected as a case study is involved in flowshop manufacturing of flex cable circuit, with full plate production using a two-sided assembly line as part of roll-to-roll processing.
The problem encountered was a 20% error in job completion between production planning and real production. Improper job sequencing caused a long wait for the machine in the manufacturing station, which resulted in a long makespan time.
Developing a model by using Arena simulation can reduce the makespan error in production planning. The model is validated by using hypothesis testing (t-test), comparing makespan of real production and makespan of simulation at a 95% significance level. The production line is flowshop manufacturing, which presents a non-polynomial hard problem that is difficult to solve. Three heuristic scheduling methods are Palmer, Gupta, and CDS (Campbell, Dudek and Smith). They are used to compare with the preprocess scheduling for 13 weeks, in order to provide a proper scheduling method and a minimum makespan.
The results showed that the simulation technique improved production planning by reducing the error rate from 12.80% to 5.04%. Moreover, the CDS heuristic sequencing method provided the maximum reduction in makespan (at a 95 % significance level).
Index Terms: production planning, flowshop, heuristic method, simulation, makespan
I. INTRODUCTION
The company selected for a case study is a well-known electronic assembly production facility situated in Lamphun industrial estate, northern Thailand. The company has been in business for eight years and has more than 3,000 employees. The main manufacturing product is flex cable circuit, ready-made or custom design. Production occurs six days per week, 24 hours a day. The production line is flowshop manufacturing, which includes many processing machines. Jobs are prepared before entering the machines. However, the production process involves different time limits at each job station; this leads to difficulties in developing a production planning scheme [1]-[3].
_____________________
* Manuscript received December 23, 2008. This work was supported in part by the Industry/University Cooperative Research Center (I/U CRC) in HDD Component Faculty of Engineering, Khon Kaen University.
Suntichai Shevasuthisilp is with Department of Industrial Engineering, Faculty of Engineering, Chiang Mai University, Chiang Mai 50200 Thailand (e-mail: [email protected]).
Sivarak Intawong is with Department of Industrial Engineering, Faculty of Engineering, Chiang Mai University, Chiang Mai 50200 Thailand (e-mail: [email protected]).
The study focused on problems encountered in roll-to-roll processing, with full plate production using a two-sided assembly line as a part of flowshop manufacturing. Difficulties arise due to the high number of line production orders, more than 97% of which can involve 18 lists of manufactured items and nine main complicated processes. The problem to be addressed is a 20% makespan error between production planning and real production. This occurs because the process times used in production planning were not consistent with real production times. Set-up time, delivery time, idle time and inspection time were not involved in makespan calculation in the production planning. The main problems encountered were idle time and a long waiting time for the machine in the manufacturing station, due to improper job sequencing. This resulted in additional idle time between each station [4], [5].
A simulation technique consistent with actual production was conducted as part of this research. The simulation model should be able to reduce the error of makespan in production planning by constructing a prototype using statistical data related to the time used in actual production, such as process time, set-up time, delivery time, inspection time (including time used for calculation using a simulation technique), idle time, and waiting time. To address the problem of idle time between each job station due to improper job sequencing, and to reduce makespan, the researcher proposed analyzing the sequencing technique using three heuristic scheduling methods: Palmer; Gupta; and CDS (Campbell, Dudek and Smith) [6], [7]. Palmer (1965) suggested an algorithm using the concept of a slope index for each job, which is a measure of whether a job proceeds from a shorter to a longer processing time in the sequence. A sequence is then constructed with descending slope indices, with the idea that jobs that tend to proceed from shorter to longer processing times in the sequence of operations are processed earlier. Gupta (1971) proposed this for more than two processes, creating a good permutation schedule. He also noted that Johnson’s rule is optimal in the three-machine case, and investigated a set of other heuristics that are also based on construction via transitive rules. Campbell et al. (1970) proposed an algorithm for makespan problems called the CDS algorithm. Using two main principles, this procedure achieves good results: it uses Johnson’s rule in a heuristic way, and it generally creates several schedules, the best one of which should be chosen.
Simulation model verification and proper sequencing should result in the improvement of scheduling efficiency [8].
Improvement
of Scheduling Efficiency Using
Heuristic Methods and Simulation Technique
in Electronic Assemblies Industry Production
II. METHODOLOGY
Methodology was categorized in seven steps (Fig. 1). Data collected for constructing the simulation were: set-up time, delivery time, process time, inspection time, and basic resource information at each station. The data were evaluated using the input analyzer of the Arena program [9] to define the probability distribution. A simulation model was then constructed to define the makespan. Model validation using hypothesis testing (t-test) compared the
simulated and real production makespan at a 95% significance level.
[image:2.595.311.534.53.122.2]The production simulation analyzed job sequencing using a heuristic method by comparing the efficiency of each heuristic methodfor 13 weeks at a 95% significance level. This provided proper job sequencing, leading to a maximum reduction in makespan.
Fig. 1 Research methodology
III. RESULTS AND DISCUSSION
A. Production process data
The roll-to-roll manufacturing process, using a two-sided assembly line and full plate production, was divided into nine job stations, as shown in Fig. 2.
[image:2.595.314.537.222.559.2]Fig. 2 Flow chart of the production process
Fig. 3 Examples of the production process
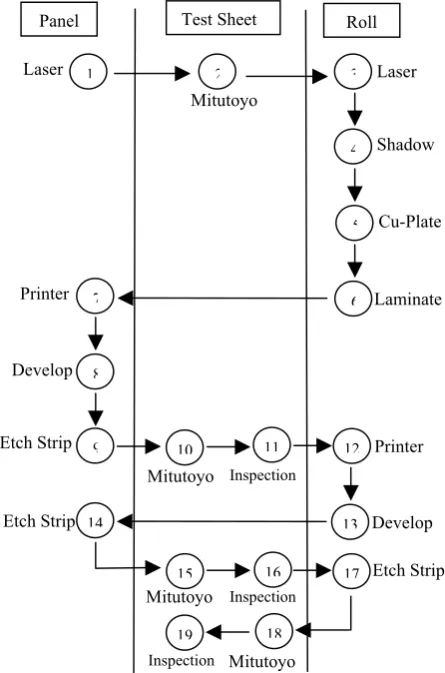
[image:2.595.50.286.262.412.2]The roll-to-roll manufacturing process was composed of 19 components, or sub-processes. Production was conducted in each panel followed by a priority test sheet before roll production. The sub-processes are shown in Fig. 4.
Fig. 4 The sub-processes of production
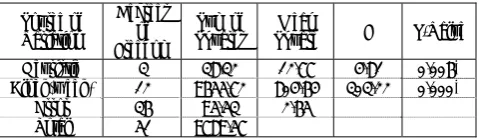
Resource information for constructing the simulation is shown in Table I.
Table I
Number of machines in each process
Process Number of Machines Laser 4 Shadow 1
Cu Plate 2
Laminate 1 Printer 5 Develop 1
6. Compare each Heuristic Method 1. Data Collection
4. Heuristic Method
2. Simulation
5. Defining Makespan
7. Conclusion
3. Model Validation
Laser
Inspection
Inspection Inspection
Mitutoyo
Mitutoyo Mitutoyo
Mitutoyo
Etch Strip
Etch Strip Develop
Printer Laser
Shadow
Cu-Plate
Laminate Printer
Develop
Etch Strip
Panel Test Sheet Roll
1 2 3
4
5
6 7
8
9 10 11 12
13 14
15 16 17
[image:2.595.127.227.546.723.2] [image:2.595.337.486.642.782.2]B. Construction of the simulation
[image:3.595.311.544.48.213.2]The simulation model was composed of 1 input module, 19 process modules and 1 output module (Fig. 5), representing the real production process.
Fig. 5 The job stations modules in Arena simulation
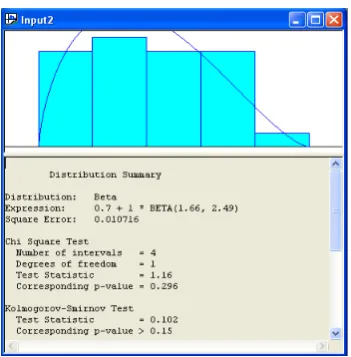
[image:3.595.55.258.121.190.2]The time variable in line production was computed by simulation, and evaluated using the input analyzer of the Arena program to define probability distribution and the least sum square error (Figs. 6 and 7). Data distribution was used instead of original standard time in order to minimize the overall processing time.
[image:3.595.312.543.255.399.2]Fig. 6 Time of process using input analyzer
Fig. 7 Analyzing the least sum square error
The simulation model which represents real production is shown in Fig. 8; simulated animation is shown in Fig. 9.
Fig. 8 Simulation model of the production process
Fig. 9 Simulated animation of the production process
C. Model validation
The simulation model of the production process was validated by comparing the makespan in real production and the makespan in simulation for 13 weeks. The precision of the simulation model was validated by using hypothesis testing (t-test) at a 95% significance level.
Hypothesis:
:
0H
X
real=
X
sim:
1
H
X
real≠
X
simsim
X
is the mean of makespan in simulationreal
X
is the mean of makespan in real productionIf the hypothesis is accepted, it means that makespan in simulation is equal to makespan in real production; but if the hypothesis is rejected, makespan in simulation is not equal to makespan in real production at a 95% significance level.
The result in every process showed that the simulation was acceptable (p≥0.05). The comparisons between real production, simulation and original planning are shown in Fig. 10.
Input (Create)
Process (Sub-processes)
Output (Dispose)
[image:3.595.80.256.297.476.2] [image:3.595.77.257.517.659.2]0 1 2 3 4 5 6 7
1 2 3 4 5 6 7 8 9 10 11 12 13 Week Makespan (Days)
[image:4.595.307.518.58.119.2]Real Production Simulation Production Planning
Fig. 10 Makespan of the real production, simulation, and original production planning
This comparison between the efficiency of the real production and simulation models, by calculating the average mean percentage of makespan, shows that the original production planning data have a 12.80 mean percentage error of makespan, while the simulation model has a 5.04 mean percentage error. This indicates a 7.76% increase in the efficiency of production planning.
D. Comparison of heuristic method efficiency
Job sequencing and preprocess planning were analyzed with a simulation model using three heuristic methods (Palmer, Gupta and CDS) to define the makespan, and compared by randomized complete block design (RCBD) at a 95% significance level. The variable block is weeks, because the orders for production in each week are not equal. Testing the differences between each heuristic was performed using an ANOVA test to provide proper sequencing and a minimum makespan. Results are shown in Table II (using α = 0.05).
Hypothesis: 4 3 2 1
0
:
μ
=
μ
=
μ
=
μ
H
:
1
H
at least oneμ
i≠
μ
j1
μ
is the makespan of Palmer heuristic2
μ
is the makespan of Gupta heuristic3
μ
is the makespan of CDS heuristic4
[image:4.595.53.277.61.191.2]μ
is the makespan of preprocess planningTable II
Analysis of makespan variance
Source of Variation Degrees of Freedom Sum of Squares Mean
Square F P-Value Heuristic 3 38.32 12.77 4.81 0.006* Block(week) 12 9655.72 804.64 303.22 0.000*
Error 36 95.53 2.65
Total 51 9789.57
[image:4.595.310.541.242.386.2]* Significant difference at 95% significance level
Fig. 11 Comparing 95% confidence interval for each heuristic
Because the p-value is less than 0.05, we would still reject the null hypothesis and conclude that the makespan of heuristic methods and preprocess planning significantly affects the mean yield (p-value = 0.006). 95% confidence intervals for each heuristic are shown in Fig. 11. The makespan of each job sequencing method for 13 weeks is shown in Fig. 12.
Heuristic Comparison 80 85 90 95 100 105 110 115 120 125 130 135 140 145
1 2 3 4 5 6 7 8 9 10 11 12 13Weeks
M a ke sp a n ( h rs ) Palmer Gupta CDS Original
Fig. 12. Makespan of each heuristic method
The comparison of sequencing using each heuristic method shows a significant difference in the mean yield, at a 95% significance level. CDS provided the maximum reduction in makespan, suggesting that this method is the most appropriate for the selected case-study company. The makespan was reduced 5.74% from the original production planning.
IV. CONCLUSION
The purpose of this research is to improve scheduling efficiency by constructing a simulation model which will provide appropriate sequencing by using heuristic methods, and thus minimize the overall processing time or makespan. At a 95% significance level, the simulation can reduce the error of production planning from 12.80% to 5.04%, leading to a 7.76% increase in efficiency of production.
The most appropriate sequencing for minimizing the makespan is CDS, which resulted in a 5.74% reduction in makespan at a 95% significance level. This method uses Johnson’s rule in a heuristic way, generally creating several schedules, the best one of which should be chosen. The CDS algorithm creates artificial two-machine problems and then solves them by implementing Johnson’s two-machine algorithm. Then, the best obtained solution becomes the best solution for the main m-machine makespan problem.
[image:4.595.42.282.649.718.2]REFERENCES
[1] K. Sethanun, K. Tipayasri, M., and N. Weerakornpimol, “Scheduling hybrid flowshops under machine eligibility constraints,” Khon Kaen University Eng. J., vol. 31, no. 3, pp. 239-256, July-Sept 2004.
[2] O. Alagoz and M. Azizoglu, “Rescheduling of identical parallel machines under machine eligibility constraints,” Eur. J. Oper. Res., vol. 149, no. 3, pp. 523-532, 2003.
[3] Y. Lin and W. Li, “Parallel machine scheduling of machine-dependent jobs with unit-length,” Eur. J. Oper. Res., vol. 156, no. 1,
pp. 261-266, 2004.
[4] R. W. Hall, Queueing methods for service and manufacturing. Englewood Cliffs, NJ: Prentice Hall, 1991.
[5] G. Donald and C. M. Harris, Fundamentals of queueing theory, 2nd
ed. New York: John Wiley & Sons, 1985.
[6] J. N. D. Gupta & E. A. Tunc, “Schedules for a two-stage hybrid flowshop with parallel machines at the second stage,” Int. J. Prod. Res., vol. 29, pp. 1489-1502, July 1991.
[7] H. Soewandi, “Sequencing jobs on two- and three-stage hybrid flowshops to minimize makespan,” Ph.D. dissertation, North Carolina State University, Raleigh, NC, 1998.
[8] P. Luangpaiboon and A. Boonvirojrit, “Comparison of heuristic methods for the n-job and m-machine flowshop with resource constraints,” Department of Industrial Engineering, Faculty of Engineering, Thammasat University, Pathumthani, Thailand, 2004. [9] W. D. Kelton, Simulation with Arena, 3rd ed. Singapore: