Using Question Series To Evaluate Question Answering System Effectiveness
Ellen M. Voorhees
National Institute of Standards and Technology Gaithersburg, MD 20899
Abstract
The original motivation for using ques-tion series in the TREC 2004 quesques-tion an-swering track was the desire to model as-pects of dialogue processing in an evalu-ation task that included different question types. The structure introduced by the se-ries also proved to have an important ad-ditional benefit: the series is at an appro-priate level of granularity for aggregating scores for an effective evaluation. The series is small enough to be meaningful at the task level since it represents a sin-gle user interaction, yet it is large enough to avoid the highly skewed score distribu-tions exhibited by single quesdistribu-tions. An analysis of the reliability of the per-series evaluation shows the evaluation is stable for differences in scores seen in the track.
The development of question answering technol-ogy in recent years has been driven by tasks de-fined in community-wide evaluations such as TREC, NTCIR, and CLEF. The TREC question answering (QA) track started in 1999, with the first several edi-tions of the track focused on factoid quesedi-tions. A factoid question is a fact-based, short answer ques-tion such as How many calories are there in a Big
Mac?. The track has evolved by increasing the type
and difficulty of questions that are included in the test set. The task in the TREC 2003 QA track was a combined task that contained list and definition questions in addition to factoid questions (Voorhees,
2004). A list question asks for different instances of a particular kind of information to be returned, such as List the names of chewing gums. Answering such questions requires a system to assemble an answer from information located in multiple documents. A definition question asks for interesting information about a particular person or thing such as Who is
Vlad the Impaler? or What is a golden parachute?.
Definition questions also require systems to locate information in multiple documents, but in this case the information of interest is much less crisply de-lineated.
Like the NTCIR4 QACIAD challenge (Kato et al., 2004), the TREC 2004 QA track grouped ques-tions into series, using the series as abstracques-tions of information-seeking dialogues. In addition to mod-eling a real user task, the series are a step toward in-corporating context-processing into QA evaluation since earlier questions in a series provide some con-text for the current question. In the case of the TREC series, each series contained factoid and list ques-tions and had the target of a definition associated with it. Each question in a series asked for some information about the target. In addition, the final question in each series was an explicit “other” ques-tion, which was to be interpreted as “Tell me other interesting things about this target I don’t know enough to ask directly”. This last question was roughly equivalent to the definition questions in the TREC 2003 task.
ques-tion scores. The next secques-tion describes the quesques-tion series that formed the basis of the TREC 2004 eval-uation. Since TREC uses different evaluation proto-cols for different question types, the following sec-tion describes the way in which individual quessec-tion types were evaluated. Section 3 contrasts the scores obtained by aggregating individual question scores by question type or by series, and shows the use of series leads to a reliable evaluation at differences in scores that are observed in practice.
1 Question Series
A question series as used in the TREC 2004 QA track consisted of several factoid questions, zero to two list questions, and exactly one Other question. Associated with each series was a definition target. The series a question belonged to, the order of the question in the series, and the type of each question (factoid, list, or Other) were all explicitly encoded in the XML format used to describe the test set. Exam-ple series (minus the XML tags) are shown in fig-ure 1. A target was a person, an organization, or thing that was a plausible match for the scenario as-sumed for the task: that the questioner was an “aver-age” adult reader of US newspapers who was look-ing for more information about a term encountered while reading the paper.
The TREC 2004 test set contains 65 series. Of the 65 targets, 23 are PERSONs, 25 are ORGANI-ZATIONs, and 17 are THINGs. The series contain a total of 230 factoid questions, 56 list questions, and 65 (one per target) Other questions. Each se-ries contains at least four questions, counting the Other question, with most series containing five or six questions. The maximum number of questions in a series is ten.
Question series were also the fundamental struc-ture used in the QACIAD challenge (Question An-swering Challenge for Information Access Dia-logue) of NTCIR4. However, there are some impor-tant differences between the QACIAD and TREC series. The QACIAD series model a more natu-ral flow of questions in an information-seeking di-alogue. Given other evaluation requirements (most questions need to have an answer in the source doc-uments, answers to earlier questions should not be given in later questions, etc.), the series in the TREC
test set are heavily edited versions of the series col-lected from the original information seekers. The resulting edited series appear as a stilted conversa-tional style when viewed from the perspective of true dialogue, and the series do not reflect the full range of information requested in the original series. (For example, TREC requires list question answers to be concrete entities such as cities or book titles while the information seekers often asked for fuzzier in-formation such as lists of descriptive qualities.) The QACIAD challenge contained two types of series, gathering series and browsing series. In a gather-ing series, all of the questions are related to a sgather-ingle target (that was not explicitly given in QACIAD), while questions in a browsing series can refer to un-related targets. The TREC series are all gathering type series with the target explicitly given. Finally, the QACIAD series consist of list questions only, since factoid questions are treated as list questions with a single answer.
Systems participating in the TREC evaluation were required to process series independently from one another, and were required to process an individ-ual series in question order. That is, systems were allowed to use questions and answers from earlier questions in a series to answer later questions in that same series, but could not “look ahead” and use later questions to help answer earlier questions. The se-ries was the unit used to structure the test set, but there was no requirement for systems to process a series as a unit. Some systems appended the target to each of the questions in its series and then pro-cessed all resulting question strings independently as in earlier TREC evaluations. Per-series evaluation is still valid since the task to be evaluated is defined in terms of the series and is independent of how sys-tems choose to process the questions.
Sixty-three runs from 28 participants were sub-mitted to the TREC 2004 QA track.
2 Scoring Question Series
3 Hale Bopp comet
3.1 FACTOID When was the comet discovered? 3.2 FACTOID How often does it approach the earth?
3.3 LIST In what countries was the comet visible on its last return?
3.4 OTHER
21 Club Med
21.1 FACTOID How many Club Med vacation spots are there worldwide? 21.2 LIST List the spots in the United States.
21.3 FACTOID Where is an adults-only Club Med?
21.4 OTHER
22 Franz Kafka
22.1 FACTOID Where was Franz Kafka born? 22.2 FACTOID When was he born?
22.3 FACTOID What is his ethnic background? 22.4 LIST What books did he author?
[image:3.612.117.497.54.275.2]22.5 OTHER
Figure 1: Sample question series from the test set. Series 3 has a THING as a target, series 21 has an ORGANIZATION as a target, and series 22 has a PERSON as a target.
2.1 Factoid questions
The system response for a factoid question is either exactly one [doc-id, answer-string] pair or the literal string ‘NIL’. NIL is returned by a system when it be-lieves there is no answer to the question in the docu-ment collection. Otherwise, answer-string is a string containing precisely an answer to the question, and
doc-id is the id of a document in the collection that
supports answer-string as an answer.
Each response was assigned exactly one of the following four judgments:
incorrect: the answer string does not contain a right
answer or the answer is not responsive;
not supported: the answer string contains a right
answer but the document returned does not sup-port that answer;
not exact: the answer string contains a right answer
and the document supports that answer, but the string contains more than just the answer or is missing bits of the answer;
correct: the answer string consists of exactly the
right answer and that answer is supported by the document returned.
To be responsive, an answer string is required to contain appropriate units and to refer to the correct
“famous” entity (e.g., the Taj Mahal casino is not re-sponsive when the question asks about “the Taj Ma-hal”). NIL responses are correct only if there is no known answer to the question in the collection and are incorrect otherwise. NIL is correct for 22 of the 230 factoid questions in the test set
An individual factoid question has a binary score, 1 if the response is judged correct and 0 otherwise. The score for a set of factoid questions is accuracy, the fraction of questions in the set judged correct.
2.2 List questions
A list question can be thought of as a shorthand for asking the same factoid question multiple times. The set of all correct, distinct answers in the document collection that satisfy the factoid question is the cor-rect answer for a list question.
and the remainder are not marked as distinct. Only correct responses may be marked as distinct.
The final correct answer set for a list question is compiled from the union of the correct responses across all runs plus the instances the assessor found during question development. For the 55 list ques-tions used in the evaluation (one list question was dropped because the assessor decided there were no correct answers during judging), the average number of answers per question is 8.8, with 2 as the smallest number of answers, and 41 as the maximum num-ber of answers. A system’s response to a list ques-tion was scored using instance precision (IP) and instance recall (IR) based on the list of known in-stances. LetS be the number of known instances,
D be the number of correct, distinct responses re-turned by the system, andN be the total number of responses returned by the system. ThenIP =D/N
and IR = D/S. Precision and recall were then combined using the F measure with equal weight given to recall and precision:
F = 2×IP ×IR
IP +IR
The score for a set of list questions is the mean of the individual questions’ F scores.
2.3 Other questions
The Other questions were evaluated using the same methodology as the TREC 2003 definition ques-tions (Voorhees, 2003). A system’s response for an Other question is an unordered set of [doc-id,
answer-string] pairs as for list questions. Each string
is presumed to be a facet in the definition of the series’ target that had not yet been covered by ear-lier questions in the series. The requirement to not repeat information already covered by earlier ques-tions in the series made answering Other quesques-tions somewhat more difficult than answering TREC 2003 definition questions.
Judging the quality of the systems’ responses is done in two steps. In the first step, all of the answer strings from all of the systems’ responses are pre-sented to the assessor in a single list. Using these responses and the searches done during question de-velopment, the assessor creates a list of information nuggets about the target. An information nugget is an atomic piece of information about the target that
is interesting (in the assessor’s opinion) and is not part of an earlier question in the series or an answer to an earlier question in the series. An information nugget is atomic if the assessor can make a binary decision as to whether the nugget appears in a re-sponse. Once the nugget list is created for a target, the assessor marks some nuggets as vital, meaning that this information must be returned for a response to be good. Non-vital nuggets act as don’t care con-ditions in that the assessor believes the information in the nugget to be interesting enough that returning the information is acceptable in, but not necessary for, a good response.
In the second step of judging the responses, an assessor goes through each system’s response in turn and marks which nuggets appear in the response. A response contains a nugget if there is a conceptual match between the response and the nugget; that is, the match is independent of the particular wording used in either the nugget or the response. A nugget match is marked at most once per response—if the response contains more than one match for a nugget, an arbitrary match is marked and the remainder are left unmarked. A single [doc-id, answer-string] pair in a system response may match 0, 1, or multiple nuggets.
Given the nugget list and the set of nuggets matched in a system’s response, the nugget recall of a response is the ratio of the number of matched nuggets to the total number of vital nuggets in the list. Nugget precision is much more difficult to com-pute since there is no effective way of enumerat-ing all the concepts in a response. Instead, a mea-sure based on length (in non-white space charac-ters) is used as an approximation to nugget preci-sion. The length-based measure starts with an initial allowance of 100 characters for each (vital or non-vital) nugget matched. If the total system response is less than this number of characters, the value of the measure is 1.0. Otherwise, the measure’s value decreases as the length increases using the function
1− length−allowance
length . The final score for an Other
question is computed as the F measure with nugget recall three times as important as nugget precision:
F(β= 3) = 10×precision×recall 9×precision+recall .
mistakenly left unjudged, so the series was was re-moved from the TREC 2004 evaluation. This means final scores for runs were computed over 64 rather than 65 question series.
2.4 Per-series scores
In the TREC 2003 evaluation, the final score for a run was computed as a weighted average of the mean scores for different question types:
FinalScore = .5FactoidAccuracy+.25ListAveF
+.25DefinitionAveF.
Since each of the component scores ranges between 0 and 1, the final score is also in that range. The weights for the different components reflect the de-sire to emphasize factoid scores, since factoid tech-nology is the most mature, while still allowing other components to affect the final score. The specific weights used match this general objective, but are otherwise arbitrary. No experiments have been run examining the effect of different weights on the sta-bility of the final scores, but small perturbations in the weights should have little effect on the results.
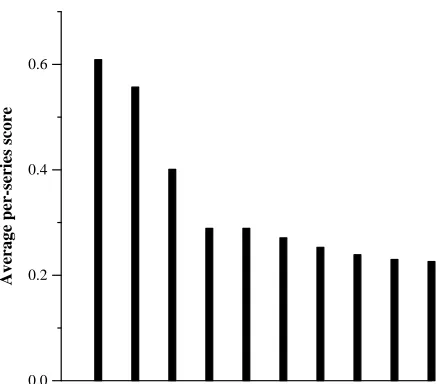
An individual question series also contains a mix-ture of different question types, so the weighted av-erage can be computed for an individual series rather than the test set as a whole. The mean of the per-series scores is then used as the final score for a run. We use the same weighted average as above to compute the score for an individual series that con-tains all three question types, using only the scores for questions belonging to that series in the compu-tation and using the Other question’s score in place of the average of definition questions scores. For those series that did not contain any list questions, the score was computed as .67FactoidAccuracy +
.33OtherF. Figure 2 shows the average per-series score for the best run for each of the top 10 groups that participated in TREC 2004.
3 Analysis of Per-series Evaluation
The main purpose of evaluations such as TREC is to provide system builders with the information needed to improve their systems. An informative evaluation must be reliable (i.e., the results must be trustwor-thy) as well as capture salient aspects of the real user task. This section first examines the user task
0.0 0.2 0.4 0.6
[image:5.612.318.539.50.242.2]Average per-series score
Figure 2: Average per-series scores for top ten QA track runs.
abstracted by the per-series evaluation, and then de-rives an empirical estimate of the reliability of the evaluation.
3.1 Modeling a User Task
The set of questions used to aggregate individual questions’ scores determines the emphasis of a QA evaluation. In the TREC 2003 combined task there were no series but there were different question types, so question scores were first averaged by question type and then those averages were com-bined. This strategy emphasizes question-type anal-ysis in that it is easy to compare different systems’ abilities for the different question types. The QA-CIAD challenge contained only a single question type but introduced a series structure into the test set (Kato et al., 2004). In QACIAD, the scores were aggregated over the series and the series scores averaged. The QACIAD series were specifically constructed to be an abstraction of an information seeker’s dialogue, and the aggregation of scores over series supports comparing different series types. For example, QACIAD results show browsing series to be more difficult than gathering series.
S1 S4 S8 S11 S15 S19 S23 S27 S31 S35 S39 S43 S47 S51 S55 S59 S63
0.0
0.2
0.4
0.6
[image:6.612.87.528.54.316.2]0.8
Figure 3: Box and whiskers plot of per-series scores across all TREC 2004 runs. The x-axis shows the series number and the y-axis the score.
each of the questions of the same type, while aggre-gating by series gives equal weight to each series. This is the same difference as between micro- and macro-averaging of document retrieval scores. For the set of runs submitted to TREC 2004, the abso-lute value of the final scores when aggregated by se-ries were generally somewhat greater than the final scores when aggregated by question type, though it is possible for the question-type-aggregated score to be the greater of the two. The relative scores for dif-ferent runs (i.e., whether one run was better than an-other) were usually, but not always, the same regard-less of which aggregation method was used. The Kendallτ (Stuart, 1983) measure of correlation be-tween the system rankings produced by sorting the runs by final score for each of the two aggregation methods was 0.971, where identical rankings would have a correlation of 1.0.
Despite the relatively minor differences in runs’ final scores when aggregating by series or by ques-tion type, there is a strong reason to prefer the series aggregation. An individual series is small enough to be meaningful at the task level (it represents a sin-gle user’s interaction) yet large enough for a series
score to be meaningful. Figure 3 shows a box-and-whiskers plot of the per-series scores across all runs for each series. A box in the plot shows the extent of the middle half of the scores for that series, with the median score indicated by the line through the box. The dotted lines (the “whiskers”) extend to a point that is 1.5 times the interquartile distance, or the most extreme score, whichever is less. Ex-treme scores that are greater than the 1.5 times the interquartile distance are plotted as circles. The plot shows that only a few series (S21, S25, S37, S39) have median scores of 0.0. This is in sharp con-trast to the median scores of individual questions. For the TREC 2004 test set, 212 of the 230 factoid questions (92.2%) have a zero median, 39 of 55 list questions (70.9%) have a zero median, and 41 of 64 Other questions (64.1%) have a zero median.
distri-bution of scores across runs for an individual topic is much the same as the distribution of scores for the individual series as in figure 3. Score distribu-tions that are heavily skewed toward zero make the evaluation look far more reliable than is likely to be the case since the reliability methodology computes a measure of the variability in scores.
3.2 Reliability
TREC uses comparative evaluations: one system is considered to be more effective than another if the evaluation score computed for the output of the first system is greater than the evaluation score computed for the output of the second system. Since all mea-surements have some (unknown) amount of error as-sociated with them, there is always a chance that such a comparison can lead to the wrong result. An analysis of the reliability of an evaluation establishes bounds for how likely it is for a single comparison to be in error.
The reliability analysis uses the runs submitted to the track to empirically determine the relationship among the number of series in a test set, the ob-served difference in scores (δ) between two runs, and the likelihood that a single comparison of two runs leads to the correct conclusion. Once estab-lished, the relationship is used to derive the mini-mum difference in scores required for a certain level of confidence in the results given that there are 64 series in the test set.
The core of the procedure for establishing the re-lationship is comparing the effectiveness of a pair runs on two disjoint, equal-sized sets of series to see if the two sets disagree as to which of the runs is better. We define the error rate as the percentage of comparisons that have such a disagreement. Since the TREC 2004 track had 64 series, we can directly compute the error rate for test sizes up to 32 series. The smallest test set used is five series since fewer than five series in a test set is too noisy to be infor-mative. By fitting curves to the values observed for test set sizes between 5 and 32, we can extrapolate the error rates to test sets up to 64 series.
When calculating the error rate, the difference be-tween two runs’ scores is categorized into a set of bins based on the size of the difference. The first bin contains runs with a difference of less than 0.01 (in-cluding no difference at all). The next bin contains
runs whose difference is at least 0.01 but less than 0.02. The limits for the remaining bins increase by increments of 0.01.
Each test set size from 5 to 32 is treated as a sep-arate experiment. Within an experiment, we ran-domly select two disjoint sets of series of the re-quired size. We compute the average series score over both sets for all runs, then count the number of times we see a disagreement as to which run is bet-ter for all pairs of runs using the bins to segregate the counts by size of the difference in scores. The entire procedure is repeated 50 times (i.e., we perform 50 trials), with the counts of the number of disagree-ments kept as running totals over all trials. The ratio of the number of disagreements observed in a bin to the total number of cases that land in that bin is the error rate for the bin.
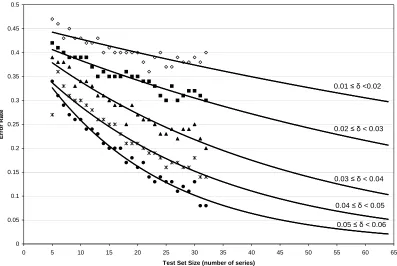
Figure 4 shows the error rate curves for five sep-arate bins. In the figure the test set size is plot-ted on the x-axis and the error rate is plotplot-ted on the y-axis. The individual points in the graphs are the data points actually computed by the procedure above, while the lines are the best-fit exponential curve for the data points in the current bin and ex-trapolated to size 64. The top curve is for the bin with0.01 ≤δ < 0.02and the bottom curve for the bin with 0.05 ≤ δ < 0.06; the intervening curves are for the intervening bins, in order with smaller
δ’s having larger error rates. An error rate no greater than 5%, requires a difference in scores of at least 0.05, which can be obtained with a test set of 47 se-ries. Score differences of between 0.04 and 0.05 (the fourth curve) have an error rate slightly greater than 5% when there are 64 series in the test set.
0 0.05 0.1 0.15 0.2 0.25 0.3 0.35 0.4 0.45 0.5
0 5 10 15 20 25 30 35 40 45 50 55 60 65
Test Set Size (number of series)
E
rr
o
r
R
a
te
0.01 <0.02
0.02 < 0.03
0.03 < 0.04
0.04 < 0.05
[image:8.612.109.506.47.313.2]0.05 < 0.06
Figure 4: Extrapolated error rates for per-series scores for different test set sizes.
between each of the first three runs and its next clos-est run is greater than 0.05, while the next five runs are all within 0.05 of one another.
4 Conclusion
Question series have been introduced into recent question answering evaluations as a means of mod-eling dialogues between questioners and systems. The abstraction allows researchers to investigate methods for answering contextualized questions and for tracking (some forms of) the way objects are re-ferred to in natural dialogues. The series have an important evaluation benefit as well. The individual series is at the correct level of granularity for aggre-gating scores for a meaningful evaluation. Unlike individual questions that have heavily skewed score distributions across runs, per-series score distribu-tions resemble the distribudistribu-tions of per-topic scores in document retrieval evaluations. This allows the methodology developed for assessing the quality of a document retrieval evaluation to be meaningfully applied to the per-series evaluation. Such an analy-sis of the TREC 2004 QA track per-series evaluation shows the evaluation results to be reliable for differ-ences in scores that are often observed in practice.
References
Tsuneaki Kato, Jun’ichi Fukumoto, Fumito Masui, and Noriko Kando. 2004. Handling information access di-alogue through QA technologies—A novel challenge for open-domain question answering. In Proceedings
of the HLT-NAACL 2004 Workshop on Pragmatics of Question Answering, pages 70–77, May.
Alan Stuart. 1983. Kendall’s tau. In Samuel Kotz and Norman L. Johnson, editors, Encyclopedia of
Statisti-cal Sciences, volume 4, pages 367–369. John Wiley &
Sons.
Ellen M. Voorhees and Chris Buckley. 2002. The effect of topic set size on retrieval experiment error. In
Pro-ceedings of the 25th Annual International ACM SIGIR Conference on Research and Development in Informa-tion Retrieval, pages 316–323.
Ellen M. Voorhees. 2003. Evaluating answers to defi-nition questions. In Proceedings of the 2003 Human
Language Technology Conference of the North Ameri-can Chapter of the Association for Computational Lin-guistics (HLT-NAACL 2003), Volume 2, pages 109–
111, May.
Ellen M. Voorhees. 2004. Overview of the TREC 2003 question answering track. In Proceedings of
the Twelfth Text REtrieval Conference (TREC 2003),