System Combination for Multi-document Summarization
Kai Hong Mitchell Marcus Ani Nenkova
University of Pennsylvania Philadelphia, PA, 19104
{hongkai1,mitch,nenkova}@seas.upenn.edu
Abstract
We present a novel framework of system combination for multi-document summarization. For each input set (input), we generate candidate summaries by combining whole sentences from the summaries generated by different systems. We show that the oracle among these candidates is much better than the summaries that we have combined. We then present a supervised model to select among the candidates. The model relies on a rich set of features that capture content importance from different perspectives. Our model performs better than the systems that we combined based on manual and automatic evaluations. We also achieve very competitive performance on six DUC/TAC datasets, comparable to the state-of-the-art on most datasets.
1 Introduction
Recent work shows that state-of-the-art summarization systems generate very different summaries, despite the fact that they have similar performance (Hong et al., 2014). This suggests that combining summaries from different systems might be helpful in improving content quality.
A handful of papers have studied system combination for summarization. Based on the ranks of the input sentences assigned by different systems (i.e., basic systems), methods have been proposed to re-rank these sentences (Wang and Li, 2012; Pei et al., 2012). However, these methods require the basic systems to assign importance scores to all input sentences. Thapar et al. (2006) combine the summaries from different systems, based on a graph-based measure that computes summary-input or summary-summary similarity. However, their method does not show
an advantage over the basic systems. In summary, few prior papers have successfully generating better summaries by combining the summaries from different systems (i.e.,basic summaries).
This paper focuses on practical system combination, where we combine the summaries generated by four portable unsupervised systems. We choose these systems, because: First, these systems are either off-the-shelf or easy-to-implement. Second, even though many systems have been proposed for multi-document summarization, the output of them are often available only on one dataset or even unavailable. Third, compared to more sophisticated supervised methods (Kulesza and Taskar, 2012; Cao et al., 2015a), simple unsupervised methods perform unexpectedly well. Many of them achieved the state-of-the-art performance when they were proposed (Erkan and Radev, 2004; Gillick et al., 2009) and still serve as competitive baselines (Hong et al., 2014).
After the summarizers have been chosen, we present a two-step pipeline that combines the basic summaries. In the first step, we generate combined candidate summaries (Section 4). We investigate two methods to do this: one uses entire basic summaries directly, the other combines these summaries on the sentence level. We show that the latter method has a much higher oracle performance. The second step includes a new supervised model that selects among the candidate summaries (Section 5).
Our contributions are:
• We show that by combining summaries on the sentence level, the best possible (oracle) performance is very high.
• In the second step of our pipeline, we propose a supervised model that includes a rich set of new features. These features capture content importance from different
perspectives, based on different sources. We verify the effectiveness of these features.
• Our method outperforms the basic systems and several competitive baselines. Our model achieves competitive performance on six DUC/TAC datasets, which is on par with the state-of-the-art on most of these datasets.
• Our method can be used to combine summaries generated by any systems.
2 Related Work
System combination has enjoyed great success in many domains, such as automatic speech recognition (Fiscus, 1997; Mangu et al., 2000), machine translation (Frederking and Nirenburg, 1994; Bangalore et al., 2001) and parsing (Henderson and Brill, 1999; Sagae and Lavie, 2006). However, only a handful of papers have leveraged this idea for summarization. Mohamed and Rajasekaran (2005) present a method that relies on a document graph (DG), which includes concepts connected by relations. This method selects among the outputs of the basic systems, based on their overlaps with the input in terms of DG. Thapar et al. (2006) propose to iteratively include sentences, based on the overlap of DG between the current sentence and (1) the original input, or (2) the basic summaries. However, in both papers, the machine summaries are not compared against human references. Rather, their evaluations compare the summaries to the input based on the overlap of DG. Moreover, even when evaluated in this way, the combined system does not show an advantage over the best basic system. System combination in summarization has also been regarded as rank aggregation, where the combined system re-ranks the input sentences based on the ranks of those sentences assigned by the basic systems. Wang and Li (2012) propose an unsupervised method to minimize the distance of the final ranking compared to the initial rankings. Pei et al. (2012) propose a supervised method which handles an issue in Wang and Li (2012) that all basic systems are regarded as equally important. Even though both methods show advantages over the basic systems, they have two limitations. Most importantly, only summarizers that assign importance scores to each sentence can be used as the input summarizers. Second, only the sentence scores (ranks) from the basic
systems and system identity information is utilized during the re-ranking process. The signal from the original input is ignored. Our method handles these limitations.
Our method derives an overall informativeness score for each candidate summary, then selects the one with the highest score. This is related to the growing body of research in global optimization, which selects the most informative subset of sentences towards a global objective (McDonald, 2007; Gillick et al., 2009; Aker et al., 2010). Some work uses integer linear programming to find the exact solution (Gillick et al., 2009; Li et al., 2015), other work employs supervised methods to optimize the ROUGE scores of a summary (Lin and Bilmes, 2011; Kulesza and Taskar, 2012). Here we use the ROUGE scores of the candidate summaries as labels while training our model.
In our work, we propose novel features that encode the content quality of the entire summary. Though prior work has extensively investigated features that are indicative of important words (Yih et al., 2007; Hong and Nenkova, 2014) or sentences (Litvak et al., 2010; Ouyang et al., 2011), little work has focused on designing global features defined over the summary. Indeed, even for the papers that employ supervised methods to conduct global inference, the features are defined on the sentence level (Aker et al., 2010; Kulesza and Taskar, 2012). The most closely related papers are the ones that investigated automatic evaluation of summarization without human references (Louis and Nenkova, 2009; Saggion et al., 2010), where the effectiveness of several summary-input similarity metrics are examined. In our work, we propose a wide range of features. These features are derived not only based on the input, but also based on the basic summaries and the summary-input pairs from the New York Times (NYT) corpus (Sandhaus, 2008).
3 Data and Evaluation
We conduct a large scale experiment on six datasets from the Document Understanding Conference (DUC) and the Text Analysis Conference (TAC). The tasks include generic (DUC 2001–2004) and query-focused (TAC 2008, 2009) multi-document summarization. We evaluate on the task of generating 100-word summaries.
evaluation, which compares the machine summaries to the human references. We report ROUGE-1 (unigram recall) and ROUGE-2 (bigram recall), with stemming and stopwords included.1 Among automatic evaluation metrics, ROUGE-1 (R-1) can predict that one system performs significantly better than the other with the highest recall (Rankel et al., 2013). ROUGE-2 (R-2) provides the best agreement with manual evaluations (Owczarzak et al., 2012). R-1 and R-2 are the most widely used metrics in summarization literature.
4 Generating Candidate Summaries We first introduce the four basic unsupervised systems, then describe our approach of generating candidate summaries. The four systems all perform extractive summarization, which directly selects sentences from the input. Among these systems, ICSISumm achieves the highest ROUGE-2 in the TAC 2008, 2009 workshops.2 The other systems are often used as competitive baselines; we implement these ourselves. Table 1 shows their performances. The word overlap between summaries generated by these systems is low, which indicates high diversity.
The basic systems are used for both generic and query-focused summarization. For the latter task, we filter out the sentences that have no overlap with the query in terms of content words for the systems that we implemented.
4.1 Four Basic Unsupervised Systems
ICSISumm: This system (Gillick et al., 2009) optimizes the coverage of bigrams weighted by their document frequency within the input using Integer Linear Programming (ILP). Even though this problem is NP-hard, a standard ILP solver can find the exact solution fairly quickly in this case.
Greedy-KL: This system aims to minimize the Kullback-Leibler (KL) divergence between the word probability distribution of the summary and that of the input. Because finding the summary with the smallest KL divergence is intractable, we employ a greedy method that iteratively selects an additional sentence that minimizes the KL divergence (Haghighi and Vanderwende, 2009).
1ROUGE version 1.5.5 with arguments: -c 95 -r 1000 -n
2 -2 4 -u -m -a -l 100 -x
2We use the toolkit provided via this link directly:
https://code.google.com/p/icsisumm/
ProbSum: This system (Nenkova et al., 2006) scores a sentence by taking the average of word probabilities over the words in the sentence, with stopwords assigned zero weights. Compared to Nenkova et al. (2006), we slightly change the way of handling redundancy: we iteratively include a sentence into the summary if its cosine similarity with any sentence in the summary does not exceed
0.5.3
LLRSum: This system (Conroy et al., 2006) employs a log-likelihood ratio (LLR) test to select topic words of an input (Lin and Hovy, 2000). The LLR test compares the distribution of words in the input to a large background corpus. Similar to Conroy et al. (2006), we consider words as topic words if their χ-square statistic derived by LLR exceeds 10. The sentence importance score is equal to the number of topic words divided by the number of words in the sentence. Redundancy is handled in the same way as in ProbSum.
4.2 Generating Candidate Summaries 4.2.1 Selecting a Full Summary
There does not exist a system that always outperforms the others for all problems. Based on this fact, we directly use the summary outputs (i.e., basic summaries) as the candidate summaries.
4.2.2 Sentence Level Combination
Different systems provide different pieces of the correct answer. Based on this fact, the combined summary should include sentences that appear in the summaries produced by different systems. Here we exhaustively enumerate sentences so that to form the candidate summaries. A similar approach has been used to generate candidate summaries for single-document summarization (Ceylan et al., 2010).
Let D = s1, . . . , sn denote the sequence of unique sentences that appear in the basic summaries. We enumerate all subsequencesAi =
si1, . . . , sik ofDin lexicographical order. Ai can
be used as a candidate summary iffPkj=1l(sij)≥
L and Pkj=1−1l(sij) < L, where l(s) is the
number of words in s and L is the predefined summary length. Table 2 shows the average number of (unique) sentences and summaries that are generated per input.
DUC 01 DUC 02 DUC 03 DUC 04 TAC 08 TAC 09
R-1 R-2 R-1 R-2 R-1 R-2 R-1 R-2 R-1 R-2 R-1 R-2
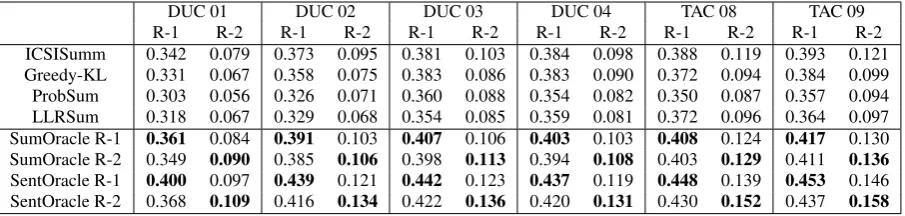
[image:4.595.74.527.62.170.2]ICSISumm 0.342 0.079 0.373 0.095 0.381 0.103 0.384 0.098 0.388 0.119 0.393 0.121 Greedy-KL 0.331 0.067 0.358 0.075 0.383 0.086 0.383 0.090 0.372 0.094 0.384 0.099 ProbSum 0.303 0.056 0.326 0.071 0.360 0.088 0.354 0.082 0.350 0.087 0.357 0.094 LLRSum 0.318 0.067 0.329 0.068 0.354 0.085 0.359 0.081 0.372 0.096 0.364 0.097 SumOracle R-1 0.361 0.084 0.391 0.103 0.407 0.106 0.403 0.103 0.408 0.124 0.417 0.130 SumOracle R-2 0.349 0.090 0.385 0.106 0.398 0.113 0.394 0.108 0.403 0.129 0.411 0.136 SentOracle R-1 0.400 0.097 0.439 0.121 0.442 0.123 0.437 0.119 0.448 0.139 0.453 0.146 SentOracle R-2 0.368 0.109 0.416 0.134 0.422 0.136 0.420 0.131 0.430 0.152 0.437 0.158
Table 1: The performance of the basic systems and the performance of the oracle systems based on the methods described in Section 4.2.1 and Section 4.2.2. The evaluation metric that each oracle optimizes is shown inBold.
Dataset # sents # unique # summaries # total
DUC 01 20.8 17.7 7498 224940
DUC 02 21.1 17.6 12048 710832
DUC 03 19.3 15.4 3448 103440
DUC 04 19.5 15.6 3270 163500
TAC 08 18.5 14.8 2436 107184
TAC 09 18.0 13.7 1328 63744
Table 2: Average number of sentences (# sents), unique sentences (# unique), candidate summaries per input (# summaries) and the total number of candidate summaries for each dataset (# total).
Note that we consider the order of sentences in
Ai(generated fromD) as a relatively unimportant factor. Though two summaries with the same set of sentences can have different ROUGE scores due to the truncation of the last sentence, because the majority of content covered is still the same, the difference in ROUGE score is relatively small. In order to generate other possible summaries, one needs to swap the last sentence. However, the total number of summaries per dataset is already huge (see Table 2). Therefore, we do not generate other candidate summaries, because it would cost much more additional space, while the difference in content is relatively small.
4.2.3 Comparison of the Oracle Systems
We examine the upper bounds of the two methods described in Section 4.2.1 and Section 4.2.2. For the first method, we design two oracle systems that pick the basic summary with the highest ROUGE-1 (R-1) and ROUGE-2 (R-2) (denoted as SumOracle R-1 and SumOracle R-2). For the second method, we design two oracle systems that pick the best summary in terms of R-1 and R-2 among the summary candidates (denoted as SentOracle R-1 and SentOracle R-2). As shown in
Table 1, the advantage of the first two oracles over ICSISumm is limited: on average0.021/0.006and
0.013/0.011(R-1/R-2). However, the advantage of the latter oracles over ICSISumm is much larger: on average 0.060/0.022 and 0.039/0.034
(R-1/R-2). Clearly, system combination is more promising if we combine the basic summaries at the sentence level. Therefore, we adopt the latter method to generate candidate summaries.
5 Features
We introduce the features used in our model that selects among the candidate summaries. Traditionally in summarization, features are derived based on the input (denoted as I). In our work, we propose a class of novel features that compares the candidate summary to the set of the basic summaries (denoted as H), where
H can be regarded as a hyper-summary of I. This excels in the way that it takes advantage of the consensus between systems. Moreover, we propose system identity features, which capture the fact that content from a better system should have a higher chance to be selected.
5.1 Summary Level Features
Summary level features directly encode the informativeness of the entire summary. Some of them are initially proposed in Louis and Nenkova (2013) that evaluates the summary content without human models. Different from them, the features in our work use not only I, but also H as the “input” (except for the redundancy features). “Input” refers toIorHin the rest of Section 5.
Distributional Similarity: These features compute the distributional similarity (divergence) between the n-gram (n = 1,2) probability distribution of the summary and that of the input (I or H). Good summaries tend to have high similarity and low divergence. We use three measures: Kullback-Leibler (KL) divergence, Jenson-Shannon (JS) divergence and cosine similarity.
LetP andQdenote the n-gram distribution of the summary and that of the input respectively. Let pλ(w) be the probability of n-gram w in distribution λ. The KL divergence KL(P k Q)
and the JS divergenceJS(P kQ)are defined as:
KL(P kQ) =X
w
pP(w)·logppQ(P(ww)) (1)
JS(PkQ) = 12KL(PkA) + 12KL(QkA) (2) where A is the average of P and Q. Noticing that KL divergence is not symmetric, both
KL(P k Q) and KL(Q k P) are computed. In particular, smoothing is performed while computingKL(Q k P), where we use the same setting as in Louis and Nenkova (2013).
Topic words: Good summaries tend to include more topic words (TWs). We derive TWs using the method described in the LLRSum system in Section 4.1. For each summaryS, we compute: (1) the ratio of the words that are TWs to all words inS; (2) the recall of TWs inS.
Sentence location: Sentences that appear at the beginning of an article are likely to be more critical. Greedy-based summarizers (ProbSum, LLRSum, GreedyKL) also select important sentences first. To capture these intuitions, we set features over the sentences in a summary (S) based on their locations. There are features that indicate whether a sentence in S has appeared as the first sentence in theinput. We also set features to indicate the normalized position of a sentence in the documents of an input: by assigning1 to the first sentence, 0 to the last sentence. When
one sentence appears multiple times, the earliest position is used. Features are then set on the summary level, which equal to the mean of their corresponding features on the sentence level over all sentences in the summaryS.
Redundancy: Redundancy correlates negatively with content quality (Pitler et al., 2010). To indicate redundancy, we compute the maximum and average cosine similarity of all pairs of sentences in the summaries. Summaries with higher redundancy are expected to score higher.
5.2 Word Level Features
Better summaries should include words or phrases that are of higher importance. Hence, we design features to encode the overall importance of unigrams and bigrams in a summary. We first generate features for the n-grams (n = 1,2) in a summary S, then generate the feature vector vS
forS. The procedure is as follows:
Let t denote the unigram or bigram in a summary. For eachtthat includes content words, we form vt, where each component of vt is an
importance indicator of t. If t does not include any content words, we setvt = 0. LetS0 denote
the unique n-grams in S and let L denote the summary length. We compute two feature vectors:
vS1 = ( P
t∈Svt)/L andvS2 = ( P
t∈S0vt)/L,
which are the coverage of n-grams by word token and word type, normalized by summary length. Finally, vS is formed by concatenating vS1 and
vS2 for unigrams and bigrams.
Below we describe the features invt. Similar
to Section 5.1, the features are computed based on both I andH. We also derive features based on summary-article pairs from the NYT corpus.
Frequency related features: For each n-gramt, we compute its probability, TF*IDF4, document frequency (DF) and χ-square statistic from LLR test. Another feature is set to be equal to DF normalized by the number of input documents. A binary feature is set to determine whether DF is at least three, inspired by the observation that document specific words should not be regarded as informative (Mason and Charniak, 2011).
It has been shown that unimportant words of an input should not be considered while scoring the summary (Gupta et al., 2007; Mason and Charniak, 2011). The features below are designed 4IDF is computed using the news articles between year
capture this. Let the binary functionb(t) denote whether or not t includes topic words (which approximate whether or not t is important), features are set to be equal to the product of the DF related features andb(t).
Word locations: The words that appear close to the beginning ofI orHare likely to be important. Here for each n-gram token, we compute its normalized locations in the documents. Then for each n-gram type t, we compute its first, average, lastandaverage firstlocation across its occurrences in all documents of aninput. Features are also set to determine whethert has appeared in the first sentence and the number of times t
appears in the first sentences of aninput.
Information density of the first sentence:
The first sentence of an article can be either informative or entertaining. Clearly, the words that appear in an informative first sentence should be assigned higher importance scores. To capture this, we compute the importance score (called information density in Yang and Nenkova (2014)) of the first sentence, that is defined as the number of TWs divided by the number of words in the sentence. For each t, we compute the maximal and average of importance scores over all first sentences thattappears in.
Global word importance: Some words are globally important (e.g., “war”, “death”) or unimportant (e.g., “Mr.”, “a.m.”) to humans, independent of a particular input. Hong and Nenkova (2014) proposed a class of methods to estimate the global importance of words, based on the change of word probabilities between the summary-article pairs from the NYT corpus. The importance are used as features for identifying words that are used in human summaries. Here we replicate the features used in that work, except that we perform more careful pre-processings. This class of features are set only for unigrams.
5.3 System Identity Features
For each basic system Ai, we compute the sentence and n-gram overlap between S and the summary from Ai (SAi). We hypothesize that
the quality (i.e., ROUGE score) of a summary is positively (negatively) correlated to the overlap between this summary and a good (bad) basic summary of the same input. We design six sentence and two word overlap features for each system, which leads to a total of32features.
Sentence overlap: LetD0,DAidenote the set of
sentences in S and SAi, respectively. For each
system Ai, we set a feature |D0TDAi|/|D0|.
We further consider sentence lengths. Let l(D)
denote the total length of sentences in setD, we set a featurel(D0TDAi)/l(D0)for each system
Ai. Lastly, we compute the binary version of
|D0TDAi|/|D0|.
Furthermore, we exclude the sentences that appear in multiple basic summaries fromD0, then
compute the three features above for the newD0.
System identity features might be more helpful in selecting among the sentences that are generated by only one of the systems.
N-gram overlap: We compute the fraction of n-gram (n =1,2) tokens inSthat appears inSAi.
The n-grams consisting of solely stopwords are removed before computation.
6 Baseline Approaches
We present three summary combination methods that are used as baselines:
Voting:We select sentences according to the total number of times that they appear in all basic summaries, from large to small. When there are ties, we randomly pick an unselected sentence. The procedure is repeated100times and the mean ROUGE score is reported.
Summarization from Summaries: We
directly run ICSISumm and Greedy-KL over the summaries from the basic systems.
Jensen-Shannon (JS) Divergence: We select among the pool of candidate summaries. The summary with the smallest JS divergence between the summary and (1) the input (JS-I), or (2) the hyper-summaries (JS-H) is selected. Summary-input JS divergence is the best metric to identify a better summarizer without human references (Louis and Nenkova, 2009).
7 Experiments and Results
7.1 Experiment Settings
We use the DUC 03, 04 datasets as training and development sets. The candidate summaries of these two sets are used as training instances. There are80input sets; each input includes an average of
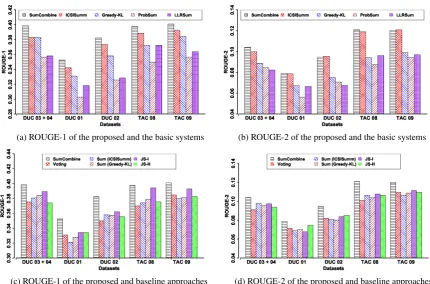
(a) ROUGE-1 of the proposed and the basic systems (b) ROUGE-2 of the proposed and the basic systems
[image:7.595.77.508.63.347.2](c) ROUGE-1 of the proposed and baseline approaches (d) ROUGE-2 of the proposed and baseline approaches Figure 1: ROUGE scores of different systems on the DUC 2001–2004 and TAC 2008, 2009 datasets
We choose ROUGE-1 (R-1) as training labels, as it outperforms using ROUGE-2 (R-2) as labels (see Table 3). We suspect that the advantage of R-1 is because it has higher sensitivity in capturing the differences in content between summaries.5
In order to find a better learning method, we have experimented with support vector regression (SVR) (Drucker et al., 1997)6 and SVM-Rank (Joachims, 1999).7 SVR has been used for estimating sentence (Ouyang et al., 2011) or document (Aker et al., 2010) importance in summarization. SVM-Rank has been used for ranking summaries according to their linguistic qualities (Pitler et al., 2010). In SVM-Rank, only the relative ranks between training instances of an input are considered while learning the model. Our experiment shows that SVR outperforms SVM-Rank (see Table 3). This means that it is useful to compare the summaries across different
5Recent methods that performs global optimization for
summarization mostly use R-1 while training (Lin and Bilmes, 2011; Kulesza and Taskar, 2012; Sipos et al., 2012).
6We use the SVR model in SVMLight (Joachims, 1999)
with linear kernel and default parameter settings when trained on R-1. When trained on R-2, we tunein loss function on the developmenet set, because the default setting assigns the same value to all data points.
7We use the SVM-Rank toolkit (Joachims, 2006) with
default parameter settings.
input sets and leverage the actual ROUGE scores.
Settings R-1 R-2
[image:7.595.345.490.420.475.2]SVR + R-1 0.3986 0.1040 SVR + R-2 0.3890 0.1023 SVMRank + R-1 0.3932 0.0996 SVMRank + R-2 0.3854 0.0982
Table 3: Performance on the development set with different models and training labels.
7.2 Comparing with the Basic Systems and the Baseline Methods
We evaluate our model on the development set and the test sets. As shown in Figure 1 (a) and Table 4, our model performs consistently better than all basic systems on R-1. It performs similar to ICSISumm and better than the other basic systems on R-2 (see Figure 1 (b) and Table 4).
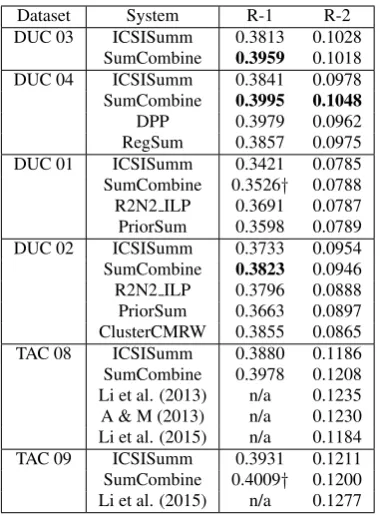
Dataset System R-1 R-2 DUC 03 ICSISumm 0.3813 0.1028
SumCombine 0.3959 0.1018 DUC 04 ICSISumm 0.3841 0.0978 SumCombine 0.3995 0.1048 DPP 0.3979 0.0962 RegSum 0.3857 0.0975 DUC 01 ICSISumm 0.3421 0.0785 SumCombine 0.3526† 0.0788 R2N2 ILP 0.3691 0.0787 PriorSum 0.3598 0.0789 DUC 02 ICSISumm 0.3733 0.0954 SumCombine 0.3823 0.0946 R2N2 ILP 0.3796 0.0888 PriorSum 0.3663 0.0897 ClusterCMRW 0.3855 0.0865 TAC 08 ICSISumm 0.3880 0.1186 SumCombine 0.3978 0.1208 Li et al. (2013) n/a 0.1235 A & M (2013) n/a 0.1230 Li et al. (2015) n/a 0.1184 TAC 09 ICSISumm 0.3931 0.1211 SumCombine 0.4009† 0.1200 Li et al. (2015) n/a 0.1277
Table 4: Performance comparison on six DUC and TAC datasets. Bold indicates statistical significant compared to ICSISumm (p < 0.05).
† indicates the difference is close to significant compared to ICSISumm (0.05≤p <0.1).
on the TAC 08 dataset. Our model (Combine) outperforms ICSISumm and Greedy-KL by0.019
and0.090, respectively (see Table 5).
Oracle Combine ICSISumm KL Pyr. score 0.626 0.549 0.530 0.459
Table 5: The Pyramid score on the TAC 08 data.
Figure 1 (c), (d) compare our model with the baseline approaches proposed in Section 6. The baselines that only consider the consensus between different systems perform poorly (voting, summarization on summaries, JS-H). JS-I has the best ROUGE-1 among baselines, while it is still much inferior to our model. Therefore, effective system combination appears to be difficult using methods based on a single indicator.
7.3 Comparing with the State-of-the-art
Table 4 compares our model (SumCombine) with the state-of-the-art systems. On the DUC 03 and 04 data, ICSISumm is among one of the best systems. SumCombine performs significantly better compared to it on R-1. We also achieve a better performance compared to the other top
performing extractive systems (DPP (Kulesza and Taskar, 2012), RegSum (Hong and Nenkova, 2014)) on the DUC 04 data.
On the DUC 01 and 02 data, the top performing systems we find are R2N2 ILP (Cao et al., 2015a) and PriorSum (Cao et al., 2015b); both of them utilize neural networks. Comparing to these two, SumCombine achieves a lower performance on the DUC 01 data and a higher performance on the DUC 02 data. It also has a slightly lower R-1 and a higher R-2 compared to ClusterCMRW (Wan and Yang, 2008), a graph-based system that achieves the highest R-1 on the DUC 02 data. On the TAC 08 data, the top performing systems (Li et al., 2013; Almeida and Martins, 2013) achieve the state-of-the-art performance by sentence compression. Our model performs extractive summarization, but still has similar R-2 compared to theirs.8 On the TAC 09 data, the best system uses a supervised method that weighs bigrams in the ILP framework by leveraging external resources (Li et al., 2015). This system is better than ours on the TAC 09 data and is inferior to ours on the TAC 08 data.
Overall, our combination model achieves very competitive performance, comparable to the state-of-the-art on multiple benchmarks.
At last, we compare SumCombine to SSA (Pei et al., 2012) and WCS (Wang and Li, 2012), the models that perform system combination by rank aggregation. The systems are evaluated on the DUC 04 data. In order to compare with these two papers, we truncate our summaries to 665 bytes and report F1-score. Pei et al. (2012) report the
performance on10 randomly selected input sets. In order to have the same size of training data with them, we conduct five-fold cross-validation.
System R-1 R-2 R-SU4
SumCombine 0.3943 0.1015 0.1411 SSA (Pei et al., 2012) 0.3977 0.0953 0.1394 WCS (Wang and Li, 2012) 0.3987 0.0961 0.1353
Table 6: Comparison with other combination methods on the DUC 04 dataset.
As shown in Table 6, SumCombine performs better than SSA and WCS on R-2 and R-SU4, but not on R-1. It is worth noting that these three 8These papers report ROUGE-SU4 (R-SU4) (measures
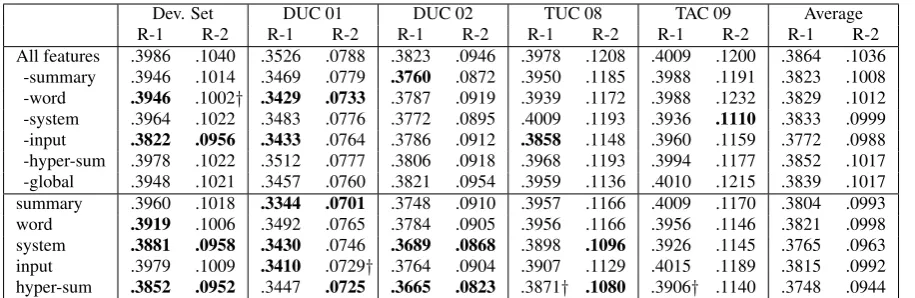
[image:8.595.87.278.60.318.2]Dev. Set DUC 01 DUC 02 TUC 08 TAC 09 Average
R-1 R-2 R-1 R-2 R-1 R-2 R-1 R-2 R-1 R-2 R-1 R-2
[image:9.595.73.531.61.210.2]All features .3986 .1040 .3526 .0788 .3823 .0946 .3978 .1208 .4009 .1200 .3864 .1036 -summary .3946 .1014 .3469 .0779 .3760 .0872 .3950 .1185 .3988 .1191 .3823 .1008 -word .3946 .1002† .3429 .0733 .3787 .0919 .3939 .1172 .3988 .1232 .3829 .1012 -system .3964 .1022 .3483 .0776 .3772 .0895 .4009 .1193 .3936 .1110 .3833 .0999 -input .3822 .0956 .3433 .0764 .3786 .0912 .3858 .1148 .3960 .1159 .3772 .0988 -hyper-sum .3978 .1022 .3512 .0777 .3806 .0918 .3968 .1193 .3994 .1177 .3852 .1017 -global .3948 .1021 .3457 .0760 .3821 .0954 .3959 .1136 .4010 .1215 .3839 .1017 summary .3960 .1018 .3344 .0701 .3748 .0910 .3957 .1166 .4009 .1170 .3804 .0993 word .3919 .1006 .3492 .0765 .3784 .0905 .3956 .1166 .3956 .1146 .3821 .0998 system .3881 .0958 .3430 .0746 .3689 .0868 .3898 .1096 .3926 .1145 .3765 .0963 input .3979 .1009 .3410 .0729† .3764 .0904 .3907 .1129 .4015 .1189 .3815 .0992 hyper-sum .3852 .0952 .3447 .0725 .3665 .0823 .3871† .1080 .3906† .1140 .3748 .0944 Table 7: Performance after ablating features (row 2–7) or using a single class of features (row 8–12).
Boldand†represent statistical significant (p <0.05) and close to significant (0.05≤p <0.1) compared to using all features (two-sided Wilcoxon test).
systems cannot be directly compared, because different basic systems are used. In fact, compared to SumCombine, SSA and WCS achieve larger improvements over the basic systems that are used. This might be because ranker aggregation is a better strategy, or because combining weaker systems is easier to result in large improvements.
7.4 Effects of Features
We conduct two experiments to examine the effectiveness of features (see Table 7). First, we remove one class of feature at a time from the full feature set. Second, we show the performance of a single feature class. Apart from reporting the performance on the development and the test sets, we also show the macro average performance across the five sets.9 This helps to understand the contribution of different features in general.
Summary level, word level and system identity features are all useful, with ablating them leads to an average of 0.0031 to 0.0041 decrease on R-1. Ablating summary and word level features can lead to a significant decrease in performance on some sets. If we use a single set of features, then the summary and word level features turn out to be more useful than the system identity features. The word and summary level features compute the content importance based on three sources: the input, the basic summaries (hyper-sum) and the New York Times corpus (global). We ablate the features derived from these three sources respectively. The input-based features are the most important; removing them leads to a very large 9We do not compute the statistical significance for the
average score.
decrease in performance, especially on R-1. The features derived from the basic summaries are also effective; even though removing them only lead to a small decrease in performance, we can observe the decrease on all five sets. Ablating global indicators leads to an average decrease of about
0.002on R-1 and R-2.
Interestingly, for the same feature class, the effectiveness vary to a great extent across different datasets. For example, ablating word level features decreases the R-2 significantly on the DUC 01 data, but increases the R-2 on the TAC 09 data. However, by looking at the average performance, it becomes clear that it is necessary to use all features. The features computed based on the input are identified as the most important.
8 Conclusion
In this paper, we present a pipeline that combines the summaries from four portable unsupervised summarizers. We show that system combination is very promising in improving content quality. We propose a supervised model to select among the candidate summaries. Experiments show that our model performs better than the systems that are combined, which is comparable to the state-of-the-art on multiple benchmarks.
Acknowledgements
References
Ahmet Aker, Trevor Cohn, and Robert Gaizauskas. 2010. Multi-document summarization using A* search and discriminative learning. InProceedings
of EMNLP, pages 482–491.
Miguel Almeida and Andr´e F.T. Martins. 2013. Fast and robust compressive summarization with dual decomposition and multi-task learning. In
Proceedings of ACL, pages 196–206.
Srinivas Bangalore, German Bordel, and Giuseppe Riccardi. 2001. Computing consensus translation from multiple machine translation systems. In
Proceedings of ASRU, pages 351–354.
Ziqiang Cao, Furu Wei, Li Dong, Sujian Li, and Ming Zhou. 2015a. Ranking with recursive neural networks and its application to multi-document summarization. In Proceedings of AAAI, pages 2153–2159.
Ziqiang Cao, Furu Wei, Sujian Li, Wenjie Li, Ming Zhou, and Houfeng Wang. 2015b. Learning summary prior representation for extractive summarization. In Proceedings of ACL: Short
Papers, pages 829–833.
Hakan Ceylan, Rada Mihalcea, Umut ¨Ozertem, Elena Lloret, and Manuel Palomar. 2010. Quantifying the limits and success of extractive summarization systems across domains. In Proceedings of ACL, pages 903–911.
John M. Conroy, Judith D. Schlesinger, and Dianne P. O’Leary. 2006. Topic-focused multi-document summarization using an approximate oracle score.
InProceedings of COLING/ACL, pages 152–159.
Harris Drucker, Chris J.C. Burges, Linda Kaufman, Alex Smola, Vladimir Vapnik, et al. 1997. Support vector regression machines. In Proceedings of NIPS, volume 9, pages 155–161.
Gunes Erkan and Dragomir R. Radev. 2004. Lexrank: graph-based lexical centrality as salience in text summarization. Journal of Artificial Intelligence
Research, 22(1):457–479.
Jonathan G. Fiscus. 1997. A post-processing system to yield reduced word error rates: Recognizer output voting error reduction (ROVER). InProceedings of ASRU, pages 347–354.
Robert Frederking and Sergei Nirenburg. 1994. Three heads are better than one. InProceedings of ANLP, pages 95–100.
Dan Gillick, Benoit Favre, Dilek Hakkani-Tur, Berndt Bohnet, Yang Liu, and Shasha Xie. 2009. The ICSI/UTD Summarization System at TAC 2009. In
Proceedings of TAC.
Surabhi Gupta, Ani Nenkova, and Dan Jurafsky. 2007. Measuring importance and query relevance in topic-focused multi-document summarization. In
Proceedings of ACL, pages 193–196.
Aria Haghighi and Lucy Vanderwende. 2009. Exploring content models for multi-document summarization. In Proceedings of HLT-NAACL, pages 362–370.
John C. Henderson and Eric Brill. 1999. Exploiting diversity for natural language processing: Combining parsers. In Proceedings of EMNLP, pages 187–194.
Kai Hong and Ani Nenkova. 2014. Improving the estimation of word importance for news multi-document summarization. In Proceedings of EACL, pages 712–721.
Kai Hong, John M. Conroy, Benoit Favre, Alex Kulesza, Hui Lin, and Ani Nenkova. 2014. A repositary of state of the art and competitive baseline summaries for generic news summarization. In
Proceedings of LREC, pages 1608–1616.
Thorsten Joachims. 1999. Making large-scale SVM learning practical. In B. Sch¨olkopf, C. Burges, and A. Smola, editors,Advances in Kernel Methods
- Support Vector Learning, chapter 11, pages
169–184. MIT Press, Cambridge, MA.
Thorsten Joachims. 2006. Training linear svms in linear time. InProceedings of KDD, pages 217–226.
Alex Kulesza and Ben Taskar. 2012. Determinantal point processes for machine learning. Foundations
and Trends in Machine Learning, 5(2–3).
Chen Li, Fei Liu, Fuliang Weng, and Yang Liu. 2013. Document summarization via guided sentence compression. InProceedings of EMNLP, pages 490–500.
Chen Li, Yang Liu, and Lin Zhao. 2015. Using external resources and joint learning for bigram weighting in ilp-based multi-document summarization. In Proceedings of NAACL-HLT, pages 778–787.
Hui Lin and Jeff Bilmes. 2011. A class of submodular functions for document summarization.
InProceedings of ACL, pages 510–520.
Chin-Yew Lin and Eduard Hovy. 2000. The automated acquisition of topic signatures for text summarization. InProceedings of COLING, pages 495–501.
Chin-Yew Lin. 2004. Rouge: A package for automatic evaluation of summaries. In Text Summarization Branches Out: Proceedings of the
ACL-04 Workshop, pages 74–81.
Marina Litvak, Mark Last, and Menahem Friedman. 2010. A new approach to improving multilingual summarization using a genetic algorithm. In
Annie Louis and Ani Nenkova. 2009. Automatically evaluating content selection in summarization without human models. InProceedings of EMNLP, pages 306–314.
Annie Louis and Ani Nenkova. 2013. Automatically assessing machine summary content without a gold standard. Computational Linguistics, 39(2):267–300.
Lidia Mangu, Eric Brill, and Andreas Stolcke. 2000. Finding consensus in speech recognition: word error minimization and other applications of confusion networks. Computer Speech & Language, 14(4):373–400.
Rebecca Mason and Eugene Charniak. 2011. Extractive multi-document summaries should explicitly not contain document-specific content.
In Proceedings of the Workshop on Automatic
Summarization for Different Genres, Media, and
Languages, pages 49–54.
Ryan McDonald. 2007. A study of global inference algorithms in multi-document summarization. In
Proceedings of ECIR, pages 557–564.
Ahmed A Mohamed and Sanguthevar Rajasekaran. 2005. A text summarizer based on meta-search. In
Proceedings of ISSPIT, pages 670–674.
Ani Nenkova, Lucy Vanderwende, and Kathleen McKeown. 2006. A compositional context sensitive multi-document summarizer: exploring the factors that influence summarization. In Proceedings of
SIGIR, pages 573–580.
Ani Nenkova, Rebecca Passonneau, and Kathleen McKeown. 2007. The pyramid method: Incorporating human content selection variation in summarization evaluation. ACM Transactions on
Speech and Language Processing (TSLP), 4(2):4.
You Ouyang, Wenjie Li, Sujian Li, and Qin Lu. 2011. Applying regression models to query-focused multi-document summarization. Inf. Process.
Manage., 47(2):227–237, March.
Karolina Owczarzak, John M. Conroy, Hoa Trang Dang, and Ani Nenkova. 2012. An assessment of the accuracy of automatic evaluation in summarization. In Proceedings of NAACL-HLT 2012: Workshop on Evaluation Metrics and System
Comparison for Automatic Summarization, pages
1–9.
Yulong Pei, Wenpeng Yin, Qifeng Fan, and Lian’en Huang. 2012. A supervised aggregation framework for multi-document summarization. InProceedings
of COLING, pages 2225–2242.
Emily Pitler, Annie Louis, and Ani Nenkova. 2010. Automatic evaluation of linguistic quality in multi-document summarization. In Proceedings of ACL, pages 544–554.
Peter A. Rankel, John M. Conroy, Hoa Trang Dang, and Ani Nenkova. 2013. A decade of automatic content evaluation of news summaries: Reassessing the state of the art. InProceedings of ACL, pages 131–136.
Kenji Sagae and Alon Lavie. 2006. Parser combination by reparsing. In Proceedings of
NAACL: Short Papers, pages 129–132.
Horacio Saggion, Juan-Manuel Torres-Moreno, Iria da Cunha, and Eric SanJuan. 2010. Multilingual summarization evaluation without human models.
InProceedings of COLING, pages 1059–1067.
Evan Sandhaus. 2008. The new york times annotated corpus. Linguistic Data Consortium, Philadelphia,
PA.
Ruben Sipos, Pannaga Shivaswamy, and Thorsten Joachims. 2012. Large-margin learning of submodular summarization models. InProceedings
of EACL, pages 224–233.
Vishal Thapar, Ahmed A Mohamed, and Sanguthevar Rajasekaran. 2006. Consensus text summarizer based on meta-search algorithms. In Proceedings
of ISSPIT, pages 403–407.
Xiaojun Wan and Jianwu Yang. 2008. Multi-document summarization using cluster-based link analysis. In
Proceedings of SIGIR, pages 299–306.
Dingding Wang and Tao Li. 2012. Weighted consensus multi-document summarization.
Information Processing & Management,
48(3):513–523.
Yinfei Yang and Ani Nenkova. 2014. Detecting information-dense texts in multiple news domains.
InProceedings of AAAI, pages 1650–1656.