A Methodology for Extrinsically Evaluating Information Extraction
Performance
Michael Crystal, Alex Baron, Katherine Godfrey, Linnea Micciulla, Yvette Tenney, and
Ralph Weischedel
BBN Technologies 10 Moulton St. Cambridge, MA 02138-1119
Abstract
This paper reports a preliminary study addressing two challenges in measuring the effectiveness of information extrac-tion (IE) technology:
• Developing a methodology for ex-trinsic evaluation of IE; and,
• Estimating the impact of improving IE technology on the ability to per-form an application task.
The methodology described can be em-ployed for further controlled experi-ments regarding information extraction.
1
Introduction
Intrinsic evaluations of information extraction (IE) have a history dating back to the Third Mes-sage Understanding Conference1 (MUC-3) and continuing today in the Automatic Content Ex-traction (ACE) evaluations.2 Extrinsic evalua-tions of IE, measuring the utility of IE in a task, are lacking and needed (Jones, 2005).
In this paper, we investigate an extrinsic evaluation of IE where the task is question an-swering (QA) given extracted information. In addition, we propose a novel method for explor-ing hypothetical performance questions, e.g., if IE accuracy were x% closer to human accuracy, how would speed and accuracy in a task, e.g., QA, improve?
1
For more information on the MUC conferences, see http://www.itl.nist.gov/iad/894.02/related_projects/muc/. 2
For an overview of ACE evaluations see http://www.itl.nist.gov/iad/894.01/tests/ace/.
We plot QA accuracy and time-to-complete given eight extracted data accuracy levels rang-ing from the output of SERIF, BBN’s state-of-the-art IE system, to manually extracted data.
2
Methodology
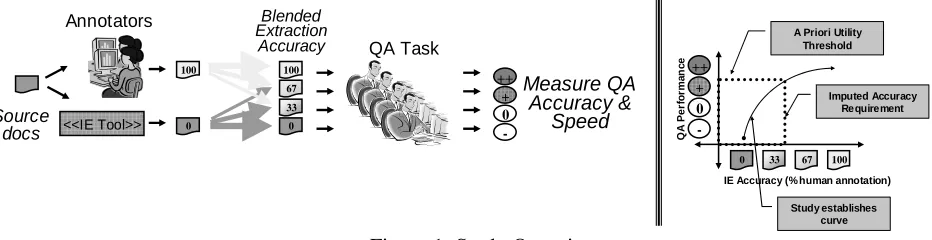
Figure 1 gives an overview of the methodol-ogy. The left portion of the figure shows source documents provided both to a system and a hu-man to produce two extraction databases, one corresponding to SERIF’s automated perform-ance and one corresponding to double-annotated, human accuracy. By merging por-tions of those two sources in varying degrees (“blends”), one can derive several extracted da-tabases ranging from machine quality, through varying percentages of improved performance, up to human accuracy. This method of blending databases provides a means of answering hypo-thetical questions, i.e., what if the state-of-the-art were x% closer to human accuracy, with a single set of answer keys.
A person using a given extraction database performs a task, in our case, QA. The measures of effectiveness in our study were time to com-plete the task and percent of questions answered correctly. An extrinsic measure of the value of improved IE technology performance is realized by rotating users through different extraction databases and questions sets.
human performance. ACE Value Scores3 were measured for each database. Pilot studies were conducted to develop questions for a QA task. Each participant answered four sets of questions, each with a different extraction database repre-senting a different level of IE accuracy. An an-swer capture tool recorded the time to anan-swer each question and additional data to confirm that the participant followed the study protocol. The answers were then evaluated for accuracy and the relationship between QA performance and IE quality was established.
Each experiment used four databases. The first ex-periment used databases spanning the range from solely machine extraction to solely human extraction. Based on the results of this experiment, two further experiments focused on smaller ranges in database quality to study the relationship between IE and QA performance.
2.1 Source Document Selection, Annota-tion, and Extraction
Source documents were selected based on the availability of manual annotation. We identified 946 broadcast news and newswire articles from recent ACE efforts, all annotated by the LDC according to the ACE guidelines for the relevant year (2002, 2003, 2004). Entities, relations, and within-document co-reference were marked. Inter-document co-reference annotation was added by BBN. The 946 news articles com-prised 363 articles (187,720 words) from news-wire and 583 (122,216 words) from broadcast news. With some corrections to deal with errors and changes in guidelines, the annotations were loaded as the human (DB-quality 100) database.
3
The 2004 ACE evaluation plan, available at
http://www.nist.gov/speech/tests/ace/ace04/doc/ace04-evalplan-v7.pdf, contains a full description of the scoring metric used in the evaluation. Entity type weights were 1 and the level weights were NAM=1.0, NOM=0.5, and PRO=0.1.
SERIF, BBN’s automatic IE system based on its predecessor, SIFT (Miller, 2000), was run on the 946 ACE documents to create the machine (DB-quality 0) database. SERIF is a statistically trained software system that automatically per-forms entity, co-reference, and relationship in-formation extraction.
Intermediate IE performance was simulated by blending the human and automatically gener-ated databases in various degrees using an inter-polation algorithm developed specifically for this study. To create a blended database, DB-quality n, all of the entities, relationships, and co-reference links common to the human and automatically generated databases are copied into a new one. Then, n% of the entity mentions in the human database (100), but not in the automatic IE system output (0), are copied; and, (100 – n)% of the entity mentions in the auto-matically generated database, but not in the hu-man database, are copied. Next, the relationships for which both of the constituent entity mentions have been copied are also copied to the blended database. Finally, co-reference links and entities for the already copied entity mentions are copied into the blended database.
For the first experiment, two intermediate ex-traction databases were created: DB-qualities 33 and 67. For the second experiment, two addi-tional databases were created: 16.5 and 50. The first intermediate databases were both created using the 0 and 100 databases as seeds. The 16.5 database was created by mixing the 0 and the 33 databases in a 50% blend. The 50 database was created by doing the same with the 33 and 67 databases. For Experiment 3, 41 and 58 data-bases were created by mixing the 33 and 50, and 50 and 67 databases respectively.
100
0
100 67 33 0
<<IE Tool>> Annotators
Source docs
++ + 0
-Blended Extraction
Accuracy
Measure QA Accuracy &
Speed
QA Task
Study establishes curve ++
+ 0
-100 67 33 0
Imputed Accuracy Requirement A Priori Utility
Threshold
QA
P
e
rf
o
rm
a
n
c
e
[image:2.612.68.534.54.174.2]IE Accuracy (% human annotation)
DB Blend
0
(Machine) 16.5 33 41 50 58 67
100 (Human)
Ent Rel Ent Rel Ent Rel Ent Rel Ent Rel Ent Rel Ent Rel Ent Rel
Recall 64 33 70 40 74 45 76 48 79 54 82 58 86 65 100 100
Pre. 74 50 77 62 79 67 80 70 83 75 85 78 89 82 100 100
Value 60 29 67 37 71 42 73 45 77 51 80 56 84 63 100 100
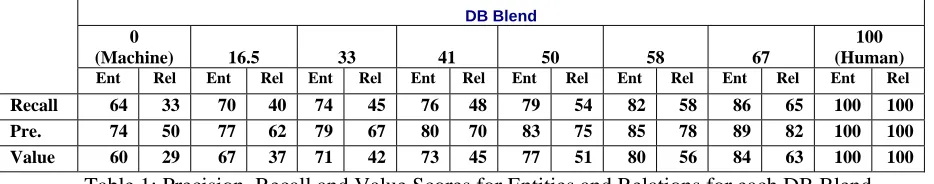
Table 1: Precision, Recall and Value Scores for Entities and Relations for each DB Blend
0
(Machine) 16.5 33 41 50 58 67
100 (Human)
Entities 17,117 18,269 18,942 19,398 19,594 19,589 19,440 18,687
Relations 6,684 6,675 6,905 7,091 7,435 7,808 8,406 11,032
[image:3.612.67.534.67.159.2]Descriptions 18,666 18,817 19,135 19,350 19,475 19,639 19,752 20,376
Table 2: Entity, Relation and Description Counts for each DB Blend
To validate the interpolation algorithm and blending procedure, we applied NIST’s 2004 ACE Scorer to the eight extraction databases. Polynomial approximations were fitted against both the entity and relation extraction curves. Entity performance was found to vary linearly with DB blend (R2 = .9853) and relation per-formance was found to vary with the square of DB blend (R2 = .9961). Table 1 shows the scores for each blend, and Table 2 shows the counts of entities, relationships, and descriptions.
2.2 Question Answering Task
Extraction effectiveness was measured by how well a person could answer questions given a database of facts, entities, and documents. Par-ticipants answered four sets of questions using four databases. They accessed the database using BBN’s FactBrowser (Miller, 2001) and recorded their answers and source citations in a separate tool developed for this study, AnswerPad.
Each database represented a different data-base quality. In some datadata-bases, facts were miss-ing, or incorrect facts were recorded. Consequently, answers were more accessible in some databases than in others, and participants had to vary their question answering strategy depending on the database.
Participants were given five minutes to an-swer each question. To ensure that they had ac-tually located the answer rather than relied on world knowledge, they were required to provide source citations for every answer. The
instruc-tions emphasized that the investigation was a test of the system, and not of their world knowl-edge or web search skills. Compliance with these instructions was high. Users resorted to knowledge-based proper noun searches only one percent of the time. In addition, keyword search was disabled to force participants to rely on the database features.
2.3 Participants
Study participants were recruited through local web lists and at local colleges and universities. Participants were restricted to college students and recent graduates with PC (not Mac) experi-ence, without reading disabilities, for whom English was their native language. No other screening was necessary because the design called for each participant to serve as his or her own control, and because opportunities to use world knowledge in answering the questions were minimized through the interface and pro-cedures.
2.4 Question Selection and Validation
Questions were developed over two months of pilot studies. The goal was to find a set of ques-tions that would be differentially supported by the 0, 33, 67, and 100 databases. We explored both “random” and “engineered” approaches. The random approach called for creating ques-tions using only the documents, without refer-ence to the kind of information extracted. Using a list of keywords, one person generated 86 questions involving relationships and entities pertaining to politics and the military by scan-ning the 946 ACE documents to find references to each keyword and devising questions based on the information she found.
The alternative, engineered approach involved eliminating questions that were not supported by the types of information extracted by SERIF, and generating additional questions to fit the desired pattern of increasing support with in-creased human annotation. This approach en-sured that the question sets reflected the structural differences that are assumed to exist in the database, and produced psychophysical data that link degree of QA support to human per-formance parameters. The IE results from four of the databases (0, 33, 67 and 100) were used to develop questions that received differential sup-port from the different quality databases. For example, such a question could be answered us-ing the automatically extracted results, but might be more straightforwardly answered given hu-man annotation.
Sixty-four questions, plus an additional ten practice questions, were created using the engi-neering approach. Additional criteria that were followed in creating the question sets were: 1) Questions had to contain at least one reasonable entry hook into all four databases, e.g., the terms U.S. and America were considered too broad to be reasonable; and, 2) For ease of scoring, list-type questions had to specify the number of an-swers required. Alternative criteria were consid-ered but rejected because they correlated with the aforementioned set. The following are ex-amples of engineered questions.
• Identify eight current or former U.S. State Department workers.
• In what two West Bank towns does Fatah have an office?
• Name two countries where Osama bin Laden has been.
• Were Lebanese women allowed to vote in municipal elections between two Shiite groups in the year 1998?
Two question lists, one with 86 questions generated by the random procedure and one with 64 questions generated by the engineered proce-dure, were analyzed with respect to the degree of support afforded by each of the four databases as viewed through FactBrowser. Four a priori cri-teria were established to assess degree of support – or its opposite, the degree of expected diffi-culty – for each question in each of the four da-tabases. Ranked from easiest to hardest, they are listed in Table 3.
The question can be answered…
1. Directly with fact or description (answer is highlighted in FactBrowser citation) 2. Indirectly with fact or description
(an-swer is not highlighted)
3. With name mentioned in question (long list of mentions without context)
4. Via database crawling
Table 3: A Priori Question Difficulty Character-istics, listed from easiest to hardest
Table 4 shows the question difficulty levels for both question types, for each of four data-bases. Analysis of the engineered set was done on all 64 questions. Analysis for randomly gen-erated questions was done on a random sample of 44 of the 86 questions. Fifteen questions did not meet the question criteria, leaving 29.
The randomly generated questions showed a statistically significant, but small, variation in expected difficulty, in part due to the number of unanswerable questions. While the questions were made up with respect to information found in the documents, the process did not consider the types of extracted entities and relations. This problem might have been mitigated by limiting the search to questions involving entities and relations that were part of the extraction task.
data-bases. The analysis confirms that the experimen-tal manipulation of different degrees of support provided by the four databases was achieved for this question set.
Random Question Generation
Difficulty Level (easiest to hardest)
0% Human
33% Human
67% Human
100% Human
1 Fact-Highlight
7 10 13 15
2 Fact-Indirect
14 10 8 10
3 Mention 3 5 2 1 4 Web Crawl 5 4 6 3
Total 29 29 29 29
Engineered Question Generation
Difficulty Level (from easiest to hardest)
0% Human
33% Human
67 Human
100% Human
1 Fact-Highlight
16 25 35 49
2 Fact-Indirect
23 20 18 14
3 Mention 7 14 11 1 4 Web Crawl 18 5 0 0
[image:5.612.68.296.105.416.2]Total 64 64 64 64
Table 4: Anticipated Difficulty of Questions as a Function of Database Quality
Preliminary human testing with both question sets suggested that the a priori difficulty indica-tors predict human question answering perform-ance. Experiments with the randomly generated questions, therefore, were unlikely to reveal much about the databases or about human ques-tion answering performance. On the other hand, an examination of how different levels of data-base quality affect human performance, in a psy-chophysical experiment where structure is varied systematically, promised to address the question of how much support is needed for good per-formance.
Based on the question difficulties, and pilot study timing and performance results, the 64 questions were grouped into four, 16-question balanced sets.
2.5 Procedure
Participants were tested individually at our site, in sessions lasting roughly four hours. Training prior to the test lasted for approximately a half hour. Training consisted of a walk-through of the interface features followed by guided prac-tice with sample questions. The test consisted of four question sets, each with a different data-base. Participants were informed that they would be using a different database for each question set and that some might be easier to use than others.
Questions were automatically presented and responses were captured in AnswerPad, a soft-ware tool designed for the study. AnswerPad is shown in Figure 2.
Key features of the tool include:
• Limiting view to current question set – disallowing participants to view previous question sets
• Automatically connecting to correct db
• Logging time spent on each question
• Enforcing five-minute limit per question
• Enforcing requirement that all answers in-clude a citation
Figure 2: AnswerPad Question Presentation and Answer Capture Interface
Participants were given written documenta-tion as part of their training. The participants were instructed to cut-and-paste question an-swers and document citations from source documents into AnswerPad.
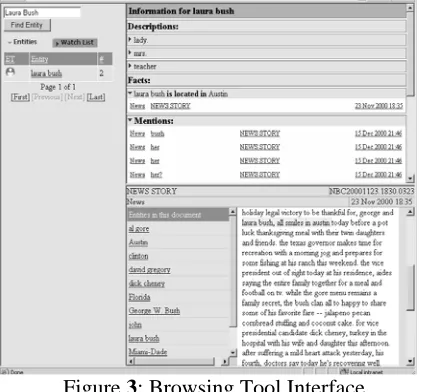
[image:5.612.332.548.289.537.2]is matched against the database of entity men-tions. The list of entities that have at least one mention partially matching the string are re-turned (e.g., “Laura Bush”) along with an icon indicating the type of the entity and the number of documents in which the entity appears. Clicking on the entity in the left panel causes the top right panel to display all of the descriptions, facts, and mentions for the entity. Selecting one of these displays citations in which the descrip-tion, fact, or mention occurs. Clicking on the citation opens up a document view in the lower right corner of the screen and highlights the ex-tracted information in the text. When a docu-ment is displayed, all of the entities detected in the document are listed down the left side of the document viewer.
Figure 3: Browsing Tool Interface
The browsing tool was instrumented to record command invocations so that the path a partici-pant took to answer a question could be recre-ated, and the participant’s adherence to protocol could be verified. Furthermore, the find function (Ctrl-F) was disabled to prevent users from per-forming ad hoc searches of the documents in-stead of using the extracted data.
The order of question sets and the order of da-tabase conditions were counterbalanced across participants, so that, for every four participants, every question set and database appeared once in every ordinal position, and every question set
was paired once with every database. This avoided carryover effects from question order.
2.6
Data Collected
Based on the initial results from Experiment 1, a 70% target effectiveness threshold was identi-fied to occur between the 33 and 67 database blends. To refine and verify this finding, Ex-periment 2 examined the 0, 16.5, 33, and 50 da-tabase blends. Experiment 3 examined the 33, 41, 50, and 58 database blends.
AnswerPad collected participant-provided an-swers to questions and the corresponding cita-tions. In addition, AnswerPad recorded the time spent answering the questions. A limit of five minutes was imposed based on pilot study re-sults. The browsing tool logged commands in-voked while the user searched the fact-base for question answers. Questions were manually scored based on the answers in the provided corpus. No partial credit was given. The maxi-mum score, for each database condition, was 16, for a total maximum score of 64.
3
Results
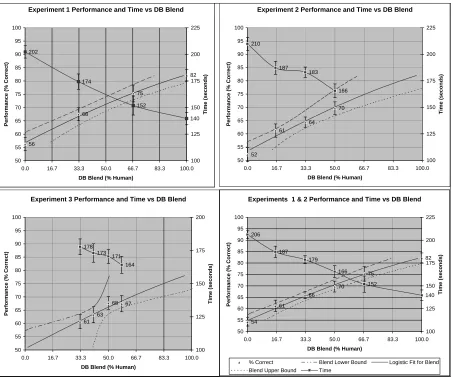
Figure 4 shows the question answer scores and times for each of the three individual ex-periments, and for Experiments 1 and 2 com-bined. Database quality affects both task speed (downward-sloping line) and task accuracy (up-ward-sloping line) in the expected direction. A logistic fit, as for a binary-response curve, was used to fit the relationship between blend per-centage and accuracy in each experiment. The logistic fit Goodman-Theil quasi-R2 was .9973 for Experiment 1, .9594 for Experiment 2, .8936 for Experiment 3, and .9959 for Experiments 1 and 2 combined.
Experiment 1 Performance and Time vs DB Blend 56 68 75 82 202 174 152 140 50 55 60 65 70 75 80 85 90 95 100
0.0 16.7 33.3 50.0 66.7 83.3 100.0
DB Blend (% Human)
Pe rf or m a nc e (% Cor re c t) 100 125 150 175 200 225 Ti m e ( s e c onds )
Experiment 2 Performance and Time vs DB Blend
52 61 64 70 210 187 183 166 50 55 60 65 70 75 80 85 90 95 100
0.0 16.7 33.3 50.0 66.7 83.3 100.0
DB Blend (% Human)
P e rf or m a nce (% Cor re ct ) 100 125 150 175 200 225 Ti m e (s e cond s)
Experiment 3 Performance and Time vs DB Blend
61 63 68 67 173 171 164 178 50 55 60 65 70 75 80 85 90 95 100
0.0 16.7 33.3 50.0 66.7 83.3 100.0
DB Blend (% Human)
Pe
rfo
rma
n
ce (% C
o rre ct ) 100 125 150 175 200 Ti m e (s ec onds )
Experiments 1 & 2 Performance and Time vs DB Blend
54 61 66 70 75 82 206 187 179 166 152 140 50 55 60 65 70 75 80 85 90 95 100
0.0 16.7 33.3 50.0 66.7 83.3 100.0
DB Blend (% Human)
Pe rf or m a nc e (% Cor re c t) 100 125 150 175 200 225 Ti m e ( s e c onds )
[image:7.612.81.534.52.429.2]% Correct Blend Lower Bound Logistic Fit for Blend Blend Upper Bound Time
Figure 4QA Performance (upward-sloping) and QA Time (downward-sloping) vs. Extraction Blend
Error Bars are Plus/Minus Standard Error of Mean (SEM) Within Each Blend
Upper and Lower Bounds Are Approximate 95% Confidence Intervals Based on the Logistic Fit For the Blend (X) to Produce a Given Performance (Y)
(Read these bounds horizontally, as bounds on X, with the upper bound to the right of the lower bound.)
The downward-sloping line in each graph displays the average time to answer a question as a function of the extraction blend. For this analysis we used strict time, the time it took the participant to answer the question if he or she answered correctly, or the full 5 minutes allowed for any incorrectly answered question. This ad-dresses the situation where a person quickly an-swers all of the questions incorrectly. The average question-answer time drops 32% as one moves from a machine generated extraction da-tabase to a human generated dada-tabase. A straight-line fit to the Experiment 1 and 2 com-bined data predicts a drop of 6.5 seconds as the human proportion of the database increases by 10 percentage points.
Experiment QA Performance
Strict Time
1
F(3,57) = 30.98,P < .0001
F(3, 57) = 28.36 P < .0001
2
F(3,57)= 19.32,P < .0001
F(3, 57) = 15.37, P < .0001
3
F(3,69)= 2.023,P = .1187
F(3,69)= 1.053, P = .3747
Table 5: ANOVA Analyses for QA Performance Expt. 1 used db blends of 0, 33, 67, and 100% Expt. 2 used db blends of 0, 16.5, 33, and 50% Expt. 3 used db blends of 33, 41, 50, and 58%
In Experiment 1, Newman-Keuls contrasts indicate that the 0, 33, 67, and 100 databases differ significantly (P < .05) on their impact on QA quality. For Experiment 2, however, the 16.5 and 33 database qualities were not shown to be different, nor were any of the database blends in Experiment 3. The data suggest that nearly half the improvement in QA quality from 0 to 100 occurs by the 33 database blend, and more than half the improvement in QA quality from 0 to 50 occurs by the 16.5 blend: a little “human” goes a long way. Experiment 3 suggests that small differences in data blends make no practi-cal difference in the results. Alternatively, there might be real differences that are small enough such that a larger number of participants would be required to detect them. Experiment 3 also had two participants with atypical patterns of QA against blend, which might account for the failure to detect a difference between the 33 and 50 or 58 blends as suggested by the results from Experiment 2. Furthermore, larger experiments could reveal whether the atypical participants were representatives of a subpopulation, or sim-ply outliers. Bearing the possibility of outliers in mind, we used the combination of Experiments 1 and 2 for the combined logistic analysis.
4
Conclusions
We presented a methodology for assessing in-formation extraction effectiveness using an ex-trinsic study. In addition, we demonstrated how a novel database blending (merging) strategy allows interpolating extraction quality from automated performance up through human accu-racy, thereby decreasing the resources required to conduct effectiveness evaluations.
Experiments showed QA accuracy and speed increased with higher IE performance, and that the database blend percentage was a good proxy for ACE value scores. We emphasize that the study was not to show that IE supports QA bet-ter than other technologies, rather to isolate util-ity gains due to IE performance improvements.
QA performance was plotted against human-machine IE blend and, for example, 70% QA performance was achieved with a database blend between 41% and 46% machine extraction. This corresponded to entity and relationship value scores of roughly 74 and 47 respectively.
The logistic dose-response model provided a good fit and allowed for computation of confi-dence bounds for the IE associated with a par-ticular level of performance. The constraints imposed by AnswerPad and FactBrowser en-sured that world knowledge was neutralized, and the repeated-measures design (using participants as their own controls across multiple levels of database quality) excluded inter-participant vari-ability from experimental error, increasing the ability to detect differences with relatively small sample sizes.
Acknowledgement
This material is based upon work supported in part by the Department of the Interior under Contract No. NBCHC030014. Any opinions, findings and conclusions or recommendations expressed in this material are those of the au-thors and do not necessarily reflect the views of the Department of the Interior.
References
S. Miller, H. Fox, L. Ramshaw, and R. Weischedel, "A Novel Use of Statistical Parsing to Extract In-formation from Text", in Proceedings of 1st Meet-ing of the North American Chapter of the ACL, Seattle, WA., pp.226-233, 2000.
S. Miller, S. Bratus, L. Ramshaw, R. Weischedel, and A. Zamanian. "FactBrowser Demonstration", Hu-man Language Technology Conference, San Diego, 2001.