Velocity Measurement System for Small Caliber
Projectiles
G. S. Gill and Amod Kumar
Abstract - The use of state of art instrumentation systems to measure high-speed events has increased tremendously in the past few decades. The current study aimed at measuring the velocity of small caliber projectiles within the desired limits of accuracy. The velocity of the projectile is calculated by dividing the distance between two downrange measurement locations, by the difference of the time when the projectile arrives at these locations. The work comprised of development and testing of a signal conditioning circuitry to process the signals received at the two downrange locations. The system thus developed measures the velocity of the projectiles of different calibers, traveling at the speeds varying from 397m/s to 912m/s, within accuracy limits of ±1%.
Index terms - Projectile, laser, small caliber, velocity measurement.
I. INTRODUCTION
The use of state of art instrumentation systems to measure high-speed events has increased in the past few decades. Various types of existing methods to measure velocity, currently in operation, are capable of working under different test conditions and environmental settings. The spectrum of high-speed measurement techniques is so broad that five to six orders of magnitudes separate the low and ultra high-speed ranges. At the lower end of the scale, applications include sports-events and training aids in addition to measurement of mechanical vibrations and rotations. There is a wide range of equipments and techniques used in this range, but when one moves toward the higher end of the spectrum the techniques and the applications are altogether different from those conventionally used for measurement of velocity at the lower end of the spectrum. Techniques to measure velocity in the ultra-high range are used in detonation physics to determine detonation velocities, ballistic and forensic applications. Such types of instruments are of strategic importance and western countries like USA and European nations are using these instruments, developed in–house, for testing the velocity of small caliber projectiles. But, a few agencies are manufacturing such type of instruments in India due to its specific and strategic nature and low volume requirements.
Though the principle is same, all innovation lies in the methodology adopted to capture the signal. Prior to this, instrumentation systems based on break-paper, break-wire, photoelectric, inductance and photographic techniques have been developed. When the break wire method is used, stretching before breaking is the cause of error in the final results; while in break paper instruments, bulging of paper before tearing leads to erroneous read-out. Hence, the recorded data reflects the pretest position plus an increment that is random and non-repeatable. This led to an unknown
Manuscript received January 23, 2008.
G. S. Gill is with the Institute of Instrumentation Engineering, Kurukshetra University, Kurukshetra, Haryana, India. (phone: +91-99920-13130; e-mail: gaganssgill@ yahoo.co.in).
Amod Kumar is with Central Scientific Instruments Organisation, Sector 30, Chandigarh.
error because only a set length (measured between the sensors) is used in the velocity calculations. Using the present technique, one can precisely determine the time of arrival at the point of interest and hence velocity.
II. EXPERIMENTAL SET-UP
The set up measures the velocity of a projectile primarily by measuring the time taken by the projectile to travel a well-defined distance between the two channels, i.e. start and stop channels. As evident from Fig 1, using the separation between the channels and the time of flight the speed can easily determined. The system measures the velocity of a projectile going by the basic definition of the velocity as,
t
S
V
=
where,
V - Velocity
S - Distance between the channels, and
[image:1.612.314.537.373.523.2]t - Time taken by projectile to cover the distance between the channels.
Fig. 1. Experimental Set-up
The velocity-measurement system depends on the interruption (or occultation) of laser beam by the projectile. As the projectile passes between a laser source and a detector, it casts a shadow on the detector. A laser and a detector are fitted near the entry and exit ports, i.e. top and bottom edges, on one of the channels. Each of the two vertical parallel columns constituting the channels contain a number of right-angled prisms. Without the presence of any obstruction, the laser beam is reflected back and forth by the retro reflecting right angle prisms while being laterally displaced till it falls on the light detector, thus, virtually forming a laser screen or a curtain. Any object, moving or stationary, passing through the laser screen obstructs the beam from reaching the detector as shown in Fig 2.
1. Laser power supply 2. Laser module 3. Beam expander 4. Laser beam
5. Retro-reflecting prisms 6. Projectile
[image:2.612.72.282.50.238.2]7. Photodiode and collector lens 8. Signal conditioning unit 9. Computer
Fig. 2. Systematic block diagram
their hypotenuse faces parallel is a very challenging task and called for evolving new technique. Mechanical design is also fairly complicated since the system should be able to withstand the shock wave traveling when a projectile at a high velocity passes through it.
III. METHODOLOGY
[image:2.612.316.540.481.697.2]System operation is quite simple and involves peculiarities that arise owing to high speed measuring applications. As the projectile approaches the first channel, it casts a shadow on the active area of the detector. The detector output—held at a constant level till this instant— begins to decrease. As the projectile reaches dead center of the first channel, the detector output drops to its lowest level. As the projectile leaves the first channel, the detector output increases. As the projectile approaches the second channel, the same sequence occurs. Detector output changes from both sensors are captured on an oscilloscope or data acquisition system. By correlating the time between the two peaks and the known distance (set position) between the channels, the velocity of the projectile is determined. To develop the circuit for the processing the low magnitude signals received from the two photo detectors the circuit was realized using the block diagram shown in Fig.3.
Fig. 3. Block diagram – Signal Conditioning Unit
The photodiode outputs a current signal that is proportional to the light intensity falling on its active area. This current signal is converted to a constant voltage level [1]. There is a change in the light intensity falling on the active area of the photodiode voltage when there is any obstruction between the source and the detector due to the shading caused by the obstructing particle on the detector. This change in the light intensity on the active area of the detector is the signal of interest in this particular problem.
This signal is processed in a number of stages [2]. Firstly it is amplified in three stages. At the outputs of each of these amplifiers a capacitor is put into the circuit that filters out the DC component of the signal and only signal information is passed to input of next stage. Then the signal is compared with a fixed reference level using comparator. From here onwards the system switches over to digital signals at TTL level. Monoshot multivibrator was used to latch the comparator signal of first channel. In a similar fashion second channel monoshot multivibrator latches the signal. The signal from the start channel is used to set the D-flip-flop and that from the stop channel to reset the flip-D-flip-flop. The gating pulse thus received is fed to the timer that is interfaced with the computer. In this way velocity measurement is accomplished.
Optimizing the photodiode-based preamplifiers is probably one of the most challenging aspects, especially at high speeds. The current signal received as the photo detector output is converted into a voltage signal by an operational amplifier wired in the current to voltage configuration. Under conditions of standard illumination the I/V converter gave constant voltage output of – 2.25V. Since the signal was of low amplitude, another amplifier in the inverting mode having the gain of 2 was added. It was ensured that the power supply connections to the amplifier maintained low impedance to the ground over a bandwidth of 40MHz or more, especially when driving significant capacitive and resistive loads, since all the current delivered to the load comes from power supplies. So multiple bye-pass capacitors were used, generally 0.1µF ceramic and 2.2µF electrolytic in combination.
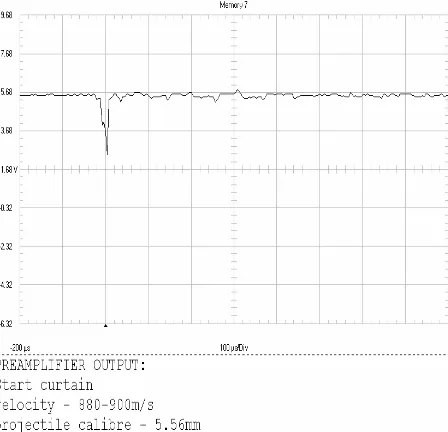
The output of the preamplifier, generally a constant voltage signal, when uninterrupted, undergoes an abrupt change when a projectile causes any shading on the photodiode due to the change in the illumination level at the detector. The signal received at the output of the start curtain preamplifier is shown in Fig. 4. When the projectile passes in front of the detector the light intensity from the laser source is reduced thus we get a drop in the constant voltage level.
Fig. 4. Preamplifier output
[image:2.612.73.299.525.608.2]event took place, while after the event, it takes a large amount of time to settle between an acceptable tolerance band. The presence of this disturbance signal can be attributed to various parameters like, the reflections taking place from the projectile, on the walls and the objects closer to the laser screen, absence of proper grounding and shielding techniques as the circuit was a wired one in the preliminary stage [3]. Pressure jacket surrounding the projectiles at sonic and supersonic speeds could also be a potential source of strong momentarily vibrations in the optical channel assembly. Lastly, since both the channels - start and stop – are also physically very close too each other, the optical coupling or interference could also exist between them.
[image:3.612.317.538.51.278.2]The signal from the preamplifier was further amplified and an amplifier was introduced into the circuit in the inverting configuration, as a differential amplifier (Herein referred to as Diff. Amplifier - 1) with a gain of 10. The output signal from this amplifier was analyzed with projectiles moving with different velocities ranging from 397 - 912 m/s. In this case, the noise signals are also amplified by the same factor as the information signal, but the signal of the projectile is sufficiently high (Fig. 5), attaining the saturation level, and is clearly distinguishable from other spurious signals. In some cases (Fig 6), it was, however, observed that the signal from the projectile, though being significantly high in magnitude compared to spurious signals, was not much intense and pronounced as in Fig. 5. In order to make these signals more clearly distinguishable a blocking capacitor and one more stage of the differential amplifier (Herein referred to as Diff. Amplifier – 2) in non-inverting mode was introduced into the circuit. Now, at the output of this differential amplifier a signal going from negative saturation level to positive saturation level was received every time any projectile shaded the detector. So the trigger threshold is adjusted such that it is minimum 1.0V above the interference signals and also at least 0.5V below the height of the useful signal.
Fig. 5. Diff. Amplifier – 1 Output
Fig. 6. Comparator and Diff. Amplifier – 1 Output
[image:3.612.71.305.462.714.2]Fig. 7. Comparator outputs of Start & Stop Channels
Fig. 8. Monoshot outputs of both the channels
It was observed from the monoshot outputs that when the projectile passing through it triggers one of the channels, a signal in the form of small kink is received at the other channel as well (Fig. 8) This noise may be due to the fact that first channel ground plane becomes noisy and since the grounds of both channels are common this noise is coupled to the second channel (assuming the optical coupling to be NIL in all cases). This took place because when the projectile triggers the start channel its ground gets corrupted and remains corrupted till the projectile reaches the stop channel. As mentioned above there is a burst of oscillations at the pre-amplifier output after the event takes place, which take nearly 700µs to damp out. In this case we
are getting the second signal at about 300 µs after the first signal and the circuit ground still being in the corrupted state. Under these conditions, when the projectile reaches the stop channel the ground is still corrupted and the signal from second channel is buried into a burst of noise pulses in which any of the pulse can be taken as signal pulse by comparator, which further triggered the monoshot leading to faulty determination of time interval between two pulses, and hence the velocity. To eliminate the ground coupling between the two channels, i.e. start and stop, the grounds as well as power supplies of both the channels were separated. Again testing the circuit, it was observed that though the signal after the preamplifier stage was clean enough, noise increased after the difference amplifier stages and the comparator further worsened the conditions. Keeping in view the processing of signals of extremely small magnitude being handled in this case, that are highly prone to the noise, some special considerations were taken into account while wiring such circuits and designing their printed circuit boards. One such approach followed was to provide maximum ground plane in the empty areas of the PCB in addition to provide guard rings at the input pins of the operational Amplifiers [4], [5].
Finally, the two channels were isolated to remove the ground coupling using an opto isolator. This was done so that the signal on the output side is entirely isolated and floating relative to signal on the input side of the barrier. Using the TTL compatible opto isolator, the comparator was eliminated from the line. The analog signal at the input of isolator was converted into a TTL pulse at its output. The opto isolator output is fed to the monoshots and the rest of the circuitry remained the same as in the earlier case except for the minor modifications that were being done to make the opto isolator compatible to the circuit. The waveforms observed at different stages of the circuit are shown in Fig. 9. It can be observed that on isolating start and stop channels, the noise and spurious signals are reduced to a large extent.
[image:4.612.315.541.473.716.2]The outputs of both the monoshots were used to set and then reset the D-type flip-flop, thus giving a square pulse of the time duration proportional to the time interval between two monoshot pulses received. This gating pulse when given to the programmed timer circuitry can be used to calculate the velocity of the projectile.
IV. CONCLUSIONS
The present system measured the velocity of small caliber projectiles, traveling at speeds varying from 397m/s to 912m/s, within an accuracy band of ±1%. The system gave satisfactory results with projectiles of different calibers. One of the most critical aspects of the design were its rigidity and ruggedness. It was ensured that all the assembly was rigid enough to withstand the shock waves, apparently attached to the forward tip of the projectiles moving at high speeds.
The accuracy and repeatability of the system can be further improved by the following modifications:
• By increasing the physical separation between the start and the stop screens, the pulse width can be increased and using the wider pulse better accuracy can be achieved. Thus, increasing the distance between the screens beyond 250mm more accuracy may be achieved.
• By increasing the distance between the screens the optical cross interference can be reduced. Since the channels are too close to each other there is a chance of interference of one source of light radiation with the detector of the other channel.
• The reflections from the metallic parts of the assembly can be greatly reduced by painting the frame with black paint, thus avoiding spurious signals arising as a result of reflections.
Further improvements in the existing design can be made by adding one more channels between the start and stop channels and simultaneous velocity measurement of the same projectile can be done, generating two or more data for a single event. Finally, the velocity can be calculated from the mathematical mean of these measurements.
REFERENCES
[1] S. Jain and D. R. Choudhury, “Linear Integrated Circuits”, New Age International, New Delhi, 2000. [2] R. Gayakwad, “Op-amps and Linear Integrated
Circuits”, PHI, New Delhi, 2000.
[3] K. S. Rajashekara, “Noise Reduction Methods In Electronic Equipments”, CEDT–IISc, Bangalore, April 1987.
[4] Kester Walt, “High Speed Design Techniques”, Analog Devices, Inc., USA, 1996.