J Neurophysiol. 2014 Nov 1; 112(9): 2316–2331.
Published online 2014 Aug 13. doi: 10.1152/jn.00583.2013
PMCID: PMC4274931 The irregular firing properties of thalamic head direction cells mediate turn-specific modulation of the directional tuning curve
Marian Tsanov,1,2Ehsan Chah,1,3Muhammad S. Noor,3Catriona Egan,3Richard B. Reilly,1,3John P. Aggleton,4Jonathan T.
Erichsen,5Seralynne D. Vann,4 and Shane M. O'Mara 1,2
Author information ► Article notes ► Copyright and License information ►
Abstract
HEAD DIRECTION (HD) cells in anterior thalamus express a wide range of interspike intervals (ISIs) (Taube 2010). Given the importance of HD encoding for spatial navigation in the environment, it is crucial to understand whether intrinsic biophysical properties mediate the shape of directional tuning curves. Here we ask how ISI patterns affect the formation of the HD tuning curve in the horizontal plane. ISI variability is evaluated by the coefficient of variation; high values reflect an irregular pattern of the spikes (Softky and Koch 1993). ISI
variability is very sensitive to the mean firing rate (Holt et al. 1996; Softky and Koch 1993); however, large ISIs as part of intertrain analyses are not simply noise around the mean firing rate but reflect characteristics of the membrane potential (Angelo and Margrie 2011). To investigate the functional relation between ISI diversity and separation angle, we use a single-cell Hodgkin-Huxley-type model to simulate ISI patterns ranging from
irregularly to regularly firing-type cells (Pospischil et al. 2008). We apply sinusoidal current injection that mimics the Gaussian distribution of HD signal in thalamic neurons (Taube et al. 1990). Experimental and theoretical evidence suggests that bursts occur preferentially on the ascending slope of input signal (Gabbiani et al. 1996; Guido et al. 1992; Kepecs et al. 2002). Thus irregularly spiking neurons may detect the rising slope of input signals with greater precision compared with regularly spiking neurons (Metzner et al. 1998; Sherman 2001).
Previous models of the anticipatory time interval (ATI; a parameter closely related to the separation angle) describe that directional anticipation relies on the firing properties of neurons afferent to the HD system (van der Meer et al. 2007). The idea that ATI actively predicts direction has been challenged (van der Meer et al. 2007), especially in the context of the finding that ATI does not represent motor efference copy (Bassett et al. 2005). ATI values differ substantially across sequentially connected regions, decreasing in the following order:
mammillary bodies > anterior thalamus > postsubiculum (Blair et al. 1998; Blair and Sharp 1995;Stackman et al. 2003; Taube and Muller 1998). Compared with anterodorsal nucleus (AD) thalamic cells (∼25 ms), the ATI is greater for mammillary bodies (40–75 ms) but close to zero for the dorsal tegmental nucleus of Gudden (Sharp et al. 2001). The ATI in the retrosplenial cortex (∼25 ms) (Cho and Sharp 2001) is similar to thalamic values, although the postsubicular ATI differs substantially, with values close to 0. This raises the question of why the ATI differs so much in monosynaptically connected regions. Furthermore, it is unclear why ATI decreases but not increases with the propagation of the vestibular signal, which is proposed to follow a bottom-up direction (Taube 2007). We propose that turn-specific modulation of the tuning curve is not a process of anticipation but rather represents the intrinsic neuronal properties of the HD neurons. For this purpose, we evaluated the
computational modeling to investigate how the irregularity of thalamic firing patterns reflects the susceptibility of thalamic neurons to turn-specific modulation of the HD tuning curve. We propose here that HD neurons, which express a higher degree of irregularity, fire more spikes in the ascending phase of the directional tuning curve, leading to higher clockwise (CW) versus counterclockwise (CCW) directional curve separation, compared with neurons that fire with a lower degree of irregularity.
One characteristic feature of anterior thalamic nuclei is that there is little evidence for local GABAergic
interneurons (Wang et al. 1999). Computational network models of thalamic activity involving hyperpolarization of HD cells propose that inhibition in the anterior thalamus may depend on extrinsic circuits (Rubin et al. 2001). The anatomical substrate of thalamic inhibitory circuits is associated with the thalamic reticular nucleus, which provides a topographically organized GABAergic projection to the anterior thalamic nuclei (Gonzalo-Ruiz and Lieberman 1995; Lozsadi 1995). Importantly, the thalamic reticular nucleus (which is involved in the generation of spindles) evokes local field synchronization in anterior thalamus (Tsanov et al. 2011b). To test the hypothesis that rhythmic reticular inhibition evokes spiking activity of HD cells, we investigated the thalamic HD signal during periods of immobility and compared the spiking patterns of HD cells to the preceding exploration periods. Spindle oscillations (7–14 Hz), which appear during sleep stage 2 and during periods of immobility (high-voltage spindles) (Buzsaki 1991; Buzsaki et al. 1988), are generated by the thalamic reticular nucleus. They drive potent inhibitory postsynaptic potentials in thalamo-cortical neurons (Steriade et al. 1985). Here we explored whether, during high-voltage spindle periods, thalamic HD cells maintain their preferred firing direction and whether their firing patterns are triggered during spindle oscillations. Our data show that HD neurons are not entrained by the spindles, suggesting that thalamic HD signal is triggered by excitatory but not inhibitory inputs. On the basis of this finding, we exclude from our Hodgkin-Huxley model hyperpolarization-triggered low-threshold Ca2+currents
and instead include depolarization-triggered high-threshold Ca2+ currents as a factor that can affect spiking
regularity. Our goal here is to test experimentally which would best predict the firing pattern of thalamic HD cells in behaving rats. Previously modeled ATI dynamics account for spike rate adaptation and the postinhibitory rebound of vestibular nucleus neurons (van der Meer et al. 2007). Here our model also relies on the role of spike rate adaptation; however, the triggering of the spike trains is linked not to inhibitory but to excitatory stimuli. Our findings suggest that the intrinsic calcium and adaptation currents, which evoke irregular firing, lead to higher firing rate at the ascending slope of a sinusoidal depolarization, inducing the separation angle of the HD cells. Our data show, for the first time, that the turn-specific modulation of the directional tuning curve depends on the degree of firing irregularity of HD cells together with their spike adaptation properties.
Go to:
MATERIALS AND METHODS
Surgical implantation of electrodes.
Fig. 1.
Turn-specific modulation of thalamic tuning curves correlates with spike variability. A: coronal brain section from a rat in which 8 chronically implanted tetrodes targeted the anterior thalamic nuclei. The electrode (blue arrow) was first positioned ...
Recording techniques.
After at least 1 wk of recovery subjects were connected, via a 32-channel headstage (Axona), to a recording system that also allowed for animal position tracking. Signals were amplified (10,000–30,000×) and band-pass filtered between 380 Hz and 6 kHz for single-unit detection. To maximize cell separation, only waveforms of sufficient amplitude (at least 3 × noise threshold) were acquired (Fig. 1B). Candidate waveforms were
discriminated off-line with graphical cluster-cutting software (Axona), which allows waveform separation based on multiple features including spike amplitude, spike duration, maximum and minimum spike voltages, and the time of occurrence of maximum and minimum spike voltages. Autocorrelation histograms (autocorrelograms), which represent the cross-correlation of a spike with itself, were calculated for each unit, and the unit was removed from further analysis if the histogram revealed the existence of correlations within the first 2 ms (refractory period), inconsistent with good unit isolation.
Recording sessions.
Head direction analyses.
Directional analyses were performed for all HD cells in AD and AV thalamic nuclei, 90 units in total. The rat's HD was calculated for each tracker sample from the projection of the relative position of the two LEDs onto the horizontal plane (Fig. 1B). The directional tuning function for each cell was obtained by plotting the firing rate as a function of the rat's directional heading, divided into bins of 5° (Fig. 1, C and D). The firing rate was computed as the total number of spikes divided by the total time in that bin (Taube et al. 1990). To restrict the influence of inhomogeneous sampling on directional tuning, we accepted data only if all directional bins were sampled by the rat. The directionality of the head turns was defined with a polar coordinate system, such that increasing angles indicate CCW turns and decreasing angles indicate CW turns (Fig. 1C and D). The background firing rate was calculated as <10% from the peak firing rate. The momentary angular velocity of the animal's head was
calculated as the difference in the angle of HD between successive 50-Hz time samples. The direction time series was first smoothed by calculating a five-point running average. After smoothing, the instantaneous velocity was calculated as the angular displacement between two successive points per time (Taube 1995). Positive angular velocities are for CCW turns, and negative angular velocities are for CW turns. The separation angle was calculated as the difference between a cell's CW mean direction and its CCW mean direction (Blair and Sharp 1995). We used a Gaussian mean method where the CW and CCW firing rate vs. HD functions were treated as Gaussian distributions. The mean of each distribution was calculated from all directional bins, and the difference between the two means gave an estimate of the separation angle (Taube and Muller 1998).
Head direction normalization.
The data from exploration recording sessions were plotted in a normalized directional tuning curve of firing rate vs. HD tuning for all HD cells. The normalized firing rate is the firing rate divided by the maximal firing rate for each unit. The HD in degrees (of cells that respond to different heading directions) was aligned with the peak of the tuning curve for all units to a HD of 180° (Bassett et al. 2005). The data from immobile sessions included only off-line filtered spindle periods. The firing rate of each cell for the immobile sessions was normalized (transformed into %), considering the peak firing rate from the preceding exploration recording session as 100%. Similarly, the preferred firing direction of each cell for the immobile sessions was aligned to 180°, using the same shift in degrees that aligns the preferred firing direction from the preceding exploration recording session to 180°. The arbitrary separation angle value of 8° that differentiated low- and high-value groups was based on the rounding of the median value (7.6°) of the Poisson distribution for all separation angles from the recorded thalamic units.
Interspike interval analysis.
background firing rate. The coefficient of variation analysis for ISIs indexes the degree of irregularity, with higher coefficient variation values indicating a greater degree of irregular firing (Shadlen and Newsome 1994; Softky and Koch 1993).
Computational model.
The computational model was run under the NEURON simulation environment (Hines and Carnevale 1997) (see APPENDIX). The model described here is a single-compartment neuron (cylinder of diameter d and length L) described by the following membrane equation (Pospischil et al. 2008):
C
m(d
V
/d
t
)=−
g
leak(
V
−
E
leak)−
I
Na−
I
Kd−
I
M−
I
Lwhere V is the membrane potential, Cm = 1 mF/cm2 is the specific capacitance of the membrane, gleak is the resting
(leak) membrane conductance, and Eleak is its reversal potential. The model considered here is a reduced type of
biophysical model where the intrinsic properties arise from voltage-dependent conductances, each described by differential equations (Hodgkin-Huxley-type models). We use a one-compartment Hodgkin-Huxley- type model, which precisely represents the biological dynamics of main neuronal currents and at the same time simplifies the functional subdivision of the modeled neurons to regular or irregular behavior (Pospischil et al.
2008). INa and IKd are the sodium and potassium currents responsible for action potentials, IM is a slow
voltage-dependent potassium current responsible for spike-frequency adaptation, andIL is a high-threshold, L-type
calcium current. These voltage-dependent currents are variants of the same generic equation:
I
j=
g
jm
Mh
N(
V
−
E
j)
where the current Ij is expressed as the product of, respectively, the maximal conductance gj, activation (m) and inactivation variables (h), and the difference between the membrane potential V and the reversal potentialEj. The gating of the channel is derived from the following first-order kinetic scheme: Cα(V) ↔ β(V)O,
where O and C are the open and closed states of the gate. The variables m and h represent the fraction of independent gates in the open state (Hodgkin and Huxley 1952). The steady-state activation and the time
constant are, respectively, given by m∞ = α/(α + β) and τm = 1/(α + β), and similarly for h. Additional details of the computational model are described in the APPENDIX.
Statistical analyses.
Statistical significance was estimated by two-tailed Student's t-test and two-way analysis of variance (ANOVA), paired with post hoc Newman-Keuls test. The probability level interpreted as significant was P < 0.05. Data points are plotted ± SE.
Go to:
RESULTS
Turn-specific modulation of head direction tuning curve.
The variability of ISIs of thalamic HD cells was quantified with the coefficient of variation (the ratio of the standard deviation to the mean of ISIs; see MATERIALS AND METHODS). Previous analysis of ISI variability of HD spiking was restricted to the peak of the tuning curves with a range of ±6° from the preferred firing direction (Taube 2010). By including the ISIs from the tuning curve with >10% of the peak firing rate in the coefficient of variation, we investigated here the contribution of the firing patterns in the tuning curve's ascending and
descending slopes to the formation of separation angle in the HD cells. The coefficient of variation for HD cells with small separation angles (Fig. 1E) is smaller compared with HD cells with larger separation angles (Fig. 1F). While the coefficient of variation indicates the higher variability of ISIs between the two groups, the ISI
scatterplots show the interspike ranges that increase the standard deviation of the ISIs' mean value (see arrow in Fig. 1F). Two-dimensional ISI scatterplots of HD cells with lower variability are characterized by one major ISI cluster (Fig. 1G), while ISI scatterplots of HD cells with higher variability express two more ISI clusters (Fig. 1H, top). The additional clusters represent the first/last spike of the rhythmic spike trains in the theta range (5–10 Hz; Fig. 1H, bottom), which are a characteristic feature of HD-by-theta cells (Tsanov et al. 2011a). Although ISI scatterplots visualize the rhythmicity-related clusters, the coefficient of variation detects the differences of spiking irregularity between recorded neurons. We next correlated the value of the coefficient of variation, calculated for the ISIs within the directional firing range, to the separation angle for all recorded HD units (Fig. 1I) and found a significant positive correlation (Pearson, r= 0.567, n = 90, P < 0.001). The values of the
coefficient of variation range mainly between 1.5 and 2.5, suggesting a large standard deviation of the mean firing rate. To reduce the effect of ISI outliers on the mean firing rate, we used a parallel approach in estimating the ISIs for the variance analysis. For this we used ISIs with length of <500 ms, where the ISIs longer than 500 ms were filtered out. The application of this filter reduced the coefficient of variation values to the range between 1 and 2. Importantly, the correlation between the coefficient of variation and the separation angle was well preserved (Pearson, r = 0.560, n = 90, P < 0.001), suggesting that the result is not biased by long ISI outliers. Location-specific analysis shows that AV neurons express a larger coefficient of variation (1.93 ± 0.04 for directional filter and 1.73 ± 0.04 for ISI filter) compared with AD neurons (1.84 ± 0.04 for directional filter and 1.64 ± 0.05 for ISI filter).
This finding suggests that ISI variability (which reflects the irregular firing of the neurons) is a factor that relates closely to the formation of the separation angle. ISI variability may reflect the synergistic formation of groups of spikes and the intervals between these groups. Thus we evaluated subsequently the mechanisms that generate the formation of irregular firing patterns (see MATERIALS AND METHODS).
Angular velocity effect on thalamic directional firing frequency in behaving rats.
3, A and B, right). The Pearson correlation between angular velocity and normalized HD of all spikes for the group of units with separation angle > 8° is r = −0.258 (n = 314,479), while the correlation for the separation angle < 8° group is r = −0.140 (n = 501,218). To test the null hypothesis that there is no significant difference between both correlations, we converted the r values into Z scores (Z = −0.264 for the group of units with separation angle > 8° and Z = −0.141 for the group of units with separation angle < 8°). We calculated the difference between both correlations over the standard error (seeMATERIALS AND METHODS) and found the Z|difference| = 53.91, which is significant (t-test, P < 0.001) at the 99% confidence level, thus rejecting H0. The
difference in relation to angular velocity between both groups can be visualized by the average frequency in degrees per second (Fig. 3C), and the statistical significance is represented by repeated-measures ANOVA [F(1,10) = 12.75, P < 0.01, n = 56/34]. These data demonstrate that the firing rate of neurons with more irregular
firing patterns is better correlated with angular velocity compared with the firing rate of neurons with less irregular firing.
Fig. 2.
Separation angle and ISI variability in anterior thalamus. A and B: sample polar plots of 5 thalamic HD cells with a separation angle > 8° (A), represented also as the top 5 points with the highest separation angle in Fig. 1I, and
...
Fig. 3.
Angular velocity effect on HD cells depends on the separation angle.A: color-coded scatterplot of spiking frequency plotted against head direction (x-axis) and angular velocity (y-axis) from a sample unit with a separation angle (SA) < 8°. ...
We also correlated the steepness of the angular velocity to the coefficient of variation values for all HD cells. The steepness was expressed as the slope of the function between the firing frequency and angular velocity (Bassett and Taube 2001). We found a significant, positive correlation (Pearson, r = 0.445, n = 90, P < 0.001). This finding suggests that the angular velocity and the separation angle are both related to the interspike patterns of the HD cells.
Directional firing of thalamic head direction cells during spindle periods.
sessions were characterized by brief episodes in which the animals were immobile in a prone position and several brief mobile periods. The definition of high-voltage spindle periods (Fig. 4A) in our study was based on off-line detection of the characteristic LFP (see MATERIALS AND METHODS) (Fig. 4B). The peak of the spindle spectral power is in the range of 7–14 Hz, with a gradual decrease of spindle frequency after the onset of spindle epochs (Fig. 4B, top). The spindle power spectrogram shows a parallel spectral power increase in the range of 12–22 Hz (Fig. 4B, top), which is a typical feature of thalamic spindles as harmonic oscillations (Tsanov et al. 2011b). For the directional firing range the HD units continued to fire with similar rate during the transition from exploration periods to immobile spindle periods (Fig. 4B, bottom), as well as throughout the entire immobile episodes. During subsequent immobile periods, the animal's head was positioned in different directions across the
horizontal plane, including the preferred firing direction for the analyzed unit. However, the sampling number of the HD degrees is low (few HDs with spindle oscillations), which is insufficient to evaluate the changes of the firing rate between the exploration and the spindle episodes. Therefore, we normalized the firing rate and head directionality for all cells from all animals (see MATERIALS AND METHODS), aligning the peak firing rate for all units to a HD of 180° (Bassett et al. 2005). The integration of all spindle periods for all rats in an average tuning curve showed a significant decrease of the firing rate for the preferred direction [ANOVA, F(1,72) = 20.03, P <
0.001, n = 64] compared with the averaged tuning curve for all exploration periods (Fig. 4C). The average peak firing rate during spindles (62.5 ± 7.3%) was ∼40% lower than the average peak firing rate for exploration periods. The decrease of the firing rate was significant in the range from 160 to 200 normalized degrees (Newman-Keuls test, P < 0.01).
Fig. 4.
Thalamic HD signal is preserved during spindle periods. A: sample recording of speed (top), HD (middle), and HD unit firing frequency (bottom) during immobility period. The occurrence of spindle epochs is denoted by blue-filled rectangles. The beginning ...
Analysis of the normalized tuning curve for HD cells with a separation angle > 8° revealed a reduced firing rate (46 ± 10.5%; Fig. 5A) compared with HD cells with a separation angle < 8° (70 ± 8.9%; Fig. 5B). The reduced firing frequency of HD cells during spindle epochs suggests that hyperpolarization-mediated mechanisms may not be involved in HD spike generation. To test this hypothesis, we next analyzed the relationship of HD spiking to the phase of spindle oscillation.
Fig. 5.
Spiking properties of anterodorsal thalamic units in relation to the spindle cycle.
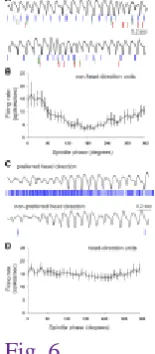
We determined the position of each spike relative to the spindle cycle (0° and 360° indicated the peaks, while 180° indicated the trough of 1 oscillatory cycle) (Harris et al. 2002). Raw spiking traces (Fig. 6A) and their phase analysis (Fig. 6B) revealed that non-HD cells in the anterior thalamus are phase-locked to the spindle
oscillations, with a preference for the positive phase. The firing rate for this group is higher for the positive (270– 90°) compared with negative (90–270°) phases of the spindle oscillations [ANOVA, F(1,36) = 12.75, P < 0.01, n =
12]. The HD units spike continuously during the spindle episodes when the animal's heading is in the unit's preferred firing direction (Fig. 6C, top). The spiking of HD units is not driven by the spindle rhythm in the unit's nonpreferred firing direction, where the firing rate is very low (Fig. 6C, bottom). We analyzed the relationship between HD spikes and spindle oscillations (Fig. 6D) and found no significant difference in firing rates for the positive (270-90°) compared with negative (90–270°) phases (ANOVA, F < 1, P > 0.05,n = 37). We also found no significant correlation between the spindle amplitude and the firing rate (Pearson,r2 = 0.015, P < 0.05, n = 37).
[image:9.595.26.104.276.454.2]These results do not provide evidence for HD spiking in phase with spindle oscillations during spindle epochs, suggesting that the firing of HD cells might be unrelated to reticular nucleus-mediated inhibition.
Fig. 6.
Thalamic HD cells are not phase-locked to spindle oscillations. A: examples of LFP traces (top) and the parallel spiking activity (bottom) of non-HD units. The colors indicate the spikes of different units. The lower LFP spikes example represents the ...
Simulation of HD tuning curve in a single-compartment Hodgkin-Huxley model.
While the inhibitory input during high-voltage spindles does not potentiate the firing of thalamic neurons, the intrinsic low-threshold calcium current is an unlikely scenario for the irregularity of thalamic spikes. Here we model the alternative mechanism that is mediated by excitatory input, proposing that the spiking irregularity results from high-threshold calcium and slow potassium currents. We therefore included depolarization-triggered high-threshold Ca2+ current in our single-compartment model (Pospischil et al. 2008). We modeled an irregular
firing neuron (see MATERIALS AND METHODS) exhibiting 1) Na+ and K+ currents for generating
spikes, INa andIKd, 2) slow K+ current activated by depolarization, responsible for spike-frequency adaptation, IM,
and 3) high-threshold Ca2+ current, I L.
To simulate the biological input pattern of the HD cells, we applied injection current (Iinj) with a sinusoidal shape,
mimicking the gradual increase and subsequent gradual decrease of the depolarizing inputs during the cell's preferred HD in the horizontal plane. We set the duration of Iinj at 3,000 ms and applied current amplitude with
the sinusoidal current is analogous to normalized HD, where the peak of the tuning curve responds to 180°. The start of Iinj application corresponds to 150° and the end to 210° for CW modeling (Fig. 7, A–C, top). The
CCW Iinj application is in reverse order: the start corresponds to 210° and the end to 150°. For our model, we
generated irregular firing type behavior using IL with high (gL = 0.00022 S/cm2) and moderate (gL = 0.0001
S/cm2) conductance. We also generated regular firing behavior by deactivation of I
L (gL = 0 S/cm2). The
application of Iinj induced spike doublets for high gL (Fig. 7A), particularly at the peak of the injection sinusoidal
current. Moderate conductance gL was characterized by the absence of irregular ISI patterns (Fig. 7B), which was
the case with regular firing cells (Fig. 7C). Our simulations showed that spikes within bursts (spike doublets) occurred preferentially on the ascending slopes of Iinj, whereas regular spikes showed little slope selectivity. The
concurrent activity of IL and IM gradually reduces the formation of irregular spike trains, reducing the spike count
on the descending slope of the sinusoidal input. Such phase lead is evident in the average spike count histogram for all 30 simulations from the high-gL group (Fig. 7D, left) and is less strongly expressed in the moderate-gL and
zero-gL groups (Fig. 7D, center and right, respectively). Therefore, by regulating the depolarization of membrane
potential, the degree of gL helps determine the degree of ISI variation (Fig. 7E). High gL results in a higher
coefficient of variation (Fig. 7E, left) compared with the moderate-gL ISI coefficient of variation (Fig.
7E, center), while zero gL leads to the lowest value of ISI coefficient of variation (Fig. 7E, right).
Fig. 7.
Model of irregular spiking HD cell based on thalamic anterior thalamus. A: sinusoidal current injection (Iinj) to a
neuron with a high-threshold calcium channel conductance of gL = 0.00022 S/cm 2
. Toptrace represents the current application where the ...
Separation angle in modeled neurons depends on concurrent activity of high-threshold calcium and spike adaptation currents.
We next measured the phase lead for CW and CCW simulations in the same manner as we evaluate the turn-specific peak separation of the HD tuning curve (Fig. 8). For the high-gL group separation angle was 7.21° (Fig.
8A), for the moderate-gL group 5.40° (Fig. 8B), and for the zero-gL group 4.53° (Fig. 8C), revealing a significant
positive correlation (Pearson, r = 0.97, n = 90, P < 0.001). These data support experimental evidence that the formation of separation angles is dependent on the generation of Ca2+-dependent depolarization irregular spike
trains. The fact that even the group with zero gL value expresses separation angle suggests that another
fundamental current is involved in this process. The role of adaptation current has been already modeled in both head-directional anticipation (van der Meer et al. 2007) and firing phase lead to sinusoidal inputs (Kepecs et al. 2002). To test the role of slow K+ current, responsible for spike-frequency adaptation, I
M in the generation of
phase lead to the sinusoidal current injection we inactivated IM in our model. The outcome was a separation angle
close to 0 for the regularly firing cell (Fig. 9, A and B), with fully lost phase lead when both IM and IL are
Fig. 8.
Separation angle depends on the high-threshold calcium channel conductance: polar plots of averaged firing frequency for 30 simulations with small Iinj variations (in 0.001-nA steps) for CW and CCW simulations for gL =
0.00022 S/cm2 (A), gL = 0.0001 S/cm ...
Fig. 9.
Directional properties of modeled regularly firing neuron. A: sinusoidal current injection (Iinj) to neuron with
high-threshold Ca2+ channel conductance gL = 0 and slow K +
adaptation channel conductance gM = 0. Top trace
represents the current application where ...
Angular velocity effect on thalamic directional firing frequency in modeled neurons.
We next used a modeled neuron to explain how the spiking of thalamic HD cells in relation to angular velocity depends on the irregular patterns of the spike trains. For this purpose, we simulate spiking in the preferred HD in a bin per second (similarly to the experimental analysis where the measurement is degree per second). A short duration of 600 ms in this bin leads to restricted spiking (Fig. 10A, top); however, twice the duration (1,200 ms) does not result in doubled spike counts (Fig. 10A, middle). Furthermore, a longer duration of 1,800 ms revealed a reduction in the number of spikes in the rhythmic spike trains with time (Fig. 10A, bottom). Therefore,
continuous within-bin spiking adaptation, corresponding to the preferred HD, will lead to lower spiking frequencies (as is the case with HD firing during sleep periods). The potent role of the high-threshold Ca2+current, I
L, in establishing velocity-dependent firing frequency is shown when IL is inactivated, i.e., gL = 0
(Fig. 10B). In this case, the regular firing undergoes weak adaptation, which can be detected for longer durations (Fig. 10B, bottom). Thus the positive linear relationship between neuronal spiking and velocity (bin/s) is higher in irregular neurons expressing IL compared with regularly firing neurons (t-test, P < 0.001; Fig. 10D). Finally,
without spike-adaptation current conductance (gM = 0) the firing frequency does not depend on the duration of
the injected current (Fig. 10C) and the positive correlation between neuronal spiking and velocity is fully lost when both IL and IM are inactivated (Fig. 10E). In conclusion, our data show that the high-threshold calcium and
adaptation currents together increase the correlation between the firing rate and the angular velocity.
Velocity effect in modeled neurons. Continuous current injection to neuron with high-threshold Ca2+ channel conductance of gL = 0.00022 S/cm2 (A), gL = 0 S/cm2 (B) and gL = 0 S/cm2 and gM = 0 S/cm2 (C) for duration of
600 ms (top), 1,200 ms (middle), ...
Continuous sinusoidal but not phasic injection current induces phase lead.
Strong synaptic input can evoke irregular behavior without being modeled with sinusoidal injection current. Phasic strong synaptic input is sufficient to generate such high frequencies without the presence of intrinsic calcium currents. This raises the fundamental question of whether phasic inputs could explain the firing of thalamic HD neurons in vivo. We addressed this issue by modeling strong phasic inputs without a high-threshold Ca2+ current. We applied five constant current injections with a duration of 200 ms each, with linearly increasing
(0.04, 0.08, 0.12 nA) and linearly decreasing current values representing the directional tuning curve (Fig. 11A, top). When IL is inactivated (gL = 0), there is a formation of spike doublets during 0.12-nA input, with a
symmetrical distribution of the output spikes (Fig. 11A, left; separation angle = 0°). Similarly, concurrent inactivation ofIM (gM = 0) resulted in triplets with a symmetrical output (Fig. 11A, center; separation angle = 0°).
Furthermore, even the reintroduction of IM and IL (gL = 0.00022 S/cm2) resulted in a phase lag instead of a phase
lead, with a negative separation angle (Fig. 11A, right; separation angle = −2.15°). Importantly, increasing the
current amplitude for all the phasic inputs (0.105, 0.115, and 0.125 nA) also led to symmetrical firing for gL = 0
(Fig. 11B, left) and gL = 0, gM = 0 (Fig. 11B, center), with no phase lead (separation angle = 0° for both cases,
respectively). Additionally, the reintroduction of IM and IL resulted in a phase lag with more spikes on the
descending slope (Fig. 11B, right) and negative separation angle (separation angle = −5.26°). These data show
that strong phasic current is able to evoke an irregular firing mode, without the incorporation of calcium currents; however, this outcome is paralleled by the absence of phase lead induction.
Fig. 11.
Phasic current injection is insufficient for phase lead induction. A: phasic current injection (Iinj) to modeled
neuron, applied with linearly increasing/decreasing amplitudes: 0.04 nA (1st and 5th), 0.08 nA (2nd and 4th), and 0.12 nA (3rd injection). ...
Go to:
DISCUSSION
Here we demonstrate turn-specific modulation of the HD tuning curve and provide evidence that this modulation is a function of the irregular firing patterns of thalamic directional neurons. We use a Hodgkin-Huxley model to show that the spiking phase lead to sinusoidal depolarization input mediates the difference in the tuning curves of CW versus CCW turns. For neurons with adaptive firing properties, the firing frequency is higher on the
ascending slope of the injection depolarizing current.
Evaluation of turn-specific modulation of directional tuning curve.
To evaluate the turn-specific modulation of directional tuning curves, we used the difference in the mean firing rates for CW and CCW turns, expressed in degrees (Blair and Sharp 1995). The amount of time that turn-specific peak firing (CW or CCW) precedes the averaged HD (for both CW and CW turns) is referred to as the
process has been challenged (van der Meer et al. 2007). Because the ATI terminology proposing a process of anticipation might be misleading, we decided to use the separation angle as a measure of the turn-specific modulation of the HD tuning curve. Furthermore, the evaluation of ATI with 60-Hz video monitoring is
imprecise, resulting in different values for equivalent studies (Blair et al. 1998; Blair and Sharp 1995; Stackman et al. 2003; Taube and Muller 1998). To avoid errors in the evaluation of the directional signal on a millisecond scale, we measure here the amplitude and the sign of the thalamic separation angle (Taube and Muller 1998). The mean value of the separation angle in our study is 5.96 ± 0.5° for AD nucleus and 8.67° ± 0.6° for AV nucleus. This is consistent with earlier findings from AD thalamus, showing a separation angle value of 6.0 ± 0.9° (Taube and Muller 1998). This approach allowed us to examine differential effect on the formation of separation angle as a result of the AD- and AV-type spiking properties. ISI variability analysis allows us to examine the degree of firing irregularity (Holt et al. 1996; Softky and Koch 1993). HD spike trains within their preferred firing
direction are characterized by short ISIs (up to 2 ms), resulting in a low mean firing rate, whereas the ISIs in the periphery of the directional firing range are much longer (>200 ms), resulting in high values of the coefficient of variation > 1. Here we included in the coefficient of variation long ISIs (up to 500 ms) that occur between the spike trains and particularly in the slopes of the tuning curve, which earlier studies excluded (Taube 2010). Using this approach, we investigated the role of the firing patterns in the initiation and the termination of the HD tuning curve (ascending and descending slopes, respectively) in the turn-specific modulation of HD signal and the formation of the separation angle. We show here that the amplitude of the separation angle correlates positively with the degree of ISI variation. To find a causal relationship between rhythmic spike train generation and the degree of separation angle, we used a computational model addressing the role of the major currents that define whether a neuron is irregularly or regularly firing. To confirm or exclude the role of hyperpolarization currents in our model, we recorded HD cells during high-voltage spindle periods and evaluated whether they are entrained by the inhibitory drive of thalamic reticular inputs (Steriade et al. 2001).
Anterior thalamic circuitry and head direction activity during spindles.
The ultrastructural organization of anterior thalamus is similar to that of other thalamic nuclei (Somogyi et al. 1978), and anterior thalamic cells express the basic electrophysiological properties (Pare et al. 1987, 1990) that characterize most dorsal thalamic neurons (Jahnsen and Llinas 1984a, 1984b). The current understanding for this region is that the neurons of the AD and AV are relatively homogeneous in morphology and connections. There is little evidence for interneurons in these nuclei; it would appear that majority of AD and AV neurons are projection neurons (Vertes et al. 2001). Concurrently, more than half of all AD neurons (∼60%) are estimated to be HD cells (Taube 1995; Taube and Bassett 2003). Acetylcholinesterase and butyrylcholinesterase (a
coregulator of cholinergic neurotransmission) are markers used to differentiate anterior thalamic nuclei (Darvesh et al. 2003). Acetylcholinesterase is found in the highest concentrations in axons in the AD and AV, while butyrylcholinesterase is more concentrated in neurons in AD and latero-dorsal thalamic nucleus (Robertson et al. 1986; Tago et al. 1992). These findings provide additional support for the application of IM in the basic
Hodgkin-Huxley model for anterior thalamic neurons.
during immobility (particularly the spindle oscillation phase, which is characterized by robust reticular nucleus activity) and comparing the spindle spiking patterns of HD cells to the preceding exploration periods. The activity of thalamic HD cells recorded in behaving animals is updated continuously because of the
self-maintaining activity of the tegmento-diencephalic network, also known as the HD attractor network (Blair and Sharp 1995; McNaughton et al. 1991; Redish et al. 1996; Skaggs et al. 1995;Song and Wang 2005). The
vestibular system, which contains tonically active neurons even during sleep (Nelson et al. 2003), is proposed to be one of the main sources that generate the HD signal (Stackman and Taube 1997). We compared the HD firing rates of spindle periods and preceding exploration periods. HD spiking during the spindle periods preserved its directionality with a concurrent peak firing rate of ∼60% compared with the preceding exploration periods. This firing decrease was more expressed in neurons with high separation angles (46 ± 10.5%), proposing a role for frequency adaptation currents in HD spiking behavior. While local GABAergic inhibition is not a characteristic network feature of rodent anterior thalamus (Wang et al. 1999), the main GABAergic inputs are provided by the thalamic reticular nucleus (Gonzalo-Ruiz and Lieberman 1995). To determine whether robust reticular activity triggers irregular spike trains in HD cells, we investigated the relation of the HD firing to the phase of high-voltage spindles. Unlike the firing of non-HD units, the firing of HD units was not entrained by thalamic spindle rhythms, suggesting that hyperpolarization currents are not the major mechanism that mediate irregular firing in thalamic HD units.
Models of turn-specific modulation in head direction circuitry.
Models that reduce the number of currents involved in spike generation, and yet are still dynamically precise, are either integrate-and-fire models (Brette and Gerstner 2005; Smith et al. 2000) or Hodgkin and Huxley-type models (Foster et al. 1993; Pospischil et al. 2008). In the present paper, we focus on the latter type to simulate the intrinsic properties of thalamic HD neurons (Pospischil et al. 2008). Simplified single-compartment Hodgkin-Huxley-type models were proposed for thalamic cells and derived from more complex models (Destexhe et al. 1996, 1998; Rinzel 1987; Rose and Hindmarsh 1989). We aimed here to model the basic mechanisms that differentiate thalamic spiking patterns into regular and irregular modes, and a single-compartment Hodgkin-Huxley model allowed us to demonstrate the role of main neuronal currents in this process. Previous modeling examining the HD tuning curve properties as a result of dynamic response to head movements have
acknowledged the role of medial vestibular nucleus neurons in the formation of ATI in HD circuitry (van der Meer et al. 2007). The model predicted that movement patterns with high-frequency components result in lower anticipation than lower-frequency movements (van der Meer et al. 2007). Although some differences between the biological and modeled data remained unexplained, the authors of this model demonstrated that the firing properties of medial vestibular nuclei neurons afferent to the HD system could be important in the generation of generating HD anticipation. Anatomically, the anterior thalamus receives inputs from the medial vestibular nuclei via the dorsal tegmental nuclei of Gudden (Hayakawa and Zyo 1984) and the lateral mammillary bodies (Gonzalo-Ruiz et al. 1992). Interestingly, the neuronal response in the medial vestibular nuclei expresses a phase lead relative to a sinusoidal angular head velocity input (Kaufman et al. 2000). This firing behavior is likely to be observed in other brain areas including the structures of the HD system, which might be the case with the
separation angle/ATI formation in lateral mammillary bodies and AD thalamic nucleus. Experimental results show that ATI is not abolished by passive movements (Bassett et al. 2005), suggesting that ATI might be
spiking activity to sinusoidal current can generate a separation angle. Phasic injection current implies the
alternative scenario for irregular firing within the HD tuning curve. However, such current injection that mimics multiple in-phase synaptic inputs failed to evoke phase lead in our model, regardless of the contribution of high-threshold Ca2+ currents. Thus continuous sinusoidal current injection that represents the Gaussian distribution of
multiple out-of-phase inputs is the most likely current injection model that explains the formation of the phase lead and positive separation angle of the HD cells. Complex models that take into account not only all anatomical and physiological neuronal properties but also their network connectivity as well as irregular patterns of current injection would recreate more accurately the spiking firing rate of thalamic neurons in vivo.
Role of intrinsic currents in phase lead.
Spike rate adaptation and postinhibitory rebound are used to explain ATI formation in modeled vestibular activity (van der Meer et al. 2007). This model explained 60–80% of the behaviorally observed anticipation variability, leaving the possibility for an additional mechanism that regulates this phenomenon. Here we demonstrated that thalamic neurons may be involved in the formation of ATI in the HD system, indirectly represented by the separation angle. We also used spike rate adaptation to generate the separation angle; however, considering the microcircuit anatomy of anterior thalamic nuclei, we modeled excitatory-driven currents to include a spike-triggering mechanism for the dynamic formation of the HD tuning curve. Using a Hodgkin-Huxley-type model we showed here the importance of irregular spike trains in the turn-specific
modulation of the directional tuning curve. In light of our spindle data, we deliberately deemphasized the role of low-threshold Ca2+ currents in generation of irregular firing by HD thalamic cells. These currents require a
preceding hyperpolarization to activate T-type calcium channels (Jahnsen and Llinas 1984b; Zhan et al. 1999), suggesting the leading role of depolarization-triggered L-type Ca2+ current for our neurons. We show here
that IL increases the phase lead to a sinusoidal depolarizing input (Pospischil et al. 2008). Neurons with high
L-current conductance (gL = 0.00022 S/cm2), characterized by a higher ISI coefficient of variation, fire with higher
frequency on the ascending slope of the sinusoidal input. As a result, simulations with high gL evoke a larger
separation angle (7.21°) compared with the moderate-gL group (5.40°). Computational models of pyramidal
neurons have also demonstrated that bursts occur preferentially on the positive slope of the input signal and this process requires adaptation currents (Kepecs et al. 2002). Here we show that the adaptation current, IM, is
concurrently involved in the phase lead. Neurons without IM fire with the highest frequency on the peak of
sinusoidal input (with a separation angle close to 0). Our data also reveal that frequency adaptation underlies the effect of angular velocity on directional neurons and this effect is potentiated by depolarization-triggered
Ca2+ currents. Several Ca2+channel subtypes (N, P, Q, and R types from Ca
v2 family channels) are also known to
contribute to depolarization-triggered currents involved in irregular spike train initiation in vitro (Jung et al. 2001). However, our goal here was to show that a reduced model, embracing multiple subtype depolarization currents into a common high-threshold Ca2+ current group (I
L), can elucidate the functional effect of irregular
firing on the directional tuning curve.
Here we propose that the separation angle and the relation to the angular velocity of HD neurons across the regions of the HD system might reflect the combination of the spike-triggering excitatory, inhibitory, and adaptation currents. For example, the neurons in postsubiculum contain Ca2+-sensitive, nonspecific cation
current, ICAN, that is responsible for the cells' persistent spiking (Yoshida and Hasselmo 2009). However,
lower than that for thalamic HD cells (Taube and Muller 1998). Our modeled and experimental data strongly support the idea that the difference of directional turn-specific properties between regions depends on the balance between spike-triggering and adaptation currents of the HD cells.
Angular velocity effect mediated by intrinsic spiking properties of thalamic neurons.
The degree of thalamic separation angle is linked to angular velocity in a study showing that the separation angle for fast (>270°/s) turns is 9.79° and that for slow (<270°/s) turns is 4.03° (Blair and Sharp 1995). Concomitantly, under low simulation speed (20°/s) our modeled separation angle for the gL = 0 group is 4.53°. Thus our parallel
aim was to establish the mechanisms that relate angular velocity to the firing properties of thalamic cells. We confirmed the ability of thalamic cells to fire in relation to the angular velocity. Concurrently, the group of thalamic cells with high separation angle (>8°) is characterized with a higher ISI variability. To find out whether irregular firing determines the dependence on angular velocity, we used a Hodgkin-Huxley-type model
addressing the role of the major currents that define whether a neuron is regularly or irregularly spiking. We demonstrate here that the angular velocity effect on neuronal frequency depends on the degree of high-threshold calcium and spike adaptation. Modeled neurons with high gL show a higher degree of firing frequency adaptation
compared with neurons without high-threshold Ca2+ current. Long duration (seconds) in a preferred directional
bin for neurons with high gL resulted in a lower firing frequency compared with shorter durations, demonstrating
the role of velocity (bin/s) in the frequency regulation.
In conclusion, our data present evidence that intrinsic firing properties regulate the encoding of directional information in thalamic networks. Understanding signal processing by hippocampo-diencephalic circuitry will allow us to further develop the models of spatial navigation and path integration.
Go to:
GRANTS
This work was supported by Wellcome Trust Grant No. 081075 to J. P. Aggleton, S. M. O'Mara, J. T. Erichsen, and S. D. Vann.
Go to:
DISCLOSURES
No conflicts of interest, financial or otherwise, are declared by the author(s).
Go to:
AUTHOR CONTRIBUTIONS
Author contributions: M.T. and S.M.O. conception and design of research; M.T. performed experiments; M.T., E.C., M.S.N., and C.E. analyzed data; M.T., R.B.R., J.P.A., J.T.E., and S.D.V. interpreted results of experiments; M.T. prepared figures; M.T. and S.M.O. drafted manuscript; M.T., R.B.R., J.P.A., S.D.V., and S.M.O. edited and revised manuscript; M.T., J.T.E., and S.M.O. approved final version of manuscript.
Go to:
Appendix
Sodium and potassium currents to generate action potentials.
I
Na=
g
Nam
3h
(
V
−
E
Na)
d
m
/d
t
=
α
m(
V
)(1−
m
)−
β
m(
V
)
m
d
h
/d
t
=
α
h(
V
)(1−
h
)−
β
h(
V
)
h
α
m=−0.32(
V
−
VT
−13)/exp[−(
V
−
VT
−13)/4]−1
β
m=0.28(
V
−
VT
−40)/exp[(
V
−
VT
−40)/5]−1
α
h=0.128exp[−(
V
−
VT
−17)/18]
β
h=4/1+exp[−(
V
−
VT
−40)/5]
where gNa = 50 mS/cm2 and ENa = 50 mV.
IKd is “delayed-rectifier” K+ current (Traub and Miles 1991):
I
Kd=
g
Kdn
4(
V
−
E
K)
d
n
/d
t
=
α
n(
V
)(1−
n
)−
β
n(
V
)
n
α
n=−0.032(
V
−
VT
−15)/exp[−(
V
−
VT
−15)/5]−1
β
n=0.5 exp[−(
V
−
VT
−10)/40]
where gKd = 5 mS/cm2 and EK = −90 mV.
Slow potassium current for spike-frequency adaptation.
IM is a slow noninactivating K +
current (kinetics fromYamada et al. 1989):
I
M=
g
Mp
(
V
−
E
K)
d
p
/d
t
=[
p
∞(
V
)−
p
]/
ττ
p(
V
)
p
∞(
V
)=1/1+exp[−(
V
+35)/10]
τ
p(
V
)=
τ
max/3.3 exp[(
V
+35)/20]+exp[−(
V
+35)/20]
where gM is 0.004 mS/cm2 and τmax = 4 s, unless stated otherwise.
Calcium current to generate irregular spike trains.
IL is L-type Ca2+ current (kinetics from Reuveni et al. 1993):
I
L=
g
Lq
2r
(
V
−
E
Ca)
d
q
/d
t
=
α
q(
V
)(1−
q
)−
β
q(
V
)
q
d
r
/d
t
=
α
r(
V
)(1−
r
)−
β
r(
V
)
r
α
q=0.055(−27−
V
)/exp[(−27−
V
)/3.8]−1
α
r=0.000457exp[(−13−
V
)/50]
β
r=0.0065/exp[(−15−
V
)/28]+1
where gL is the maximum conductance of IL and the reversal potential for Ca2+ ions is ECa = 120 mV.
Go to:
REFERENCES
Angelo K, Margrie TW. Population diversity and function of hyperpolarization-activated current in olfactory bulb mitral cells. Sci Rep 1: 50, 2011. [PMC free article] [PubMed]
Bassett JP, Taube JS. Neural correlates for angular head velocity in the rat dorsal tegmental nucleus. J Neurosci 21: 5740–5751, 2001. [PubMed]
Bassett JP, Zugaro MB, Muir GM, Golob EJ, Muller RU, Taube JS. Passive movements of the head do not abolish anticipatory firing properties of head direction cells. J Neurophysiol 93: 1304–1316,
2005.[PubMed]
Blair HT, Cho J, Sharp PE. Role of the lateral mammillary nucleus in the rat head direction circuit: a combined single unit recording and lesion study. Neuron 21: 1387–1397, 1998. [PubMed]
Blair HT, Lipscomb BW, Sharp PE. Anticipatory time intervals of head-direction cells in the anterior thalamus of the rat: implications for path integration in the head-direction circuit. J Neurophysiol 78: 145–159, 1997. [PubMed]
Blair HT, Sharp PE. Anticipatory head direction signals in anterior thalamus: evidence for a
thalamocortical circuit that integrates angular head motion to compute head direction. J Neurosci 15: 6260–6270, 1995. [PubMed]
Brette R, Gerstner W. Adaptive exponential integrate-and-fire model as an effective description of neuronal activity. J Neurophysiol 94: 3637–3642, 2005. [PubMed]
Buzsaki G. The thalamic clock: emergent network properties. Neuroscience 41: 351–364, 1991.[PubMed]
Buzsaki G, Bickford RG, Ponomareff G, Thal LJ, Mandel R, Gage FH. Nucleus basalis and thalamic control of neocortical activity in the freely moving rat. J Neurosci 8: 4007–4026, 1988. [PubMed]
Cho J, Sharp PE. Head direction, place, and movement correlates for cells in the rat retrosplenial cortex.Behav Neurosci 115: 3–25, 2001. [PubMed]
Darvesh S, Hopkins DA, Geula C. Neurobiology of butyrylcholinesterase. Nat Rev Neurosci 4: 131–138, 2003. [PubMed]
Destexhe A, Contreras D, Steriade M, Sejnowski TJ, Huguenard JR. In vivo, in vitro, and computational analysis of dendritic calcium currents in thalamic reticular neurons. J Neurosci 16: 169–185,
1996.[PubMed]
Destexhe A, Neubig M, Ulrich D, Huguenard J. Dendritic low-threshold calcium currents in thalamic relay cells. J Neurosci 18: 3574–3588, 1998. [PubMed]
Foster WR, Ungar LH, Schwaber JS. Significance of conductances in Hodgkin-Huxley models. J Neurophysiol 70: 2502–2518, 1993. [PubMed]
Gabbiani F, Metzner W, Wessel R, Koch C. From stimulus encoding to feature extraction in weakly electric fish. Nature 384: 564–567, 1996. [PubMed]
Gonzalo-Ruiz A, Lieberman AR. Topographic organization of projections from the thalamic reticular nucleus to the anterior thalamic nuclei in the rat. Brain Res Bull 37: 17–35, 1995. [PubMed]
Goodridge JP, Touretzky DS. Modeling attractor deformation in the rodent head-direction system. J Neurophysiol 83: 3402–3410, 2000. [PubMed]
Gray CM, Maldonado PE, Wilson M, McNaughton B. Tetrodes markedly improve the reliability and yield of multiple single-unit isolation from multi-unit recordings in cat striate cortex. J Neurosci Methods 63: 43–54, 1995. [PubMed]
Guido W, Lu SM, Sherman SM. Relative contributions of burst and tonic responses to the receptive field properties of lateral geniculate neurons in the cat. J Neurophysiol 68: 2199–2211, 1992. [PubMed]
Harris KD, Henze DA, Hirase H, Leinekugel X, Dragoi G, Czurko A, Buzsáki G. Spike train dynamics predicts theta related phase precession in hippocampal pyramidal cells. Nature 417: 738–741,
2002.[PubMed]
Hayakawa T, Zyo K. Comparative anatomical study of the tegmentomammillary projections in some mammals: a horseradish peroxidase study. Brain Res 300: 335–349, 1984. [PubMed]
Hines ML, Carnevale NT. The NEURON simulation environment. Neural Comput 9: 1179–1209, 1997.[PubMed]
Hodgkin AL, Huxley AF. A quantitative description of membrane current and its application to conduction and excitation in nerve. J Physiol 117: 500–544, 1952. [PMC free article] [PubMed]
Holt GR, Softky WR, Koch C, Douglas RJ. Comparison of discharge variability in vitro and in vivo in cat visual cortex neurons. J Neurophysiol 75: 1806–1814, 1996. [PubMed]
Jahnsen H, Llinas R. Electrophysiological properties of guinea-pig thalamic neurones: an in vitro study. J Physiol 349: 205–226, 1984a. [PMC free article] [PubMed]
Jahnsen H, Llinas R. Ionic basis for the electro-responsiveness and oscillatory properties of guinea-pig thalamic neurones in vitro. J Physiol 349: 227–247, 1984b. [PMC free article] [PubMed]
Jung HY, Staff NP, Spruston N. Action potential bursting in subicular pyramidal neurons is driven by a calcium tail current. J Neurosci 21: 3312–3321, 2001. [PubMed]
Kaufman GD, Shinder ME, Perachio AA. Convergent properties of vestibular-related brain stem neurons in the gerbil. J Neurophysiol 83: 1958–1971, 2000. [PubMed]
Kepecs A, Wang XJ, Lisman J. Bursting neurons signal input slope. J Neurosci 22: 9053–9062, 2002.[PubMed]
Lozsadi DA. Organization of connections between the thalamic reticular and the anterior thalamic nuclei in the rat. J Comp Neurol 358: 233–246, 1995. [PubMed]
McNaughton BL, Chen LL, Markus EJ. “Dead reckoning,” landmark learning, and the sense of direction: a neurophysiological and computational hypothesis. J Cogn Neurosci 3: 190–201, 1991. [PubMed]
McNaughton BL, O'Keefe J, Barnes CA. The stereotrode: a new technique for simultaneous isolation of several single units in the central nervous system from multiple unit records. J Neurosci Methods 8: 391– 397, 1983. [PubMed]
Metzner W, Koch C, Wessel R, Gabbiani F. Feature extraction by burst-like spike patterns in multiple sensory maps. J Neurosci 18: 2283–2300, 1998. [PubMed]
Nelson AB, Krispel CM, Sekirnjak C, du Lac S. Long-lasting increases in intrinsic excitability triggered by inhibition. Neuron 40: 609–620, 2003. [PubMed]
Pare D, Steriade M, Deschenes M, Oakson G. Physiological characteristics of anterior thalamic nuclei, a group devoid of inputs from reticular thalamic nucleus. J Neurophysiol 57: 1669–1685, 1987.[PubMed]
Pospischil M, Toledo-Rodriguez M, Monier C, Piwkowska Z, Bal T, Fregnac Y, Markram H, Destexhe A. Minimal Hodgkin-Huxley type models for different classes of cortical and thalamic neurons. Biol Cybern 99: 427–441, 2008. [PubMed]
Redish AD, Elga AN, Touretzky DS. A coupled attractor model of the rodent head direction system.Netw Comput Neural Syst 7: 671–685, 1996.
Reuveni I, Friedman A, Amitai Y, Gutnick MJ. Stepwise repolarization from Ca2+ plateaus in neocortical
pyramidal cells: evidence for nonhomogeneous distribution of HVA Ca2+ channels in dendrites. J
Neurosci 13: 4609–4621, 1993. [PubMed]
Rinzel J. A formal classification of bursting mechanisms in excitable systems. In: Mathematical Topics in Population Biology, Morphogenesis and Neurosciences, edited by Teramoto E, Yamaguti M, editors. Berlin: Springer, 1987, p. 267–281.
Robertson RT, Lieu CL, Lee K, Gorenstein C. Distribution of “non-specific” cholinesterase-containing neurons in the dorsal thalamus of the rat. Brain Res 368: 116–124, 1986. [PubMed]
Rose RM, Hindmarsh JL. The assembly of ionic currents in a thalamic neuron. I. The three-dimensional model. Proc R Soc Lond B Biol Sci 237: 267–288, 1989. [PubMed]
Rubin J, Terman D, Chow C. Localized bumps of activity sustained by inhibition in a two-layer thalamic network. J Comput Neurosci 10: 313–331, 2001. [PubMed]
Shadlen MN, Newsome WT. Noise, neural codes and cortical organization. Curr Opin Neurobiol 4: 569– 579, 1994. [PubMed]
Sharp PE, Tinkelman A, Cho J. Angular velocity and head direction signals recorded from the dorsal tegmental nucleus of Gudden in the rat: implications for path integration in the head direction cell circuit. Behav Neurosci 115: 571–588, 2001. [PubMed]
Sherman SM. Tonic and burst firing: dual modes of thalamocortical relay. Trends Neurosci 24: 122–126, 2001. [PubMed]
Skaggs WE, Knierim JJ, Kudrimoti HS, McNaughton BL. A model of the neural basis of the rat's sense of direction. Adv Neural Inf Process Syst 7: 173–180, 1995. [PubMed]
Smith GD, Cox CL, Sherman SM, Rinzel J. Fourier analysis of sinusoidally driven thalamocortical relay neurons and a minimal integrate-and-fire-or-burst model. J Neurophysiol 83: 588–610, 2000.[PubMed]
Softky WR, Koch C. The highly irregular firing of cortical cells is inconsistent with temporal integration of random EPSPs. J Neurosci 13: 334–350, 1993. [PubMed]
Somogyi G, Hajdu F, Tombol T. Ultrastructure of the anterior ventral and anterior medial nuclei of the cat thalamus. Exp Brain Res 31: 417–431, 1978. [PubMed]
Song P, Wang XJ. Angular path integration by moving “hill of activity”: a spiking neuron model without recurrent excitation of the head-direction system. J Neurosci 25: 1002–1014, 2005. [PubMed]
Stackman RW, Golob EJ, Bassett JP, Taube JS. Passive transport disrupts directional path integration by rat head direction cells. J Neurophysiol 90: 2862–2874, 2003. [PubMed]
Stackman RW, Taube JS. Firing properties of head direction cells in the rat anterior thalamic nucleus: dependence on vestibular input. J Neurosci 17: 4349–4358, 1997. [PMC free article] [PubMed]
Steriade M, Deschenes M, Domich L, Mulle C. Abolition of spindle oscillations in thalamic neurons disconnected from nucleus reticularis thalami. J Neurophysiol 54: 1473–1497, 1985. [PubMed]
Tago H, Maeda T, McGeer PL, Kimura H. Butyrylcholinesterase-rich neurons in rat brain demonstrated by a sensitive histochemical method. J Comp Neurol 325: 301–312, 1992. [PubMed]
Taube JS. Head direction cells recorded in the anterior thalamic nuclei of freely moving rats. J Neurosci15: 70–86, 1995. [PubMed]
Taube JS. The head direction signal: origins and sensory-motor integration. Annu Rev Neurosci 30: 181– 207, 2007. [PubMed]
Taube JS. Interspike interval analyses reveal irregular firing patterns at short, but not long, intervals in rat head direction cells. J Neurophysiol 104: 1635–1648, 2010. [PMC free article] [PubMed]
Taube JS, Bassett JP. Persistent neural activity in head direction cells. Cereb Cortex 13: 1162–1172, 2003.[PubMed]
Taube JS, Muller RU. Comparisons of head direction cell activity in the postsubiculum and anterior thalamus of freely moving rats. Hippocampus 8: 87–108, 1998. [PubMed]
Taube JS, Muller RU, Ranck JB., Jr Head-direction cells recorded from the postsubiculum in freely moving rats. I. Description and quantitative analysis. J Neurosci 10: 420–435, 1990. [PubMed]
Traub RD, Miles R. Neuronal Networks of the Hippocampus. Cambridge, UK: Cambridge Univ. Press, 1991.
Tsanov M, Chah E, Vann SD, Reilly RB, Erichsen JT, Aggleton JP, O'Mara SM. Theta-modulated head direction cells in the rat anterior thalamus. J Neurosci 31: 9489–9502, 2011a. [PMC free
article][PubMed]
Tsanov M, Chah E, Wright N, Vann SD, Reilly R, Erichsen JT, Aggleton JP, O'Mara SM. Oscillatory entrainment of thalamic neurons by theta rhythm in freely moving rats. J Neurophysiol 105: 4–17, 2011b. [PMC free article] [PubMed]
van der Meer MA, Knierim JJ, Yoganarasimha D, Wood ER, van Rossum MC. Anticipation in the rodent head direction system can be explained by an interaction of head movements and vestibular firing
properties. J Neurophysiol 98: 1883–1897, 2007. [PubMed]
Vertes RP, Albo Z, Viana Di Prisco G. Theta-rhythmically firing neurons in the anterior thalamus: implications for mnemonic functions of Papez's circuit. Neuroscience 104: 619–625, 2001. [PubMed]
Wang B, Gonzalo-Ruiz A, Sanz JM, Campbell G, Lieberman AR. Immunoelectron microscopic study of gamma-aminobutyric acid inputs to identified thalamocortical projection neurons in the anterior thalamus of the rat. Exp Brain Res 126: 369–382, 1999. [PubMed]
Yamada WM, Koch C, Adams PR. Multiple channels and calcium dynamics. In: Methods in Neuronal Modeling, edited by Koch C, Segev I, editors. Cambridge, MA: MIT Press, 1989, p. 97–134.
Yoshida M, Hasselmo ME. Persistent firing supported by an intrinsic cellular mechanism in a component of the head direction system. J Neurosci 29: 4945–4952, 2009. [PMC free article] [PubMed]
Zhan XJ, Cox CL, Rinzel J, Sherman SM. Current clamp and modeling studies of low-threshold calcium spikes in cells of the cat's lateral geniculate nucleus. J Neurophysiol 81: 2360–2373, 1999. [PubMed]
Zhang K. Representation of spatial orientation by the intrinsic dynamics of the head-direction cell ensemble: a theory. J Neurosci 16: 2112–2126, 1996. [PubMed]