THE OXYGEN CONSUMPTION OF FLIES
DURING FLIGHT
BY R. A. DAVIS AND G. FRAENKEL
Department of Zoology and Applied Entomology, Imperial College, London
(Received i September 1940)
INTRODUCTION AND METHODS
IN tables representing the rate of oxygen consumption of various animals, calcu-lated per unit weight, by far the highest values are given by flying insects. Hitherto the most reliable determinations have been made with honey bees and several Lepidoptera, and values of 80-310 c.c. oxygen consumption per g. live weight per hour have been recorded. One of the chief difficulties that has been encountered by previous workers on this question has been to obtain insects which will fly continuously in experimental conditions in a confined space. Most previous observers worked with freely flying insects which would not fulfil this condition in a satisfactory manner. To overcome this difficulty we worked with insects flying in a fixed position, making use of the so-called flight reflex (Fraenkel, 1932). If an insect is suspended in mid-air in such a manner that there is no interference with the free movements of the wings, flight starts as a reflex action when the support is withdrawn from the legs and lasts until the legs regain contact with a solid object. In actual practice, however, flight only lasts for a limited period, varying for dif-ferent species and individuals, coming to an end through fatigue or other causes. There are, nevertheless, several flies which may fly in the suspended condition for periods of up to 1 hr. After trying out several species, including CaUiphora
erythro-cephala Mg., Phormia terranovae R.D., and Sarcophaga falculata Pand., the most
The Oxygen Consumption of Flies During Flight 403
The apparatus used in the first series of experiments was a modified Warburg respirometer, and in the second series a modified Barcroft respirometer. Both pieces of apparatus had a graduated side tube attached to them, similar to that described by Dixon (1934, p. 8), so that readings could be made under constant pressure. The bottles had a capacity of about 60 c.c, and the fly was suspended from the end of a tube connecting the interior with the outside air. The bottom of the bottles contained caustic potash as CO2 absorbing agent.
The experiments were performed in a room kept at 270 C. by thermostatic control in which the apparatus and the gas mixtures used in later experiments were continuously kept so that only very short equilibration periods were necessary. Each insect suspended in the apparatus was allowed to fly as long as it would, and the oxygen uptake was measured at intervals timed with a stopwatch. These intervals were intended to be 5 min., but as the flies would sometimes stop and start again the times of actual flight had to be measured accurately.
Table I. Oxygen consumption of flies during flight in air
Fly no. 1 2 3 4 5 6 7 8 9 Period of flight min. sec. 2 55 5 0 10 0 5 0 5 0 5 0 6 0 3 0 3 0 2 0 2 0 5 0 5 0 5 0 5 0 2 0 3 5 5 0 5 0 4 0 6 0 5 0 5 0 4 0 S
°
3 6 5 0 5 0 5 0 5 0 C)xygen con-sumption in c.c./hr./g. wet wt. 72-950 68310 27-270 20-450 20-450 20-450 53450 48-275 44-830 41380 36-210 42105 37890 35-79O 3579° 63380 87-705 43940 93I5O 71-920 91-250 87-000 93000 955OO 95-235 95212 89312 38-000 44000 48-000 Av. oxygen con-sumption in c.c./hr./g. wet wt. 706302 2 1 5 5
44-829 37-894 65-008 82-535 91687 93253 43333 Av. oxygen con-sumption in c.c./hr./g. dry wt. 241-650 84-782 I57-584 127-057 200680 239285 282-210 235-190 144-467 Wet wt. in mg. 32-5 44'O 29-0
2 8 5
35-5
36-5
4 0 0
31-5
3 0 0
Dry wt. in mg.
9-5
" • 5
8 2 5
8-5
" • 5
1 0 5
1 3 0
1 2 5
9 0
RESULTS
The consumption of oxygen was calculated both in terms of c.c. 02 per g. dry
weight per hour, and in c.c. Oa per g. wet weight per hour. None of these figures
for oxygen uptake were reduced to N.T.P. Calculations based on wet weight and on dry weight seemed to have no significant advantage over each other. The flies may have drunk water or fed on sugar just before the experiment, while others would secrete a drop of fluid from the mouth during the experiment or even defaecate. All these factors influence the water content and necessarily account for much of the variation found in different experiments. Only those figures were included in the tables where one fly gave more than one reading, the similarity of the values of several readings being regarded as a check against possible experimental errors.
Table I represents the results of a series of experiments carried out with the modified Warburg apparatus (only one chamber, manometer open at other end). It can be seen that the oxygen consumption of an individual fly remains fairly constant during subsequent periods. The variation of the values for different in-dividuals are not considered to be unduly high in view of the unavoidable variations in dry weight and wet weight on which the calculations are based, and the individual differences in oxygen consumption which are well-known phenomena, particularly in mobile poikilothermic animals.
In the second series of experiments (Table II) a modified Barcroft-type apparatus was used, because it has a compensating vessel which corrects equilibrium effects
Table I I . Oxygen consumption of flies during flight in air, in pure oxygen, and
in mixtures containing 10 and 5 % oxygen
Fly no. 1 2 3 4 S 6 7 8 9 1 0 11 Gas Air Oxygen Air Oxygen Air Oxygen Air Oxygen Air Oxygen Air Oxygen Air 10% Oxygen , Air 10% Oxygen Air 10% Oxygen Air
5 % Oxygen Air 5 % Oxygen
No. of deter-minations 5 5 2 2 4 4 5 s 3 4 4 4 3 3 3 3 3 3 3 3 3 3 Av. oxygen consumption in c.c./hr./g. wet wt.
96-700 96-670 187-500 180000
i33P3°°
138-300 78000 86000 180-950 214-200 43-4OO 6 8 4 0 0 ioo-ooo 52-380 180-000 55-000 77-270 54'54O 172-400 48-270 179-600 48-980 Av. oxygen consumption in c.c./hr./g. dry wt.
244-700 247 060 750-000 720-000 355-5°° 260-000 286660 500000 592-100 143-500 226080 300000 157-100 450000 137500 188-000 133000 550500 I55-5OO 586600 160-000 Wetwt. in nip 111 lllg. 43 43 4 0 4 0 2 4 2 4 4 0 4 0 2 1 2 1 38 38 4 2 4 2 2 0 2 0 2 2 2 2 29 29 24-5
2 4 5
Dry wt. in mg. 17 17 1 0 1 0 9 9 1 2 1 2 7-6 7-6 11-5 i i - 5
The Oxygen Consumption of Flies During Flight 405
caused by temperature changes. In cases 1-6 the respiration was measured first in air and then in pure oxygen. In three cases (1, 2, 3) the oxygen consumption was practically the same in air and oxygen; in three other cases (4, 5, 6) it was only slightly higher in oxygen than in air. It therefore seems that an oxygen partial pressure of 21 % is sufficient to cover the considerable requirements during flight. Finally, an attempt was made to determine whether and to what extent lowering of the oxygen tension would render the oxygen consumption during flight dependent on the oxygen tension. In an oxygen-nitrogen mixture, containing 10% oxygen, the oxygen consumption becomes considerably less than in air (fly 7-9). In a mixture containing only 5 % oxygen only a few flies would fly. The oxygen con-sumption is still less than in 10% oxygen (fly 10, 11).
DISCUSSION
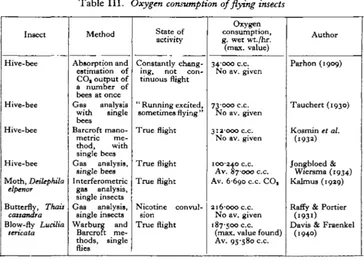
Table III contains a summary of the previous work done on the respiration of insects during flight. As can be seen from column 2, the principal method applied was to keep flying insects in a confined space and analyse the air for changes in oxygen and/or COa content. Parhon (1909) and Tauchert (1930) were not dealing
Insect
Hive-bee
Hive-bee
Hive-bee
Hive-bee Moth, Deilephila
elpenor
Butterfly, Tfuai
caisandra
Blow-fly LucUia
[image:4.451.44.408.313.573.2]sericata
Table III.
Method
Absorption and estimation of CO, output of a number of bees at once Gas analysis
with single bees
Barcroft mano-metric me-thod, with single bees Gas analysis,
single bees Interferometric
gas analysis, single insects Gas analysis,
single insects Warburg and
Barcroft: me-thods, single
flies
Oxygen consumption of flying insects
State of activity
Constantly chang-ing, not con-tinuous flight
" Running excited, sometimes flying " True flight
True flight True flight
Nicotine convul-sion
True flight
Oxygen consumption, g. wet wt./hr. (max. value)
34000 c.c.
No av. given
73-000 c.c.
No av. given
312-000 c.c.
No av. given
100240 c.c. Av. 87000 c.c.
Av. 6690 c.c. CO,
216-000 c.c.
No av. given
187-500 c.c.
(max. value found) Av. 95-580 c.c.
Author
Parhon (1909)
Tauchert (1930)
Kosmin et al.
(1932)
Jongbloed &
Wiersma (1934) Kalmus (1929)
Raffy & Portier
(i93i)
Davis & Fraenkel
(1940)
were arranged, and it is therefore impossible to discuss the results, which, com-pared with others, seem to give much too high values. Considering the differences of methods and material and the inherent difficulties of the experiment, the results of different authors seem remarkably similar. The average figures given for the bee by Jongbloed & Wiersma (1934) and for the fly by us are almost identical. The comparatively low values given for the hawk moth (Kalmus, 1929) can be explained by the much larger size and the smaller frequency of the wing beat of this moth, compared with bees and flies. The rate of the wing beat of two similar Sphingids,
Acherontia atropos and Macrogbssa bombyliformis, is 22 and 80 per sec. respectively;
bees beat their wings at a frequency of 250 per sec. approximately (Magnan, 1934). We determined the rate of the wing beat of Lucilia sericata to be 160 per sec. approximately (measured acoustically with the aid of a microphone, an oscillo-graph and an oscillator).
It can therefore be stated that an insect of the size of a fly or a bee, which vibrates the wings rapidly, consumes oxygen at a rate of approximately 100 c.c. per g. live weight per hour. It is difficult to compare this value with that for the basal metabolism. This has never been measured in active adult insects like bees and flies. The basal metabolism of blow-fly larvae is about 0-5 c.c. per g. live weight per hour (Fraenkel & Herford, 1938), and the oxygen uptake of adult blow-flies, which were not at rest, was determined as 2-3 c.c. per g. live weight per hour. It therefore seems that the ratio between the rest and the flight metabolism is in the region of 1 : 100. Flying insects maintain these extremely high rates for some time; a blow-fly may sometimes fly for more than 30 min. In man, during extreme muscular activity, the rate of metabolism increases by ten to fourteen times the normal resting exchange, but this cannot be maintained for more than a few minutes (Starling, 1936).
From our observations and those of other authors it seems reasonable to assume that the oxygen consumed during flight derives from carbohydrate metabolism. From the equation CgH^Oe + 6Oj = 6CO2 + 6H,0 it follows that 6x22-41. of
oxygen are required for 1 g.mol. carbohydrate, i.e. 180 g. Hence, a fly with an average wet weight of 31 mg. consuming oxygen at the rate of 95-58 c.c. per g. per hour would consume in 1 hr. 4 mg. of sugar. It was not found practicable to weigh flies before and after the experiment for determining the loss of weight during flight, because flies very often vomit or defaecate during the experiment, and the periods of flight are often too short for accurate determination of loss of weight to be made. A series of determinations was, however, made to find out the amount of sugar which one fly may take up in a single meal. Flies were placed on a piece of cane sugar of known weight and the weight again determined after feeding. The results in four cases were 4-8, 5-1, 4-4 and 2-3 mg. It therefore seems that a well-fed fly carries sufficient sugar to allow flight for a period of 1 hr.
The Oxygen Consumption of Flies During Flight 407
in the small vessel. This falling off in the oxygen consumption was often very marked between the first and second reading. This phenomenon, which has often been noticed in the measurement of the respiration of cold-blooded animals, is due to the fact that animals are stimulated at first after being placed in a respiratory chamber and later "settle down". This effect in our experiments was certainly not a temperature equilibration phenomenon for the following reasons: rapid wing vibration warms the body of the fly and thus the surrounding air also; the air in the vessel would then expand and the reading would be lower instead of higher. After a time a new equilibrium would be reached and the effect would die away. Again, since the readings were regular and consistent on the whole, it seems unlikely that temperature changes influenced them. Also, the Warburg method seemed just as reliable as the Barcroft method in which there is a compensating vessel.
One may make the comment on flying insects in general that nearly all those which normally vibrate their wings rapidly like bees, wasps, flies, mosquitoes, Sphingids, and other Lepidoptera, feed on carbohydrates in the form of nectar. A notable exception to this rule are tse-tse flies which feed exclusively on blood. While the amount of blood sugar is certainly too low for sustaining enduring flight (approx. o-i g. %), it can be assumed that blood contains other food substances in an easily assimilable form. Humming birds, which are very insect-like in their habits and which vibrate their wings very rapidly and on account of their small size certainly have a very high metabolism, also feed mainly on carbohydrates.
SUMMARY
A method is described by which the oxygen uptake of the blow-fly, Lucilia
sericata Mg., was measured during flight manometrically in a Warburg and in a
Barcroft type of apparatus.
The average oxygen consumption in air for all the flies used was 95-580 c.c. per g. wet weight per hour. When flying in pure oxygen the rate of oxygen con-sumption showed no significant difference; in oxygen-nitrogen mixtures, containing 10 and 5 % oxygen, the rate was considerably less than in air.
REFERENCES
DIXON, M. (1934). Manometric Methods. Cambridge. FRAENKEL, G. (1932). Z. vergl. Physiol. 16, 371-93.
FRAKNKKL, G. & HERFORD, G. V. B. (1938). J. exp. Biol. 15, 266-80. JONGBLOED, J. & WIERSMA, C. A. G. (1934). Z. vergl. Physiol. 21, 519-33. KALMUS, H. (1929). Z. vergl. Physiol. 10, 445-55.
KOSMIN, N. P., ALPATOV, W. W. & RESNITSCHENKO, M. S. (1932). Z. vergl.
Physiol. 17, 408-22.
KROOH, A. (1919). Z. allg. Physiol. 16, 9-15. MACNAN, A. (1934). Le vol des insectes. Paris. PARHON, M. (1909). Ann. Sci. nat. (Zool.), 9, 1-58.