40
©IJRASET: All Rights are Reserved
Design and Development of Noise Meter and
Automatic Alarm for Sound Intensity Level
Mark Paul A. Covita1, Michael A. Manuel2, Manny S. Alipio3
1,2Researcher, Faculty of College of Industrial Technology, Cagayan State University, Sanchez Mira Cagayan 3Ph. D, Researcher, Dean of College of Industrial Technology, Cagayan State University, Sanchez Mira Cagayan
Abstract: The developed noise meter and automatic alarm for sound intensity level are intended to provide information on the issue of noise and determine the personal characteristics of students in terms of their languages and noise produced during library activities, environment noise level, and noise reduction inside and outside of the buildings.
The circuit was intended to signal, through a flashing LED of a green light, yellow, and red light for the existence of sensitivity in the room where the noise was present, quieter noise flashed at the green light, louder noise flash at the yellow light and the loudest noise flashed at the red light. It provides the necessary circuit to amplify the sounds picked up by the condenser microphone and converted the energy in sound into an electrical signal. The sound meter produced built students awareness in an appropriate noise level.
Keywords: Development, Noise Meter, Automation, Sound Intensity Level, R&D, Noise reduction
I. INTRODUCTION
Environmental noise is defined as the noise emitted from all sources except in the industrial workplace. The major sources of environmental noise are roads, rails and air traffic, industries, construction and public works, and the neighbourhood. The extent of the environmental noise problem is very large. In the United States, over 40 percent of the population is exposed to transport noise levels exceeding 55 dB(A), and in the EC and Japan, these percentages are even higher (OEDC, 1993). In contrast to many other environmental problems, noise pollution continues to grow, accompanied by an ever-increasing number of complaints (WHO, 1999). The first principle of the World Health Organization (WHO) Constitution is its definition of health that is given as: “A state of complete physical, mental and social well-being and not merely the absence of disease or infirmity.” According to this WHO definition of health, noise impacts such as population annoyance, interference with communication, and impaired task performance are health issues. Noise has a significant impact on the quality of life and is a health problem in accordance with the World Health Organization's (WHO) definition of health (WHO, 1999). The effects of noise are seldom catastrophic and are often only transitory, but adverse effects can be cumulative with prolonged or repeated exposure. Sleep disruption, the masking of speech and television, and the inability to enjoy one's property or leisure time impair the quality of life. In addition, noise can interfere with the teaching and learning process, disrupt the performance of certain tasks, and increase the incidence of antisocial behaviour. There is also some evidence that noise can adversely affect general health and wellbeing in the same manner as chronic stress. (WHO 1999; Passchier-Vermeer and Passchier, 2000).
Many are aware that noise management is important. Noise can be a problem at busy times during the day/semester and many students have different expectations with regard to what is acceptable.
Library staff strives on a daily basis to manage noise levels and we have introduced many measures in this regard. There is a silent area designated, where talking, texting and the use of audio/laptop devices are prohibited. The bathrooms and back stairwells are designed as phone-friendly areas. For these measures to have an impact, the library users should cooperate noisy behavior themselves or report a disturbance to the library. Libraries are committed to providing the library users with a comfortable learning environment as well as a welcoming atmosphere to all users. So, students and librarians need rooms with quiet learning space so that barriers to learning are removed because Noise can impair or prevent our ability to understand.
This means that there is a need to provide a special gadget to control noisy environment to achieve quiet levels so that all students will have clear auditory access to learning in that library.
41
©IJRASET: All Rights are Reserved
Technology is the most influential industry in today’s era. We could now achieve the better way of creating new gadgets. And as time passes by, many inventions and knowledge are born.
Electronics Technology is the fastest growing industry that deals with the application of electricity through the use of special devices and materials. Therefore, the starting point is learning all the details about electronics to ease our worries and problems in creating gadget which is obviously done in Colleges or Universities like Cagayan State University to be particular, in this course they will know how to troubleshoot any kind of appliances and to create new designs base on the different kinds of electronics diagrams and have a different output and new gadget created like power amplifiers, power supplies, inverters, and with the use of electronics transducers.
One of the most important gadgets created and developed in this world is using electronics transducers and implies with the use of detector and sensors. These two transducers are widely used in traffic and parking management, security surveillance, CCTV systems, sensors for a robotic machine, signal detector and commonly used in noise pollution especially for industrial and environmental noise.
A. Conceptual Framework
The framework of this development is based on the principle of library management. A library is an organized collection of information resources made accessible to a defined community for reference or borrowing. It provides physical or digital access to material and may be a physical building or room, or a virtual space, or both. A library's collection can include books, periodicals, newspapers, manuscripts, films, maps, prints, documents, microform, CDs, cassettes, videotapes, DVDs, Blu-ray Discs, e-books, audiobooks, databases, and other formats. Libraries range in size from a few shelves of books to several million items.
Most libraries while ensuring that the necessary facilities are available to its users, also seek to provide an atmosphere conducive enough for research, study, and assimilation. However, noise is a major hindrance to achieving such conducive arrangement in modern libraries as it has become a rampant issue of note over time. Therefore, measures need to be taken to help eliminate the problem of noise in our libraries so as to promote ideal conditions in libraries today. The simplest way to determine the background level of noise in a specific classroom is to use noise detection meter. We can use this transducer by sensing audio signal in classroom management for an effective process of learning.
The researcher presumably would conclude that the better the environmental place is, the better the orientation for the students. The better the orientation for the students, the more their learning grow. As their learning grows, which subsequently increases their knowledge; better performances are shown by them.
The development was focused on the Input-Process-Output Model. In the IPO model, a process is viewed as a series of boxes (processing elements) connected by inputs and outputs. Information or material objects flow through a series of tasks or activities based on a set of rules or decision points. (Harris & Taylor, 1997) Flow charts and process diagrams are often used to represent the process. (Harris & Taylor, 1997) What goes in the input; what causes the change is the process; what comes out is the output (Armstrong, 2001).
This material or gadget has a capacity to detect noise which enables a LED and alarm when any sound (especially human voice) is detected. The output reference of that gadget is the most important parameter of the system. This is a sound meter to build students awareness of appropriate noise levels. Noise meters are devices that measure the volume of sounds. There are precise noise meters that measure sound in decibels, as well as more generic noise meters that display less precise levels of volume.
Processes used management resources to provide definitive results. As with any other problem that may not be blatantly obvious, our first step would be processed to determine if and to what extent noise exists and then determine if this level of noise is a problem. The simplest way to determine the background level of noise in a library is to use an automatic alarm and noise meter. This is best accomplished by monitoring an unoccupied room with any background noise. Next if possible monitor the same room with any other internal or external noise sources that would be present during regular library hours. So, you can use noise meters in multiple ways in the library: one use is to illustrate the concept of this project, and another is as a library management tool that can help students learn to monitor their noisiness.
Having undergone the processes, the expected output will be the detection of noise and its effect on library management on how to reduce the excessive reverberation and noise sources that will affect educational activities.
II. OBJECTIVES
A. Objectives of the Development
42
©IJRASET: All Rights are Reserved
Specifically, it determined:
1) The frequency of librarian’s reminder for noisy students for five library days
2) The Attitude of students towards the innovated noise meter
III.METHODOLOGY
A. Innovation and Assembly Procedure
[image:3.612.109.520.207.311.2]The original circuit of power supply (refer to fig. 1) was used capacitor for the input and output voltage of the circuit and the modified diagram (refer to fig. 2) was used transformer less power supply using different electronic component to form a simple circuit but similar function.
[image:3.612.106.516.355.491.2]Figure #1 represents the prior art schematic diagram of the power supply
Figure #2 represents the modified schematic diagram of the power supply
The comparator circuit (refer to Fig.3) used three resistors for the input signal in appropriate level of sounds computed for the exact decibel range. The output signals of the comparator circuit used only one Light Emitting Diode to display the signal of sounds. The modified diagram (refer to Fig.4) was used a minimum number of component to the input signal for the appropriate sound detection and changing the characteristics of the component for the appropriate signal from the comparator circuit
[image:3.612.76.483.581.712.2]43
[image:4.612.122.489.86.303.2]©IJRASET: All Rights are Reserved
Figure #4 represents the modified schematic diagram of the comparator circuit
The original circuit of the read out display (refer to fig. 5) cannot used a capacitor for the input signal and used a minimum number of light emitting diode for the light display. This was modified (refer to fig. 6) by putting a capacitor to cut off the DC signal for the input and changing to a potentiometer for an appropriate resistance in controlling the output signal connected on the output of comparator and input of the read out display.
[image:4.612.128.491.397.715.2]44
[image:5.612.111.475.76.205.2]©IJRASET: All Rights are Reserved
Figure #6 represents the modified schematic diagram of the read out display circuit
[image:5.612.166.393.279.399.2]The original circuit for the alarm (refer to fig.7) cannot used a relay switch connected to the transistor and buzzer. This was modified to (refer to fig. 8) to a simple circuit that has a relay switch and read out display in controlling the buzzer.
Figure #7 represents the prior art schematic diagram of the alarm circuit
[image:5.612.108.508.438.711.2]45
©IJRASET: All Rights are Reserved
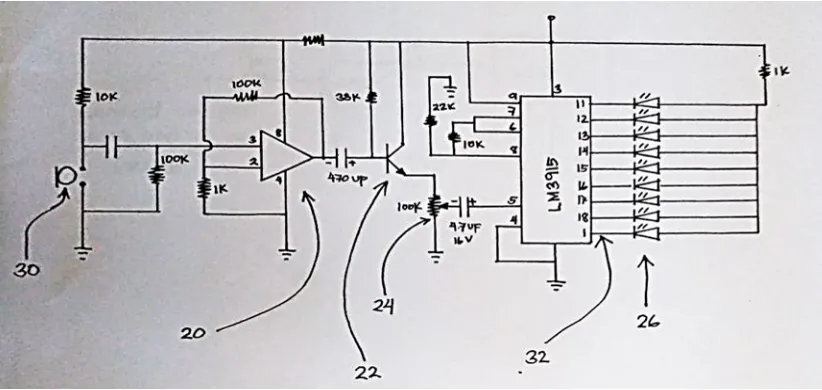
[image:6.612.98.509.105.300.2]Every stage in a circuit has only one function; the different circuit were joined together to form a single circuit that produced only one function (refer to fig.9).
Figure #9 represents the whole modified schematic diagram of the noise meter
The Power supply stage distributed the exact voltage of the circuit. The Microphone stage used a multiple directional condenser microphone to capture the sound and converted it to electrical signal. The Amplification stage amplified the signal and the Comparator stage changed the output level when the amplifier signal was higher from the reference voltage. A Volume unit meter or standard volume indicator (SVI) stage was a device displaying a representation of the signal level produced by the sounds detection circuit.
This circuit was intended to signal, through a flashing LED from a green light, yellow, to red light, depending on the intensity level produced. It provided the necessary circuit gain for sounds picked-up by a condenser microphone to convert the energy in sound into electrical signal.
This was a simple circuit that can detect sounds by using a common condenser microphone. Sensitivity was a variable. The circuit output became high each time a sound was detected; otherwise it was in low level.
B. Testing Procedure
During the testing of the innovated noise meter, removing and changing of component parts were considered. The procedure done in testing were as follows:
C. Power Supply
Measured the voltage output by the used of multimeter for the exact voltage supply of the comparator and displayed 12 volts regulated.
D. Comparator Circuit
Connect the supply and measured the signal of the comparator circuit using decibel in multimeter, this signal can drive the light emitting diode to display depends on the frequency of the sound signal detected by the condenser microphone.
E. LED VU Meter
The input signal drive by the comparator circuit were triggered the base of the transistor to switch the negative supply of the LED to display and measured the signal voltage for the buzzer.
F. Buzzer
46
©IJRASET: All Rights are Reserved
During the testing when the noise registered at unacceptable level, adjustment of the threshold was made for the frequency of the signal, slow function of the read out display was occurred. This was changing the resistance of the resistor connected at the base and collector of the transistor into appropriate resistance. This solve the problem when the read out displays accurately.
G. Research Design
This development made used of the descriptive design. It described the frequency of the librarian as well as the attitude of the students towards the noise meter. The descriptive design was described the efficiency testing of the noise meter on how many times the librarian had called the attention of the students.
H. Data Gathering Procedure
The effectiveness of the noise meter was determined by measuring the librarian’s frequency of warning noisy students. This study used two groups, one without the noise meter and the other with the noise meter in the same library which was done in an alternate manner. During the first week no noise meter was used.
Library activities went on as normal and used tally sheet to show the findings and record the number of times the librarian called the attention of the students to keep quiet while they were in the library.
On the second week of testing the library was installed with the noise meter. The researcher stayed in the library to observe and record the data as a result of the installation of the noise meter. After one week of observation the questionnaire was used to measure the attitude of the students towards the noise meter.
The attitude of students towards the noise meter and locating the proper orientation of the sound sensor for appropriate detection was also considered during the testing. During the first day, the noise meter always registered a red light and executed an alarm because students are not aware with the use of the gadget until they learn the gadget functions up to decrease the level of noise produced inside the library. When this happen the function of the noise meter is to remind the students just to keep silent when alarm is executed.
In testing the innovated gadget, adjustments were made so as the threshold frequency will adjust the frequency of light that could be detected by the noise meter. When the students produced quieter noise it registered as the green light, louder noise is registered as the yellow light and the loudest noise is registered as the red light. The gadget produced a sound when it reaches prolonged sounds and it measured 71 decibels (full bright) which is already an unacceptable level of sound inside a library, the students stopped their noise when they heard the sounds from the gadget, so, it served as reminder to them to shut up. The noise meter was used to warn the students to keep quiet while they are in the library by the alarm emitted when it received loud or unacceptable level of sound inside the library.
The impact of sounds registered to the read out display was measured in a decibel of the multimeter and every label of light has corresponding measurement. Green light measured 0-26 dB, Yellow light 27-60 dB, and red low bright measured 61 -70 dB and executed an alarm for the full bright of red-light display, and it measured 71 dB up to the maximum required sound signal.
I. Statistical Analysis of Data
The data gathered were analysed using the following statistical tools:
The t-test was used to compare the number of times the librarian had called the attention of the students during the eight-hour library period.
Likewise, the attitude of the students towards the use of the noise meter and automatic alarm was determined using mean. The following scale was used:
Point Range Descriptive Value Arbitrary Scale
5 - 4.21 – 5.0 - Strongly Agree - High Positive
4 - 3.41 - 4.20 - Agree -Positive
3 - 2.41 - 3.40 - Neither Agree - Neutral
2 - 1.81 – 2.40 - Disagree - Negative
47
©IJRASET: All Rights are Reserved
IV.RESULTSANDDISCUSSIONS
A. Description of the Innovated Noise Meter
B. The following are the main parts of the Innovated Noise Meter.
1) Electric Chord can provide a passage of voltage from the source to the power supply circuit of the innovated noise meter.
2) Threshold Frequency were adjusted for the appropriate detection.
3) Reset Button was used for cutting the supply when the buzzer sound prolonged.
4) Multiple Condenser Microphone for sounds detection.
5) Light emitting diode for the display, and;
6) Buzzer for automatic alarm.
7) Read Out Display was used to display appropriate reading on the level of the light.
The gadget was assembled into rectangular fibre glass case with a read out display arranged in vertical position beside the buzzer and condenser microphone. The sensitivity level mounted at the back of the read out display casing and power on/off switch mounted at the back of the base of the gadget.
C. Effectiveness of the innovated gadget
The innovated noise meter was installed in the library and produced a sound when the noise created 71 dB and above. This was an unacceptable level of noise of students inside a library.
D. Librarian’s Frequency of Warning
48
[image:9.612.97.520.91.134.2]©IJRASET: All Rights are Reserved
Table 1 presents the Mean frequency of librarian’s reminders for noisy students for five days (8-5).
E. Attitudes of students towards noise meter
When the group of students produced noise inside the library, the noise meter alarmed just to remind them to keep silent and they kept their mouth shut until the sounds stop and registered at minimum level of frequency.
Table 2 presents the students’ attitude towards the noise meter
[image:9.612.78.518.274.558.2]For the ten indicators, all the positive statements fell in the descriptive value of strongly agree. It means that the noise meter was effective in controlling beyond unacceptable level of sounds produced by the students and this helped a lot in maintaining silence and providing the students in creating an atmosphere conducive for learning.
Table 2. Students’ Attitude towards the Noise Meter
Indicators Weighted
Mean
Descriptive Value
1. I am disturb when the noise meter beeps 3.10(2.9) Neither Agree
2. The noise meter helps us students to control our voices and other noise.
4.90 Strongly Agree
3. The noise meter is to be used all day 4.40 Strongly Agree
4. I stop conversing with my companions when the noise meter beeps.
4.40 Strongly Agree
5.The noise meter helps a lot in maintaining silence inside the library.
4.60 Strongly Agree
6.The noise meter is very sensitive in detecting sounds even noise outside the library.
4.05(1.95) Disagree
7.The noise meter is effective in controlling noise. 4.70 Strongly Agree
8.The noise meter reminds me to keep silent even outside the library.
4.40 Strongly Agree
9.The library with a noise meter is a good example of silent library.
4.60 Strongly Agree
10.The noise meter helps the librarian in maintaining silence in the library.
4.80 Strongly Agree
***For negative statements, the scoring was inverted (e.g. item 1 & 6)***
To determine the over-all attitudes of students towards the noise meter, the negative statements were inverted before the mean attitude score was computed. The attitude of respondent towards the noise meter is: X=4.16 (Positive)
V. SUMMARYOFFINDINGS,CONCLUSIONSANDRECOMMENDATIONS
A. Summary of Findings
The noise meter was a simple device with audio-frequency sensing capabilities controlled essentially by a multiple condenser microphone in detecting sounds and regulating audio signals by the comparator circuit to produce signal voltage for the display and trigger the buzzer top alarm. There are nine component parts used in this gadget like resistors, capacitors, diodes, transistors, integrated circuits, condenser microphones, switches and aluminium materials for the casing. This project focused on measuring the various sounds frequency of librarians to warn the student’s noise, all in a bid to limit unnecessary noise in the library through alarm once the critical sound level has been exceeded.
Group Mean Standard Deviation
With noise meter 13.8 3.42
49
©IJRASET: All Rights are Reserved
VI.CONCLUSION
Based from the discussion of findings, the innovated noise meter is very effective in controlling unacceptable sound level and maintaining silence inside the library.
A. Recommendations
Based from the summary, the following recommendations are offered:
1) The noise meter should be used in the hallway for reducing noise when students go out from their respective classrooms.
2) The noise meter should be made as a battery-powered device, and converts the buzzer into a high-voltage supply for sound beeping, and change the condenser microphone for a large size for the recognition of sounds.
3) The noise meter should be used as instructional device in electronics subject for the advantages and importance of sensor and
detector for many functions.
4) The noise meter foil pattern should be made into small circuit design to decrease the size of the casing.
5) The noise meter should minimize the type and number of component in the read out display to decrease the total cost of the gadget.
REFERENCES
[1] Windbond ISD1700 Series Multi-Message Single Chip Voice Record and Playback Devices, 2007. [2] P. Scherz, Practical Electronics for Inventors, New York: McGraw-Hill, 2000.
[3] U. O. Georgia and K. .. I. N. Nwalo, “Perception by Undergraduate Students of the Environmental Conditions and Resources Availability in Selected University Libraries in Nigeria,” African Journal of Library and Information Science, vol. 21, no. 1, pp. 73-78, 2011.
[4] K. I. N. Nwalo, “Measure of Library Effectiveness in Nigerian Polytechnic Libraries with Emphasis on User Satisfaction,” Journal of Librarianship information science in Africa, vol. 1, no. 1, pp. 41-50, 2001.
[5] A. N. G. Alutu and C. N. Ojogwu, “Study behavior techniques and learning environment of undergraduates in the university: A case study of University of Benin,” Emotan Journal of fine and Applied Arts, University of Benin, vol. 1, no. 1, pp. 41-50, 2002.
[6] J. E. K. Foreman, Sound Analysis and Noise Control, New York: VAn Nostarnd Reinhold, 1990. [7] P. Cunnif, Environment Noise Pollution, New York: John Wiley & Sons, 1977.
[8] M. Predko, Programming and Customizing the PIC Microcontroller, 3rd ed., New York: McGraw-Hill, 2008.
[9] Henning E. von Gierke and DanielL. Johnson, "Noise-How Much Is Too Much?" (Paper presented at the National Conference on Noise Control Engineering, Gaithersburg, Maryland, September 1975)
[10] Von Gierke and Johnson, "Noise-How Much Is Too Much?
[11] Gilbert W. Schmidt and Roger E. Ulrich, "Effects of Group Contingent Events upon Classroom Noise," journal of Applied Behavior Analysis 2:171-79 (Fall1969).
[12] Cheryl Wright Wilson and B. L. Hopkins, "The Effects of Contingent Music on the Intensity of Noise in Junior High Economics Classes," journal of Applied Behavior Analysis 6:269-75 (Summer 1973).
[13] Andrew W. Meyers, Lynn M. Artz, and W. Edward Craighead, "The Effects of Instructions, Incentive and Feedback on a Community Problem: Dormitory Noise," journal of Applied Behavior Analysis 9:445-57 (Winter 1976).
50
©IJRASET: All Rights are Reserved
An easy way to comply with IJRASET paper formatting requirements is to use this document as a template and simply type your text into it.
A. Page Layout
Your paper must use a page size corresponding to A4 which is 210mm (8.27") wide and 297mm (11.69") long. The margins must be set as follows:
1) Top = Bottom= 19mm (0.75")
2) Left = Right = 14.32mm (0.56")
VII. PAGESTYLE
All paragraphs must be indented. All paragraphs must be justified, i.e. both left-justified and right-justified.
A. Text Font of Entire Document
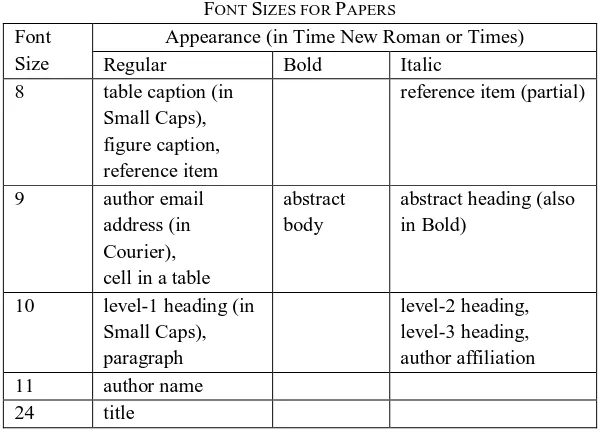
The entire document should be in Times New Roman or Times font. Type 3 fonts must not be used. Other font types may be used if needed for special purposes.
Recommended font sizes are shown in Table 1.
B. Title and Author Details
Title must be in 24 pt Regular font. Author name must be in 11 pt Regular font. Author affiliation must be in 10 pt Italic. Email address must be in 9 pt Courier Regular font.
TABLEI
FONT SIZES FOR PAPERS
Font Size
Appearance (in Time New Roman or Times)
Regular Bold Italic
8 table caption (in
Small Caps), figure caption, reference item
reference item (partial)
9 author email
address (in Courier), cell in a table
abstract body
abstract heading (also in Bold)
10 level-1 heading (in
Small Caps), paragraph
level-2 heading, level-3 heading, author affiliation
11 author name
24 title
All title and author details must be in single-column format and must be centered.
Every word in a title must be capitalized except for short minor words such as “a”, “an”, “and”, “as”, “at”, “by”, “for”, “from”, “if”, “in”, “into”, “on”, “or”, “of”, “the”, “to”, “with”.
Author details must not show any professional title (e.g. Managing Director), any academic title (e.g. Dr.) or any membership of any professional organization (e.g. Senior Member IEEE).
To avoid confusion, the family name must be written as the last part of each author name (e.g. John A.K. Smith).
Each affiliation must include, at the very least, the name of the company and the name of the country where the author is based (e.g. Causal Productions Pty Ltd, Australia).
Email address is compulsory for the corresponding author.
C. Section Headings
[image:11.612.156.456.347.565.2]51
©IJRASET: All Rights are Reserved
1) Level-1 Heading: A level-1 heading must be in Small Caps, centered and numbered using uppercase Roman numerals. For example, see heading “III. Page Style” of this document. The two level-1 headings which must not be numbered are “Acknowledgment” and “References”.
2) Level-2 Heading: A level-2 heading must be in Italic, left-justified and numbered using an uppercase alphabetic letter followed by a period. For example, see heading “C. Section Headings” above.
3) Level-3 Heading: A level-3 heading must be indented, in Italic and numbered with an Arabic numeral followed by a right parenthesis. The level-3 heading must end with a colon. The body of the level-3 section immediately follows the level-3 heading in the same paragraph. For example, this paragraph begins with a level-3 heading.
[image:12.612.209.402.284.421.2]D. Figures and Tables
Figures and tables must be centered in the column. Large figures and tables may span across both columns. Any table or figure that takes up more than 1 column width must be positioned either at the top or at the bottom of the page.
Graphics may be full color. All colors will be retained on the CDROM. Graphics must not use stipple fill patterns because they
may not be reproduced properly. Please use only SOLID FILL colors which contrast well both on screen and on a black-and-white
hardcopy, as shown in Fig. 1.
Fig. 1 A sample line graph using colors which contrast well both on screen and on a black-and-white hardcopy
Fig. 2 shows an example of a low-resolution image which would not be acceptable, whereas Fig. 3 shows an example of an image with adequate resolution. Check that the resolution is adequate to reveal the important detail in the figure.
Please check all figures in your paper both on screen and on a and-white hardcopy. When you check your paper on a black-and-white hardcopy, please ensure that:
1) the colors used in each figure contrast well,
2) the image used in each figure is clear,
3) all text labels in each figure are legible.
[image:12.612.243.362.601.711.2]E. Figure Captions
Figures must be numbered using Arabic numerals. Figure captions must be in 8 pt Regular font. Captions of a single line (e.g. Fig. 2) must be centered whereas multi-line captions must be justified (e.g. Fig. 1). Captions with figure numbers must be placed after their associated figures, as shown in Fig. 1.
52
[image:13.612.251.359.83.248.2]©IJRASET: All Rights are Reserved
Fig. 3 Example of an image with acceptable resolution
F. Table Captions
Tables must be numbered using uppercase Roman numerals. Table captions must be centred and in 8 pt Regular font with Small Caps. Every word in a table caption must be capitalized except for short minor words as listed in Section III-B. Captions with table numbers must be placed before their associated tables, as shown in Table 1.
G. Page Numbers, Headers and Footers
Page numbers, headers and footers must not be used.
H. Links and Bookmarks
All hypertext links and section bookmarks will be removed from papers during the processing of papers for publication. If you need to refer to an Internet email address or URL in your paper, you must type out the address or URL fully in Regular font.
I. References
The heading of the References section must not be numbered. All reference items must be in 8 pt font. Please use Regular and Italic styles to distinguish different fields as shown in the References section. Number the reference items consecutively in square brackets (e.g. [1]).
When referring to a reference item, please simply use the reference number, as in [2]. Do not use “Ref. [3]” or “Reference [3]” except at the beginning of a sentence, e.g. “Reference [3] shows …”. Multiple references are each numbered with separate brackets (e.g. [2], [3], [4]–[6]).
Examples of reference items of different categories shown in the References section include:
1) example of a book in [1]
2) example of a book in a series in [2]
3) example of a journal article in [3]
4) example of a conference paper in [4]
5) example of a patent in [5]
6) example of a website in [6]
7) example of a web page in [7]
8) example of a databook as a manual in [8]
9) example of a datasheet in [9]
10) example of a master’s thesis in [10]
11) example of a technical report in [11]
12) example of a standard in [12]
VIII. CONCLUSIONS
53
©IJRASET: All Rights are Reserved
Word. The LaTeX templates depend on the official IEEEtran.cls and IEEEtran.bst files, whereas the Microsoft Word templates are self-contained. Causal Productions has used its best efforts to ensure that the templates have the same appearance.
Causal Productions permits the distribution and revision of these templates on the condition that Causal Productions is credited in the revised template as follows: “original version of this template was provided by courtesy of Causal Productions (www.causalproductions.com)”.
IX.ACKNOWLEDGMENT
The heading of the Acknowledgment section and the References section must not be numbered.
Causal Productions wishes to acknowledge Michael Shell and other contributors for developing and maintaining the IEEE LaTeX style files which have been used in the preparation of this template. To see the list of contributors, please refer to the top of file IEEETran.cls in the IEEE LaTeX distribution.
REFERENCES
[1] S. M. Metev and V. P. Veiko, Laser Assisted Microtechnology, 2nd ed., R. M. Osgood, Jr., Ed. Berlin, Germany: Springer-Verlag, 1998.
[2] J. Breckling, Ed., The Analysis of Directional Time Series: Applications to Wind Speed and Direction, ser. Lecture Notes in Statistics. Berlin, Germany: Springer, 1989, vol. 61.
[3] S. Zhang, C. Zhu, J. K. O. Sin, and P. K. T. Mok, “A novel ultrathin elevated channel low-temperature poly-Si TFT,” IEEE Electron Device Lett., vol. 20, pp. 569–571, Nov. 1999.
[4] M. Wegmuller, J. P. von der Weid, P. Oberson, and N. Gisin, “High resolution fiber distributed measurements with coherent OFDR,” in Proc. ECOC’00, 2000, paper 11.3.4, p. 109.
[5] R. E. Sorace, V. S. Reinhardt, and S. A. Vaughn, “High-speed digital-to-RF converter,” U.S. Patent 5 668 842, Sept. 16, 1997. [6] (2002) The IEEE website. [Online]. Available: http://www.ieee.org/
[7] M. Shell. (2002) IEEEtran homepage on CTAN. [Online]. Available: http://www.ctan.org/tex-archive/macros/latex/contrib/supported/IEEEtran/ [8] FLEXChip Signal Processor (MC68175/D), Motorola, 1996.
[9] “PDCA12-70 data sheet,” Opto Speed SA, Mezzovico, Switzerland.
[10] A. Karnik, “Performance of TCP congestion control with rate feedback: TCP/ABR and rate adaptive TCP/IP,” M. Eng. thesis, Indian Institute of Science, Bangalore, India, Jan. 1999.
[11] J. Padhye, V. Firoiu, and D. Towsley, “A stochastic model of TCP Reno congestion avoidance and control,” Univ. of Massachusetts, Amherst, MA, CMPSCI Tech. Rep. 99-02, 1999.