Classification of Remotely Sensed Data by Texture
Features with the Nature-Inspire Optimization
Algorithm
Shelly Rani1, Sakshi Dhingra2
1
Student of Master in Technology, Department of Computer Science and Application Chaudhary Devi Lal University, Sirsa, Haryana, India
2
Assistant Professor, Department of Computer Science and Application, Chaudhary Devi Lal University, Sirsa, Haryana, India
Abstract: At regular intervals, the satellite remote sensing technologies collect images/data and volume of information gathered is substantial and it is developing exponentially as the innovation is developing at a quick speed. Remote sensing technique has been extensively utilized for recognition of land use and land cover structures. In this paper, we have used four classes of images which are enhanced by Prewitt filter and features are extracted by texture approaches, which increases the pattern visibility. The proposed methodology here includes an efficient feature extraction and further classification of the satellite images on the basis of these features using Particle Swarm Optimization, hybrid (PSO+ACO). For the training Convolution Neural Network (CNN) is used. The various performance metrics have been determined and contrasted according to the recovered satellite images from the dataset.
Keywords: Satellite Images, Classification, Optimization and Neural network.
I. INTRODUCTION
Satellite image classification is a technique which is used to extract the useful data from the satellite. Satellite image classification is not difficult but during the classification, process analyst has to decide many things.
Satellite image classification includes the remote sensing pictures, spatial information and different studies about the agriculture and lands. Classification of images plays a significant role in image sensing. Classification process depends on training process and samples of the images.
A. Satellite Image Techniques
Image sensing technique is divided into three categories:
1) Automated: Automated satellite image classification strategies utilize and calculate that connected deliberately the whole satellite image to a large number of pixels into important classes. The Larger part of the classification techniques falls under this classification. Automated satellite image classification technique additionally characterized into two Types 1) Supervised 2) Unsupervised classification strategies.
2) Supervised: In this method of classification, signatures are obtained from the training samples that are obtained by classifying the image then these samples are used for the classification.
3) Unsupervised: Unsupervised classification procedure utilized clustering algorithm to group satellite image pixels into unlabeled classes/groups. Later examiner appoints significant name to the clusters and delivers all-around ordered satellite image. ISODATA, Support Vector Machine (SVM) and K-Means are the basic unsupervised satellite image classification techniques. 4) Manual: These picture arrangement strategies are robust, powerful and proficient techniques. In any case, manual strategies
expend additional time. In the manual strategies, the expert must be comfortable from the area covered by the satellite picture. Proficiency and exactness of the order rely upon investigator learning and commonality towards the field of study.
B. Algorithm Used
1) PSO (Particle Swarm Optimization): Each individual solution is a “bird” in the search space which is called as “particle”. All of the particles have fitness that is assessed by the fitness capacity to be improved and have velocities which coordinate the flying of the particles. The particles fly through the issue space domain by following current greatest particles. PSO is introduced with a gathering of arbitrary particles and by updating generations it searches for an optimum value. With the number of iterations, an individual particle is updated by two ‘best’ values i.e. the best solution for best fitness which is known as pbest. Another value is the value which is followed by the PSO that is obtained by any particle in the population; this value is called as gbest. At the point when a particle removes a portion of the population as its topological neighbours, this value is best in local so termed as lbest.
2) ACO (Ant Colony Optimization): Ant algorithm was introduced by Dorigo M. in 1996 based on the real ant behavior and it’s a new heuristic algorithm to solve combinational optimization issues. Investigations have demonstrated that ants have the ability to find food in an optimal path between the food and nest. With the ant motion some pheromone is discharged on ground, past laid trail is experienced by confined ant is being identified and follow with a higher probability. The ant’s probability of picking the path relies on the pheromone focus on that way. Higher the pheromone focus, higher will be the probability of that way selection. An ideal path can be found by using this positive mechanism of feedback.
II. RELATED STUDY
A. Graeme G et.al.
A review of 15 years paper on satellite image classification is performed in the given paper. The primary objective of this investigation is to map the progress in the classification showing the accuracy is incrementing or decrementing. At last, it shows a better result in accuracy and other parameters [2].
B. Markov Random Field Approach
Kan Xu et al. showed a profitable unsupervised semantic characterization strategy for high-assurance satellite pictures. It incorporates stamp cost, which can rebuff an answer in light of a plan of names that appear in it by streamlining of essentialness, to the self-assertive fields of sit without moving subjects, and to influence the no. of classes finally to be centered to a reasonable level by using an iterative algorithm. Differentiated and other said grouping algorithms, its procedure not only can get exact semantic division comes to fruition by greater scale structures also can normally select a number of bits. The test comes to fruition in a couple
of scenes have displayed its practicality and generosity [3].
Solberg, Anne H et al. describes multisource classification. It proposed the Markov random field model. The performance of MRF model is high on different images. It is very useful for the classification of images of multisource satellite [4].
Gigandet, Xavier, et al In this paper, creator proposed an approach for high determination satellite pictures. In this paper there is classification of two procedure non-supervised segmentation with a supervised classification. Gaussian Hidden Markov Random Field (GHMRF) display utilized for the division of multi-ghostly information and nearby spatial priors. SVM and Mahalanobis separate classifier is utilized for power, surface and shape highlights. Spectral and spatial highlights computed on divided areas and give great outcomes [5].
C. Bio-inspired Based Approach
Johal et.al. This paper oversees picture arrangement by using swarm registering framework. In this work, it used another swarm data bundling procedure in view of blossom fertilization by fake honey bees to combine the satellite picture pixels. The purpose of grouping is to isolate a game plan of data centers into self-near social events. These bundles had been furthermore portrayed using Biogeography Based Optimization. The results show the exact order of the satellite images gained by using the proposed method [6].
D. Bayesian Approach
Vailaya, A, et al. In this paper by using low-level visual features researcher grouped outdoor and indoor images into a meaningful image. On the basis of image recovery, it is an essential and complicated problem. They obtained the image with high-level concepts from low-level features of an image by using binary Bayesian classifier. That happened by assuming as test image that is related to one of the classes. There is a classification of the highest level image as indoor or outdoor images and landscape as a
E. Likelyhood Classifier Based Approach
Akgün et. al. describes the particular circumstance, strategies for upgrading the request of land use with satellite remote identifying information consolidate the utilization of fitting automated information. With a particular ultimate objective is to fulfill an assignment, assurance of the suitable satellite picture, band blend, and classifier. In addition, the photo dealing is with key and assorted periods of it, for instance, isolating of gatherings and fundamental section examination should be associated before evaluation. Each one of these concentrations was associated with this examination and it has been seen that most prominent likelihood classifiers were the most suitable game plan system for arriving use mapping reason. Slightest division’s classifier was moreover chosen as sensible as the most extraordinary likelihood classifier [8].
1) Expectation Maximization Approach: Banerjee, Biplab, et al. Cluster based calculation approach is proposed in this paper. The cluster combines numerous information parcels created by various grouping calculations into a solitary arrangement. Expectation maximization (EM) calculates which creates a decent guess of the group parameters. The author takes best results on medium resolution and high spatial resolution pictures [9].
2) SVM –Based Approach: Tuia, Devis, et al. proposed Two learning algorithm for Remote images. These two algorithms are applied on the high spectral images using support vector machines. This method provides the good results on the large data set. Qualities of the selection of pixels from the images are also discussed [10].
3) CNN-Based Approach: Romero, Adriana et al. depicted the single layer and deep convolution networks for remote sensing images. They introduce techniques for unsupervised learning of sparse features. Two analyses are performed in it that are principle component analysis and kernel counterpart [11].
III. PROPOSED WORK
In this section PSO and ACO algorithm is used for the optimization. Here, we discussed the proposed methodology and the flow chart of the algorithm:
1) Step 1: In this algorithm images are given as the input for the transformation.
2) Step 2: From images we extract the features. These features are used as particles and given to the input of PSO algorithm. 3) Step 3: PSO and ACO work parallel and performed local and global optimization of the features.
4) Step 4: CNN is used for the classification of the patterns.
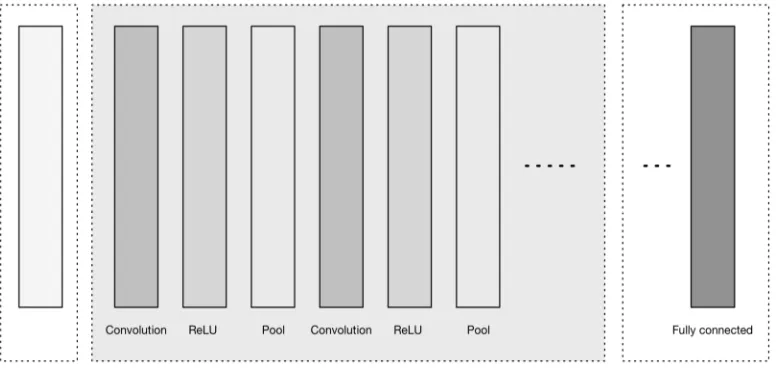
[image:3.612.111.499.490.676.2]In the convolution layer multiple filters are used to learn the different features from the input layer. The output layer shows the result after transformation with an activation function that is the Rectified Linear Unit (ReLU) activation function. The pooling layer is placed between two convolution layers. The spatial size of the data representation is reduced by using pooling layer with convolution layer. The number of parameters are also reduced which reduced the computation of network. The reduction in parameter size helps in over fitting.
The above given figure 3.1 represents the CNN Architecture
a) Input layer
b) Feature-extraction (learning) layers
c) Classification layers
The Input layer accepts the 3-D input in the form of spatially (width × height) of image and depth represents color channels. The feature extraction layers repeat the sequence of the patterns:
A. Input Layers
Input layer are the layers where the raw input is loaded in the form of image for processing on network. The input data that is image specifies with height, width and number of channels.
[image:4.612.242.372.224.379.2]Figure 3.2: Input layer 3D volume
B. Convolutional Layers
These layers are the building blocks of the CNN designs. The below given figure show the convolution layers which transforms the input data by utilizing a patch of locally interfacing neurons from the past layer. The layer performs the dot product with input layer and the weight. The result of this is shown on output layer.
Figure 3.3: Convolution Layers
[image:4.612.166.451.463.682.2]Algorithm 1:Updates the swarms
The swarm is updated by the following method. For particle s, which is at position 1(s):
1) A random subset K of x particles rather than s is selected.
2) Evaluate ‘b’ best (x), the best function among the neighbors and C(x), the position of the neighbor with respect to the best
function.
3) Velocity’s’ has to update for r1 and r2 uniformly distributed random vectors (0,1) having length ‘l’ .the updated velocity is :
u = M×u + e1×r1. × (q-l) + e2×r2. × (c-l).
weighted sum used by the update :
a) u is denoted as the previous velocity
b) q-l it is the difference in the current and best position of the particles
c) C-l it is the difference in the current neighborhood between current and best position. Update the position l = l + v.
4) Implement the bounds. If any part of n is outside the bond, set that part equals to that bound.
5) Find the objective function i.e. t= fun(1)
6) It has been seen that q has the best position in the particle if t < fun (q)
7) The setup ensures in swarms that b as the best objective function and j as the best location, if t < f, then set f = t and j=1.
8) If the value of best function was lowered in previous step, then set flag is equal to true, otherwise flag equal to false. We use the
value of flag in next step.
9) If flag is equal to true we have to update neighborhood :
a. Set y = max (0, y-1).
b. Set X to min Neighborhood Size.
c. If y < 2, then set M = 2×M.
d. If y > 5, then set M = M/2.
e. Ensure that M is in the bounds of Inertia Range option.
If flag is equal to false: a. Set y = y+1.
IV. RESULT
The algorithm proposed in the previous section has been implemented in the Matlab. The algorithm has been applied to the multi-spectral, multi-resolution images of the QUICK BIRD satellite. It collected images data to 0.65 pixel resolution degree. It gives the images data related to land, agricultural and forest climates. This database contains image size 512*512.
A. Performance Metrics
In this proposed work four different metrics are taken i.e. accuracy, precision, recall, F-measure. All the performance metrics are defined and discussed below:
1) Accuracy: It is the fraction number of correct prediction to the total number of all classes to be predicted
= (1)
2) Sensitivity: In the field of data retrieval, precision is the ratio of retrieved reports that are pertinent to the inquiry:
Sensitivity =|{ }∩{ }| (2)
3) Specificity: In data recovery, a recall is the ratio of the pertinent report that is effectively recovered.
Specificity =|{ }∩{ }| (3)
4) F- Score: A measure that consolidates accuracy and recall is the harmonic mean of precision and recall, the traditional F-measure or balanced F-score:
F−Score = 2∗ . (4)
[image:6.612.191.422.401.475.2]The given measure is an average of the two when they are close called as harmonic mean. Where two numbers coincide with the square of the geometric mean and divided by the arithmetic mean. There are some reasons that the F-score will be criticized for specific conditions because of the inclination on it evaluation metrics. As specificity and sensitivity are uniformly weighted this is also termed as F1 measures.
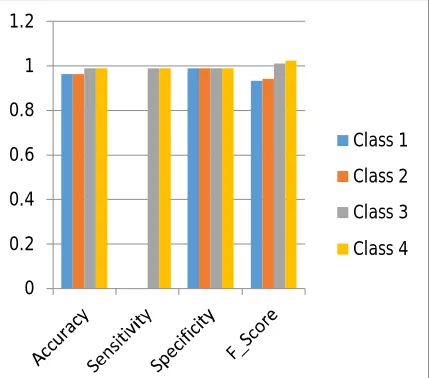
Table 1.1: Table of Particle Swarm Optimization
Parameters Class 1 Class 2 Class3 Class 4
Accuracy 0.9626 0.9626 0.99 0.99
Sensitivity 0 0 0.99 0.99
Specificity 0.99 0.99 0.99 0.99
[image:6.612.200.415.526.715.2]F-Score 0.9338 0.9427 1.0117 1.0233
Table 1.1 shows experiment of PSO algorithm on dataset of Quick bird images. It provides various values of performance metrics (accuracy, sensitivity, specificity and F-Score) of different four classes. The graph which we get during the experiment of PSO is shown in the figure given below:
Figure 1.1 Graph of Particle Swarm Optimization 0
0.2 0.4 0.6 0.8 1 1.2
Class 1
Class 2
Class 3
Table 1.2: Table of Hybrid Approach
Parameters Class 1 Class 2 Class 3 Class 4
Accuracy 0.98 0.99 0.99 0.98
Sensitivity 0.98 0.99 0.99 0.99
Specificity 0.99 0.98 0.99 0.98
F-Score 33.4852 38.4829 41.6898 82.3796
[image:7.612.186.426.89.161.2]Table 1.2 shows experiment of Hybrid approach (PSO+ACO) on dataset of Quick bird images. It provides various values of performance metrics (accuracy, sensitivity, specificity and F-Score) of different four classes. The graph which we get during the experiment of Hybrid approach is shown in the figure given below:
[image:7.612.198.416.213.393.2]Figure 1.2 Graph of Hybrid Approach
Table 1.3 Average Result of Particle Swarm Optimization
Parameters PSO
Accuracy 0.9763
Sensitivity 0.495
Specificity 0.99
F-Score 0.9778
Table 1.3 shows experiment of average result of PSO algorithm on dataset of Quick bird images. It provides various values of performance metrics (accuracy, sensitivity, specificity and F-Score) of different four classes. The graph which we get during the experiment of Average Result of PSO is shown in the figure given below:
Figure 1.3 Graph for Average Result of Particle Swarm Optimization 0
10 20 30 40 50 60 70 80 90
Class 1
Class 2
Class 3
Class 4
0 0.5 1
1.5
PSO
[image:7.612.185.426.423.545.2] [image:7.612.199.418.597.712.2]Table 1.4: Table Average Result of Hybrid Approach
Accuracy 0.985
Sensitivity 0.9875
Specificity 0.9875
F-Score 49.0083
[image:8.612.200.415.205.329.2]Table 1.4 shows experiment of average result of hybrid approach (PSO+ACO) on dataset of Quick bird images. It provides various values of performance metrics (accuracy, sensitivity, specificity and F-Score) of different four classes. The graph which we get during the experiment of the hybrid approach is shown in the figure given below:
Figure 1.4 Graph of Hybrid Approach
V. CONCLUSION
The Success of an image classification relies upon many elements. Image processing on satellite imagery is an important challenge. In this area, the identification of satellite image is an important task. In this paper we have emphasized on the evaluation of Natural computing techniques i.e. Particle Swarm Optimization (PSO) and Hybrid approach of Particle Swarm Optimization and Ant Colony Optimization (PSO +ACO) on satellite images. The objective was to evaluate optimization algorithms on satellite images. For the purpose of the experiment, a quick bird dataset consisting of five categories (Ujong, Yala, Sundarbans, Kokilai-Lagoon and Chilka-Lake) of various satellite images was used. The results of the experiment were evaluated using, Accuracy, sensitivity, specificity and F-score. The analysis on the basis of PSO and Hybrid approach of (PSO and ACO) with an accuracy 97.62% and 98.5% respectively. From the analysis of the research, it can be inferred that the hybrid approach (PSO and ACO) with CNN is more effective.
REFERENCES
[1] Sunitha Abburu and Suresh Babu Golla. "Satellite image classification methods and techniques: A review." International journal of computer applications, vol. 119, no. 8, pp. 0975-8887, June 2015.
[2] Graeme G. Wilkinson, "Results and implications of a study of fifteen years of satellite image classification experiments." IEEE Transactions on Geoscience and remote sensing, vol.43, no.3, pp. 433-440, March 2015.
[3] Kan Xu, Wen Yang, Gang Liu and Hong Sun, "Unsupervised satellite image classification using Markov field topic model." IEEE Geoscience and Remote Sensing Letters, vol. 10, no.1, pp. 130-134, Jan 2013.
[4] Solberg, Anne H. Schistad, Torfinn Taxt, and Anil K. Jain. "A Markov random field model for classification of multisource satellite imagery." IEEE transactions on geoscience and remote sensing 34.1 (1996): 100-113.
[5] Gigandet, Xavier, et al. "Region-based satellite image classification: method and validation." Image Processing, 2005. ICIP 2005. IEEE International Conference on. Vol. 3. IEEE, 2005
[6] Navdeep Kaur Johal, Samandeep Singh and Harish Kundra. "A hybrid FPAB/BBO algorithm for satellite image classification." International Journal of Computer Applications, vol.6, no.5, pp.0975–8887, sept 2010.
[7] Vailaya, A., Figueiredo, M. A., Jain, A. K., & Zhang, H. J. (2001). Image classification for content-based indexing. IEEE transactions on image processing, 10(1), 117-130.
[8] Aykut Akgün, A. Hüsnü Eronat, and Necdet Türk. "Comparing Different Satellite Image Classification Methods: An Application In Ayvalik District, Western Turkey." The 4th International Congress for Photogrammetry and Remote Sensing, Istanbul, Turkey. 2004.
[9] Banerjee, Biplab, et al. "A new self-training-based unsupervised satellite image classification technique using cluster ensemble strategy." IEEE Geoscience and Remote Sensing Letters 12.4 (2015): 741-745.
[10] Tuia, Devis, et al. "Active learning methods for remote sensing image classification." IEEE Transactions on Geoscience and Remote Sensing 47.7 (2009): 2218-2232.
[11] Romero, Adriana, Carlo Gatta, and Gustau Camps-Valls. "Unsupervised deep feature extraction for remote sensing image classification." IEEE Transactions on Geoscience and Remote Sensing 54.3 (2016): 1349-1362.
0 20 40 60
Accuracy Sensitivity Specificity F_Score