Abstract—The mortality rates in the UK has changed over time. The prevalence of Ischaemic Heart Disease (IHD) and stroke in the UK has been decreasing which has contributed to the changes between 1981 and 2000. The major risk factors associated with IHD and stroke, in addition to age, sex and smoking, are body mass index, diabetes, hypertension and hypercholesterolaemia. The objectives of this study is to investigate the effect of changes in the risk factors and quantify the extent of these changes. The results showed that smoking and hypertension has the highest effect on IHD, stroke and mortality for males and females. Lower rates of hypertension would reduce the prevalence of IHD and stroke as it has a direct effect on IHD, stroke and mortality. Changes in the risk factors would increase or decrease the number of IHD, stroke and deaths. Deaths from these factors could be reduced if the smoking ban policy and promotion towards no smoking are done widely and reducing the level of hypertension by living a healthy lifestyle.
Index Terms— Ischaemic Heart Disease, Prevalence, Risk factors, Stroke
I. INTRODUCTION
HE mortality rates in the UK changed in the 20th century. The mortality from cancer, heart disease and stroke has fallen very steadily [21]. IHD is the leading cause of death worldwide, followed by stroke [12]. The major risk factors associated with IHD and stroke, in addition to age, sex and smoking, are body mass index (BMI), diabetes, hypertension and hypercholesterolaemia. Tables I and II show the observed prevalence rates in 1981 and 2000 for males and females, respectively, taken from Health Survey for England [8]. Prevalence rate is defined as the total number of cases of a disease existing in a population divided by the total population. Shown in the tables are the prevalence of IHD and stroke for males and females in England and Wales in 1981 and 2000. The observed prevalence rates for some age groups have shown some
Manuscript received July 18, 2016; revised July 27, 2016. This work was supported in part by the Ministry of Higher Education under Grant RAGS-FST-50115-55 (sponsor and financial support acknowledgment goes here).
Yusoff, Y. S is with the Jabatan Sains Aktuari dan Pengurusan Risiko, Faculty Sains dan Teknologi, Universiti Sains Islam Malaysia, 71800Nilai, Negeri Sembilan, Malaysia (corresponding author to provide phone: 606-798-6430; e-mail: suhaylah@ usim.edu.my).
Streftaris, G. is with School of Mathematical and Computer Sciences, Heriot-Watt University, EH14 4AS Edinburgh, Scotland (e-mail: [email protected]).
Waters, H. R. was with the School of Mathematical and Computer Sciences, Heriot-Watt University, EH14 4AS Edinburgh, Scotland (e-mail: [email protected]).
improvements and for some age groups have shown an increase in the IHD observed prevalence rates from 1981 and 2000. The prevalence of IHD and stroke has not changed much for females whereas the prevalence of IHD and stroke has generally increased for males, particularly for the 75-84 age group.
II. THE RISK FACTORS
Despite the improvement in some of the risk factors, the levels of obesity and diabetes are experiencing an adverse trend. It was reported that in 2007, almost a quarter of adults were classified as obese [14]. There has been an overall increase in the prevalence of obesity since 1993. González et al. [5] reported the rise in new cases of diabetes: "The rates of diabetes are increasing at a faster rate in the UK than they are in North America, where prevalence of the condition is one of the highest in the world".
The observed prevalence rates for diabetes have been increasing for most of the age groups from 1981 to 2000 and the observed prevalence rates are shown in Tables 1 and 2 for males and females, respectively.
From the same tables, we see that the observed prevalence rates for hypertension (systolic blood pressure > 140 and diastolic blood pressure > 80) have decreased from 1981 to 2000 for most of the age groups for males and females. There are positive changes compared to diabetes and obesity that experienced an adverse trend. The observed prevalence rates for hypercholesterolaemia (total cholesterol > 200) are shown in Tables I and II for males and females, respectively, in 1981 and 2000. The observed prevalence rates for hypercholesterolaemia have shown some reduction from 1981 to 2000. These changes in risk factors will have an impact on the prevalence of IHD, stroke and on mortality rates. After being attacked with IHD and stroke, the crude risk of death was greatest in the first year of stroke and particularly in the first 30 days from onset [7]. So it is a significant factor to be looked into. Sudden death is defined as death from any cause within one month following myocardial infarction or stroke.
III. THE MULTIPLE STATE MODEL
One approach to the study of multiple state models is using the transition intensities (TI) [20]. By using the transition intensities, the natural setting for the multiple state models can be kept. As we are using stochastic modelling, any estimates of TIs derived from data will be subjected to random sampling variation. There will be a mean and
Probabilistic Models for Heart Disease and
Related Conditions
Y. S. Yusoff., G Streftaris, H. R. Waters
TABLEI
PREVALENCE RATES FOR MALES IN 1981
1981 2000 1981 2000 1981 2000 1981 2000 1981 2000 1981 2000
25-34 0.41 0.25 0.21 0.05 6.20 20.30 0.00 0.54 23.84 18.07 63.22 53.50
35-44 0.39 0.56 0.00 0.29 9.58 21.30 1.00 2.08 27.68 22.40 89.37 78.60
45-54 2.35 3.28 0.00 0.76 9.53 25.00 2.00 3.18 44.50 34.87 98.84 82.65
55-64 9.98 10.46 2.79 2.95 10.38 25.80 1.14 6.72 58.33 48.00 99.10 83.10
65-74 21.22 20.90 5.85 6.82 8.22 24.47 0.29 8.96 66.42 60.83 99.70 85.35
75-84 16.31 25.55 3.73 10.85 1.43 17.09 2.14 9.22 66.33 67.15 99.90 86.48
Age group
IHD Stroke Obesity Diabetes Hypertension Hypercholesterolaemia
TABLEII
PREVALENCE RATES FOR FEMALES IN 1981
1981 2000 1981 2000 1981 2000 1981 2000 1981 2000 1981 2000
25-34 0.10 0.12 0.10 0.16 7.74 15.73 0.00 0.78 7.52 6.70 61.14 55.09
35-44 0.30 0.31 0.40 0.34 9.04 19.15 1.43 1.14 14.70 10.87 70.10 69.66
45-54 1.30 1.82 0.90 0.74 13.43 24.21 1.00 2.00 32.07 24.32 83.91 81.41
55-64 3.50 4.69 2.30 2.03 16.09 29.27 0.50 3.74 51.05 42.83 96.93 91.63
65-74 10.00 10.26 4.20 3.87 18.66 30.09 1.71 7.32 65.72 58.80 97.26 92.77
75-84 19.30 17.60 10.70 9.11 16.31 23.31 0.80 7.52 71.37 69.01 98.80 96.01
Hypercholesterolaemia Age
group
IHD Stroke Obesity Diabetes Hypertension
[image:2.595.55.512.63.250.2]variance matrix. Using the mean and variance matrix, multiple sets of parameters can be generated and we can use these to assess the impact of uncertainty by sampling the parameter space a number of times. These estimates will have a multivariate normal distribution. The TI approach can help to ascertain the variance of the estimator which can be used in situations if we want to smooth the parameter estimates while other approaches may not cope with this problem easily.
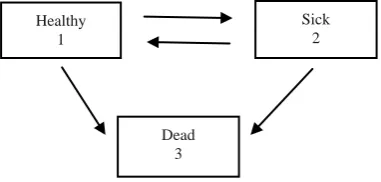
Fig. 1. The basic structure of a 3-state model
The TI approach is explained using the example in Fig. 1 [20]. Transfer is possible between states 1 and 2. State 3 is an absorbing state where transfer from this state is not possible at all. This is a time continuous Markov chain with a finite state space. The conditional probabilities are defined as follows: is the probability that the individual is in state at age given that the individual was in state at age . The individual's state in the future depends only on the state at the present time and not on the previous history of the individual. The transition intensities are then defined and from this, we can derive the probabilities for this model. Differential equations are derived and solved to calculate the transition probabilities.
A model is constructed for the development of IHD or stroke that either incorporates or includes pathways through the major risk factors of interest when underwriting for critical illness insurance [10]. The model is useful in assessing the impact on insurance underwriting of genetic information relevant to IHD and/or stroke. It is a multiple state model with three absorbing states, which are IHD, stroke and dead. T he remaining states are all transient. It
[image:2.595.71.262.399.490.2]has different combinations of the three risk factors, which are hypertension, hypercholesterolemia and diabetes. Sex, BMI and smoking are also taken as risk factors but are treated as static risk factors. The model was parameterized using data from the Framingham Heart Study, Original Cohort data set, and the model does not allow for any backward transitions between categories of the risk factors [10]. The method for estimating the transition intensities uses occurrence/exposure rates with an assumed Poisson distribution for the number of occurrences and a generalized linear model (GLM) with a log link to smooth the estimates. The intensities of moving between categories are calculated for diabetes, hypertension and hypercholesterolemia and are applied to those still alive who have not yet had an IHD event or a stroke.
Chatterjee et al. [3] further developed this model but did not focus on a specific insurance product. This model uses the same data as Macdonald et al. [10] but also includes the Framingham Offspring and Spouses data set to determine the structure of the model. Parameters for the transition intensities determined from the Framingham data were then adjusted by hand so that the model produces prevalence rates consistent with the UK observed rates in 2003. Risk factors relevant to heart disease and stroke are incorporated in the model. It is different from the model developed by Macdonald et al. [3] since it includes BMI and allows backward transitions. Using this model, which we refer to as the Heriot-Watt Model (HW model), we can describe an individual's life history by having certain categories of risk factors and the effects of the risk factors moving from one level to another in the long term and we can compute the risk of having IHD and/or a stroke or death.
The IMPACT Model [19] attempts to explain the decline in IHD deaths between 1981 and 2000 in England and Wales. In particular, IMPACT examines how much of the decrease in the number of deaths in England and Wales between 1981 and 2000 could be attributed to medical and surgical treatments and how much to changes in cardiovascular risk factors. The mortality fall from the changes in risk factors is called the number of deaths prevented or postponed (DPPs). The model is validated by comparing the estimated and observed mortality decreases Healthy
1
Dead 3
for men and women in each age group. The original IMPACT model is the Scotland IMPACT Model [1] which explains the decline in IHD deaths in Scotland between 1974 and 1994. Further development was achieved by adding new risk factors and new treatments in the English IMPACT Model.
This paper will explore by how much of the changes in the prevalence of IHD/stroke is due to changes in each of the risk factors between 1981 and 2000 and how much of the reduction in mortality is due to changes in each of the risk factors between 1981 and 2000. We have chosen 1981-2000 as the period over which we will investigate changes as this is the period covered by the IMPACT model. We will focus on ages 45 to 84 last birthday. There are relatively few deaths and cases of IHD and stroke below age 45 and the upper age limit, 84.
IV. DATA
We will need data to build the initial risk profiles in 1961 and 1981. If these rates are not available, we will interpolate or extrapolate using available data. We also need information on the population of England and Wales and smoking rates for males and females for all age group.
For the initial risk profiles and observed prevalence rates, data will be taken from:
i.The National Heights and Weights Survey 1980 [9] for the prevalence of BMI.
ii.The Health and Lifestyle Survey 1984-1985 [6] for the prevalence of BMI, diabetes and hypertension. iii.Data from the Health Survey for England [8] show for
each sex and in, mostly, 10--year age groups, the proportion of the population of England and Wales in 1994, 1998, 2003 and 2006 with diabetes, in each of 5 categories of BMI, in each of 4 categories of hypertension, in each of 2 categories of hypercholesterolaemia and in each of 4 categories of `significant event' (`Event free', MI, HS or MI+HS).
For the population of England and Wales, data will be taken from the Office for National Statistics (ONS). Whereas data for the smoking rates will be taken from the ONS [13] which give the percentages of the population of England and Wales in 1981 who were current smokers, ex-smokers, or had never smoked.
To model the probability of sudden deaths following myocardial infarction or stroke, we will use these data:
i.Data from the Framingham Heart Study for the original cohort (OC) which started in 1948 for Exam 1 to Exam 20 in 1986.
ii.Data from the Framingham Heart Study for the offspring and spouses cohort (OS) which started in 1971 for Exam 1 with further examinations average 6 years apart. We have the data up to Exam 6 which was done around 1997.
Finally, we will need data from the ONS that show the mortality rates in 1981 and 2000 from ELT14 [14] and ELT16 [15] for each sex and age.
V. METHODOLOGY
To produce results, the HW model requires an initial risk profile at the starting age to specify the distribution over the states in the model as mentioned in Chatterjee et al. [3]. The initial profile is a distribution over the states of the model at the initial age. This model uses the observed prevalence rates from Sproston and Primatesta [18] which are the HSE2003 observed prevalence rates for all risk factors except hypercholesterolaemia as the initial risk profile. For hypercholesterolaemia, the observed prevalence rates are taken from HSE1994 [15].
The model is parameterised separately for males and females and the parameterisations depend on the (deterministic) smoking pattern throughout the individual's lifetime.
The model is a continuous time model, with time represented by the individual's age. Transitions between the states are governed by transition intensities, with the exception of sudden deaths from IHD or stroke, which are assumed to act immediately upon the occurrence of IHD or stroke and so are governed by probabilities. The transition intensities and probabilities of sudden death are functions of the individual's age, sex, smoking pattern and of their current state, in terms of risk factors and significant events; they are not functions of calendar time.
By placing the individual in a given starting state, i.e. combination of levels for the risk factors and significant events, at a given initial age, the model can be run forward to any later age, giving probabilities of being in any of the states. However, we will use the model to determine probabilities/prevalence rates for populations rather than individuals. We will do this by choosing a given starting age, sex, smoking pattern and initial profile. The initial profile is a probability distribution over the states of the model and represents, for a given point in time, the proportion of the population in each of these states. Running the model forward we obtain for any later age/calendar time the prevalence of, for example, diabetes or IHD, and also the proportion of the population still alive.
We will use two different parameterisations of the HW model:
i.a parameterisation which is consistent with observed prevalence rates in 1981 for the risk factors and significant events, and,
ii.a parameterisation which is consistent with observed prevalence rates in 2000 for the risk factors and significant events.
By changing the transition intensities for a given risk factor, or combination of risk factors, in the "2000 consistent" parameterisation to those from the "1981 consistent" parameterisation, we can quantify the effect on, say, the prevalence of IHD or the probability of death from 1981 to 2000 of the change in the risk factor(s).
parameterisation so that the model produced prevalence rates consistent with England and Wales in 2003. Our approach will be to start with Chatterjee et al. 's (2008a) parameterisation and to adjust it manually to fit observed prevalence rates in England and Wales in 1981, and then separately in 2000. We will make use of some other data sources, particularly for estimating the probability of sudden death following the onset of IHD or stroke.
To produce either of these two separate parameterisations we need to calculate the prevalence rates produced by the HW model, and to do this we need to run it with an initial profile. Suppose, for example, we want an initial profile in 2000 for males aged 45 with a given smoking profile. The initial profile is the proportion of this part of the population in each of the states of our model. We can easily find data sources giving, for example, the proportion of the population in each of the categories of hypertension and, separately, the proportion in each of the categories of obesity. However, these are marginal distributions; what we need is the complete multivariate distribution. i.e. the proportion of the population in each combination of the categories of hypertension and obesity, and the other risk factors. To achieve this we consider the marginal distributions for each risk factor and significant event for males aged 26 in 1981, with the given smoking profile.
We then assume for simplicity that the distribution over each risk factor and significant event is independent of the other risk factors and significant events and run the model forward for 19 years. Running the model forward for 19 years gives prevalence rates in 2000 at age 45 which are not unduly influenced by the simplifying assumption at age 26. The parameters of the model can then be adjusted to achieve the required prevalence rates. The same procedure was used to produce the "1981 consistent" parameterisation using marginal distributions from 1961 and running the model forward for 20 years.
The HW model involves the Kolmogorov forward differential equations in order to calculate the occupancy probabilities between states after the parameters are known and the initial risk profile is included in the model. The numerical solution to these Kolmogorov forward differential approximations is found by using the Runge-Kutta method of order 4.
VI. RESULTS AND DISCUSSION
The effect of changes has been done by changing the factor one by one. For smoking, if the rates does not decrease over time, there will be higher number of deaths in 2000 for males and females by 11.85% and 6.46%, respectively. There is also an increase in the prevalence of IHD and stroke by up to 8.7%.
If the obesity level of BMI decrease, the number of deaths would increase by 7.17% for males and 1.51% for females in 2000 as BMI has a direct U-shaped effect on mortality [3]. This means that a lower BMI level has higher mortality rates than a higher BMI level. Reduction in higher level of BMI would lower the prevalence of IHD and stroke as lower rates of obesity will reduce the rates of diabetes and hypertension [3].
Diabetes has a direct effect on IHD and mortality, but not
on stroke [3]. Hence, lower prevalence of diabetes will tend to reduce the prevalence of IHD and reduce the number of deaths. If the prevalence of diabetes has not change over time, there will be lower level of mortality by 2.13% and 1.51% for males and females, respectively, as the rates of diabetes are increasing over time, as mentioned above.
Hypertension has a direct effect on IHD, stroke and mortality [3]. Increase level of hypertension would tend to increase the prevalence of IHD, stroke and the number of deaths. The model shows that increased in the prevalence of hypertension in 2000 would increase the rate of IHD by 6.06% and 5.01% for males and females, respectively. It also increase the rate of stroke by 13%. These increments would lead to an increase in the number of deaths by 7.26% for males and 5.97% for females.
Hypercholesterolaemia has a direct effect on IHD but not on stroke [3]. It has a mixed effect on mortality [3]. From this model, a higher level of hypercholesterolaemia would increase the IHD cases by 0.13% for males and 2.63% for females. It would also increase the rates of stroke by 0.28%. The effect on mortality is different between males and females. Increase in hypercholesterolaemia will lower the mortality for males by 0.8% whereas for females, there is an increase by 1.18%.
Results from the model are applied to the population of England and Wales [13] and the expected number of deaths are shown in Table III.
TABLEIII
TOTAL EXPECTED NUMBER OF DEATHS IN 2000
We have calculated the effect of changes in the risk factors intensities on the number of IHD cases, stroke cases and mortality between 1981 and 2000. Among the risk factors, smoking contributes the highest difference in the total number of deaths for males and females if smoking rates in 1981 continue to persist in 2000. In the IMPACT model, changes in risk factors prevalence between 1981 and 2000 have caused 35,944 fewer total deaths from ages 45 to 84 where the biggest contribution comes from smoking. The reduction in smoking has reduced mortality by 48.1% from the total deaths.
In the HW model, there are lower diabetes rates when we use the 1981 diabetes intensities that will lower the total number of deaths for males and females. Therefore, higher diabetes rates in 2000 will increase the number of deaths. This is similar to the result from the IMPACT model where adverse trends in diabetes have increased the IHD deaths in the IMPACT model. An increasing trend can also be seen in the obesity rates where in the IMPACT model, there are additional deaths of 2097. In the HW model, higher obesity
Risk factor HW Model
IMPACT Model Male Female Total Total Smoking 20461 10277 30738 29715 Hypertension 12530 9497 22027 5868
rates will reduce the mortality rates as there will be lower lightweight rates. Lightweight has higher mortality rates than obese in the HW model so 1981 BMI intensities have higher number of deaths compared to 2000 model estimated rates.
An additional total of 101157 deaths for males would have occurred in 2000 if all the 1981 risk factors intensities including smoking had remained the same in 2000. For females, the number of deaths was reduced by 64,924 due to changes in the risk factors between 1981 and 2000.
In the IMPACT Model, a reduction of 34% in smoking between 1981 and 2000 has prevented 29715 deaths. From our model, if smoking rates in 1981 continue to persist in 2000, there will be 30738 more deaths. From Table III, an obvious difference in the expected deaths is from BMI. With IMPACT, there is a negative number of deaths prevented or postponed which means the negative changes in obesity have increased the number of deaths prevented or postponed by 2097. However in the HW Model, if 1981 BMI intensities continue to happen in 2000, there will be higher expected deaths, as despite the obesity rates in 1981 being lower, lightweight has higher mortality than obese in our model.
VII. CONCLUSION
The adjusted HW model can be used to calculate the effect of changes in the risk factors prevalence rates on IHD, stroke and mortality between 1981 and 2000. The major risk factors associated with these conditions are age, sex, smoking, BMI, diabetes, hypertension and hypercholesterolaemia.
Among these risk factors, smoking is found to be the highest contributor affecting the number of IHD, stroke and mortality. Almost 31,000 deaths for males and females will happen if the smoking rates in 1981 continued to happen in 2000. This shows that the reduction in smoking has saved these lives. It also suggests that the smoking ban and promotion towards no smoking has shown a successful effect. The age range that we have considered in our model has higher mortality rates for smokers with IHD that the prevalence of IHD has decreased in 2000 especially for males.
Adverse effect is shown in diabetes as there would be 6,085 fewer deaths for males and females if 1981 diabetes intensities continued to happen in 2000. More prevention strategies need to be implemented to control the diabetes prevalence rates to keep the prevalence rates from increasing over time. It is also important to lower the prevalence of diabetes as it has a direct effect on IHD and mortality.
Hypertension has a direct effect on IHD, stroke and mortality, whereas hypercholesterolaemia has a direct effect on IHD but not on stroke and a mixed effect on mortality (Chatterjee et al. , [3], Tables 9 and 10). Hence, increasing the levels of hypertension to 1981 levels will tend to increase the prevalence of IHD, stroke and number of deaths. 1981 hypercholesterolaemia levels increase the prevalence of IHD, particularly for females, but have little effect on the prevalence of stroke or the number of deaths. Increasing the IHD levels to 1981 levels have different
effects for males and females as the trends over time are different for both males and females and the numbers of deaths are affected by the adjustments for sudden deaths following MI and stroke that are included in the adjusted HW model.
ACKNOWLEDGMENT
Yusoff, Y. S thanks Universiti Sains Islam Malaysia, Heriot-Watt University and Ministry of Higher Education.
REFERENCES
[1] Capewell, S., Morrison, C. E. and McMurray, J. J., 1999. Contribution of modern cardiovascular treatment and risk factor changes to the decline in coronary heart disease mortality in Scotland between 1975 and 1994. Heart, 81: 380-386.
[2] Chatterjee, T., 2007. An individual life history model for heart disease`, stroke and death: structure, parameterisation and applications. Available:
http://www.ma.hw.\\ac.uk/~andrewc/actuarial/chatterjee\_thesis.pdf.
[3] Chatterjee, T., Macdonald, A.S. and Waters, H.R., 2008a. A model for ischaemic heart disease and stroke I: The model. Annals of Actuarial Science, 3(1 and 2): 45-82.
[4] Chatterjee, T., Macdonald, A.S. and Waters, H.R., 2008b. A model for ischaemic heart disease and stroke II: Modelling obesity. Annals of Actuarial Science, 3(1 and 2): 83-104.
[5] González, E. L. M., Johansson, S., Wallander, M-A. and Rodríguez, L. A. G., 2008. Trends in the prevalence and incidence of diabetes in the UK: 1996-2005. Journal of Epidemiology and Community Health, 63: 332-336.
[6] HALS84. UKDA. Health and lifestyle survey, 1984-1985. Available:
http://www.dataarchive.ac.uk/findingData/snDescription.asp?sn=2218 .
[7] Hardie, K., Jamrozik, K., Hankey, G. J., Broadhurst, R. J. and Anderson, C., 2005. Trends in five-year survival and risk of recurrent stroke after first-ever stroke in the Perth Community Stroke study.
Cerebrovascular Diseases, 19: 179-185.
[8] Health Survey for England, 2006. Adult trend tables 2006. Available:
http://www.ic.nhs.uk/\\webfiles/publications/HSE06/ADULT\%20TR END\%20TABLES\%202006.xls.
[9] HWS80. UKDA. National heights and weights survey, 1980. Available:
http://www.datarchive.ac.uk/findingData/snDescription.asp?sn=204.
[10] Macdonald, A.S., Waters, H.R. and Wekwete, C.T., 2005a. A model for coronary heart disease and stroke, with applications to critical illness insurance underwriting I: The model. North American Actuarial Journal, 9:1: 41-56.
[11] Macdonald, A.S., Waters, H.R. and Wekwete, C.T., 2005b. A model for coronary heart disease and stroke, with applications to critical illness insurance underwriting II: Applications. North American Actuarial Journal, 9:1: 13-40.
[12] Murray, C. J. L. and Lopez, A. D., 1997. Mortality by cause for eight regions of the world: Global Burden of Disease Study. The Lancet,
349: 1269-1276.
[13] Office for National Statistics (2004). Population Estimates for UK, England and Wales, Scotland and Northern Ireland - mid 1991 to mid 2000. Avalable:
http://www.ons.gov.uk/ons/rel/popestimate/population-estimates-for-uk–england-and-wales–scotland -and-northern-ireland/mid-1991-to-mid-2000-local-authority-populationstudies/mid-1991-to-mid-2000– local-authority-population-studies.zip.
[14] Office for National Statistics (2007). English life table no.15. Available: www.ons.gov.uk/ons/rel/lifetables/decennial-life-tables/english-life-tables-no–15/english-life-tables–no–15.pdf
[15] Office for National Statistics (2009). English life table no.16. Available: www.ons.gov.uk/ons/rel/lifetables/decennial-life-tables/no-16–2000-2002-/english-life-tables–no-16–2000-02-.xls
[16] Robinson, S. and Lader, D., 2007. General Household Survey: Smoking and drinking among adults, 2007. Available:
http://www.statistics.gov.uk/downloads/\\theme\_compendia/GHS07/ GHSSmokingandDrinkingAmongAdults2007.pdf.
[17] Statistics on Obesity, Physical Activity and Diet: England., 2009. Available:
http://www.ic.nhs.uk/webfiles/publications/opan09/OPAD\%20Feb\%
[18] Sproston, K. and Primatesta, P., 2004. Health Survey for England 2003, Vols. 1, 2 and 3. Available:
http://www.dh.gov.uk/prod\_consum\_dh/groups/dh\_digitalassets\\/ @dh/@en/documents/digitalasset/dh\_4098910.pdf.
[19] The IMPACT Model Apendices, 2007. Available:
http://www.liv.ac.uk/PublicHe\\alth/sc/bua/IMPACT\_Model\_\%20A ppendices\_May\_2007.pdf.
[20] Waters, H. R., 1984. An Approach to the study of multiple state models. J.I.A, 111: 363-374.