Estimation of forest development stage and crown
closure using different classification methods
and satellite images: A case study from Turkey
Sinan Bulut*, Alkan Günlü, Sedat Keleş
Department of Forest Engineering, Faculty of Forestry, Çankırı Karatekin University, Çankırı, Turkey *Corresponding author: [email protected]
Citation: Bulut S., Günlü A., Keleş S. (2019): Estimation of forest development stage and crown closure using different classi-fication methods and satellite images: A case study from Turkey. J. For. Sci., 65: 18–26.
Abstract: The objective of this study is to estimate stand development stages (SDS) and stand crown closures (SCC) of forest using different classification methods (maximum likelihood, support vector machine: linear, polynomial, radial and sigmoid kernel functions and artificial neural network) based on satellite imagery of different resolution (Landsat 7 ETM+ and IKONOS). The results showed that SDS and SCC were estimated with Landsat 7 ETM+ image using the artificial neural network with a 0.83 and 0.78 kappa statistic value, and 92.57 and 89.77% overall accuracy assessments, respectively. On the other hand, SDS and SCC were predicted with IKONOS image using support vec-tor machine (polynomial) method with a 0.94 and 0.88 kappa statistic value, and 95.95 and 91.17% overall accuracy assessments, respectively. Our results demonstrated that IKONOS satellite image and support vector machine (poly-nomial) method produced a better estimation of SDS and SCC as compared to Landsat 7 ETM+ and other supervised classification methods used in this study.
Keywords: supervised classification; stand attributes; support vector machine; artificial neural network; Landsat 7 ETM+; IKONOS
Forest ecosystems provide goods and services such as timber and non-timber products, soil pro-tection, water production, carbon sequestration, biodiversity conservation, recreation, and aesthet-ics. The quantity and quality of all these forest eco-system values are generally linked to forest ecosys-tem structure including forest stand type, stand age class, growing stock and increment, stand basal area, stand crown closures (SCC), stand develop-ment stages (SDS) and tree density. Determination of these forest ecosystem characteristics is named as forest inventory and is very important for sus-tainable management of forest resources. Espe-cially, SDS and SCC are essential to determine the stand types (Anonymous 2008). Also, each one of them is the major parameter for forest manage-ment plans (Sivrikaya et al. 2006; Kadıoğulları, Başkent 2008; Günlü 2012).
Forest inventory studies are based on field mea-surements and remote sensing methods. Field measurements are mostly expensive, cumbersome and time-consuming (Hyyppa et al. 2000). How-ever, remote sensing methods have been used to estimate and monitor forest stand parameters with reasonable accuracy levels in large areas. Remote sensing technologies have been successfully used in carrying out of forest inventories and have played a vital role in the estimation of forest stand parame-ters at a low cost and plausible effort with adequate accuracy (Lu et al. 2004). Data obtained by remote sensing can be modified easily and used for esti-mating and mapping spatial features of forest re-sources (Pilger et al. 2002).
parameters. For example, some studies to predict land use type has been accomplished using Landsat (Lu et al. 2004; Hall et al. 2006; Mohammadi et al. 2010), ASTER (Gebreslasie et al. 2010), IKO-NOS (Kayitakire et al. 2006; Peuhkurinen et al. 2008), Rapideye (Ustuner et al. 2015). Also dif-ferent image classification methods such as maxi-mum likelihood (Srivastava et al. 2012; Taati et al. 2015; Topaloğlu et al. 2016), artificial neural network (Srivastava et al. 2012; Hazini, Hashim 2015; Were et al. 2015) and support vector ma-chine (Kavzoglu, Colkesen 2009; Srivastava et al. 2012; Hazini, Hashim 2015; Taati et al. 2015; Ustuner et al. 2015; Were et al. 2015; Topaloğlu et al. 2016) have been used. However, almost all of the studies seek to estimate or monitor land use and land cover including forest ecosystem (Kavzoglu, Colkesen 2009; Srivastava et al. 2012; Hazini, Hashim 2015; Taati et al. 2015; Ustuner et al. 2015; Topaloğlu et al. 2016; Tolessa et al. 2017). In this context, studies focused on estimating forest stand parameters such as SDS and SCC of forests are needed.
The objective of this study is: (i) to determine maps of SCC and SDS, (ii) to compare image clas-sification algorithms, (iii) to compare the perfor-mance of satellite images with different spatial res-olution. The hypothesis of this research is that high resolution remotely sensed data (IKONOS) would be able to achieve high success with advanced clas-sification algorithms (support vector machines
and artificial neural networks) for estimating some stand parameters (SDS and SCC).
MATERIAL AND METHODS
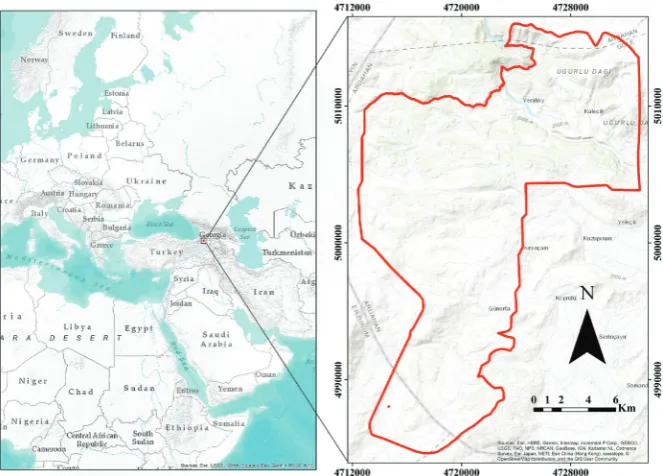
Study area. This study was conducted in Uğurlu Forest Planning Unit, northeastern corner of Tur-key (Fig. 1). It is bounded by 42°19'56''E–42°31'02''E and 40°48'40''N–41°01'27''N (ED 1950, UTM zone 38N). The study area is 19,261.6 and 7,573 ha (39.3%) of it is covered by trees that include Scots pine (Pinus sylvestris Linnaeus) and Poplar ( Popu-lus tremula Linnaeus). The elevation varies be-tween 2,048 and 2,785 m with an average slope of 22% (Anonymous 2007).
Data sampling. In this study, 639 temporary sample plots were established systematically with 300 × 300 m intervals in 2005 and DBH, age and height were taken in each sample plot. The coordi-nates of each sample area were determined by us-ing global positionus-ing system device Garmin eTrex (Garmin, Taiwan). The sizes of the sample plot ranged from 400 to 800 m2, depending on SCC. The
SCC was classified for each sample plot, according to divided four SCC classes such as degraded forest (0–10% closure, no sampling), low coverage (11 to 40%), medium coverage (41–70%) and full coverage (71–100%). DBH was measured in all trees with a diameter bigger than 7.9 cm at breast height. Then, SDS were determined according to measured
[image:2.595.64.396.519.757.2]eter values, and the categories are: These are regen-eration (mean stand diameter < 8 cm), immature (mean stand diameter 8–19.9 cm), mature (mean stand diameter 20–35.9 cm) and over mature (mean stand diameter > 36 cm) (Anonymous 2008). As a result of this process, a ground data map containing tree species, SDS and SCC was obtained.
Satellite images and processing. A Landsat 7 ETM+ scene from 18th of August, 2005 and an
IKONOS product from on the 13th of August, 2005 were obtained from the United States Geological Survey Earth Explorer data portal (https://earthex-plorer.usgs.gov/, consulted July 5, 2016) and from the General Directorate of Forestry, respectively. Landsat 7 ETM+ satellite image has 30 m spatial resolution and six spectral bands such as visible (ETM 1, ETM, 2, ETM 3), NIR (ETM 4) and MIR (ETM 5 and ETM 7). The IKONOS has four bands red, green and blue with a spatial resolution of 4 m and near infrared with a spatial resolution of 1 m. The pan-sharpened IKONOS satellite image with 1 m resolution was used in this study. The satel-lite images were orthorectified and georeferenced to UTM Zone 38 projection based on the European Datum 50 using first-order nearest neighborhood rules. Accuracy was checked with 1:25,000 scaled topographical maps and GPS data obtained from the field, both of which proved the accuracy of the rectification. A total of 20 ground points were used to register the Landsat 7 ETM+ and IKONOS images with a rectification error less than 1 pixel image. Atmospheric corrections of these images were also made. Data processing, interpreting, and analysis were performed using ERDAS IMAGINE software (ERDAS LLC 2002).
Image classification. We used Landsat 7 ETM+ and IKONOS satellite images for supervised
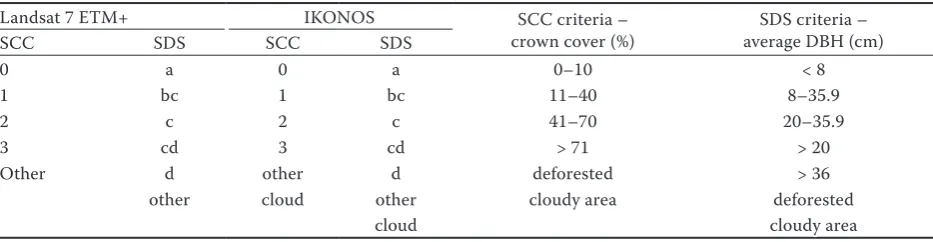
clas-sification. In addition, we utilized to 5, 4, 3 bands combination for Landsat 7 ETM+, and 4, 3, 2 bands combination for IKONOS in image classification. Since the wavelengths of the infrared boots are longer, it is easier to differentiate the plant species during image classification. In addition, it allows identification of plant species in the shade. As a re-sult, classification success increases (Günlü et al. 2008). Ground reference data was collected as sig-natures for satellite images and the training points were equally scattered to each SCC and SDS classes with 10 points per class. The signatures were taken from forest cover type map of 2005. SCC (0, 1, 2, 3 and other areas) and SDS (a, bc, c, cd, d, and other areas) classes were classified. Since the IKONOS satellite image used in the study has cloudy areas, the cloud class has been added for the IKONOS satellite image (Table 1).
Maximum likelihood classifier – MLC (Sivri- kaya et al. 2006; Günlü et al. 2008), support vec-tor machine (SVM) including linear, polynomial, radial and sigmoid kernel functions (Srivastava et al. 2012; Taatı et al. 2015) and artificial neural net-work – ANN (Bakırman 2014; Hazini, Hashim 2015) classification algorithms were employed as classifier for supervised classification analyses with ENVI software (Version 5.2, 2014). The MLC meth-od was more advantageous in terms of ease of use. The SVM and ANN methods were more complex and so classification processes should be repeated to obtain the most accurate results. Optimal clas-sification parameters of SVM kernel functions and ANN methods were found by checking kappa sta-tistic and overall accuracy at last step of each clas-sification processes, and that was performed in ten times. In the comparison of the success levels of the methods (MLC, SVM, and ANN), kappa sta-Table 1. Classes of stand crown closures (SCC) and stand development stages (SDS) for satellite images
Landsat 7 ETM+ IKONOS SCC criteria –
crown cover (%) average DBH (cm)SDS criteria –
SCC SDS SCC SDS
0 a 0 a 0–10 < 8
1 bc 1 bc 11–40 8–35.9
2 c 2 c 41–70 20–35.9
3 cd 3 cd > 71 > 20
Other d other d deforested > 36
other cloud other cloudy area deforested
cloud cloudy area
[image:3.595.64.531.112.233.2]tistics and overall accuracy values were taken into consideration (Fig. 2).
Classification parameters for support vector machine and artificial neural network. Classi-fication parameters for SVM were degree (1–6), bias (0–7), gamma (> 0.01) and penalty parameter (0–1,000). The degree was used in the polynomial function and it specified to the degree of the poly-nomial kernel function. Bias was used for polyno-mial and sigmoid kernel functions. Gamma in ker-nel functions was used in the polynomial, radial, and sigmoid functions. Penalty parameter specified the degree of misclassification and especially im-portant for non-separable training sets. It was used all kernel functions of SVM. Parameters in ANN were threshold (0–1), rate (0–1), momentum (0–1) and iteration (> 0). Threshold was used to adjust the changes to internal weights. Rate was used to determine the size of weight adjustment. Momen-tum was encouraged weight changes along the cur-rent direction. Iteration specified the number of training repetition (Wu et al. 2004; Chang, Lin 2011; Hsu et al. 2016).
RESULTS
In this study, different satellite image and image classification algorithms were used in predicting
SDS and SCC. Optimal parameters for SVM clas-sifiers such as degree, bias, gamma, and penalty pa-rameter and for ANN classifiers such as threshold, rate, momentum, and iteration were obtained by trying to classification. The most appropriate val-ues obtained from these parameters were present-ed for SVM and ANN methods in Table 2.
[image:4.595.71.284.94.348.2] [image:4.595.305.532.113.255.2]The best accuracy values acquired from all meth-ods were given in Table 3. According to the overall accuracy and kappa coefficient, the most accurate Fig. 2. Flow diagram of the image classification
Table 2. Optimal parameters for the most accurate methods Value range SDS SCC
SVM polynomial using IKONOS
Degree 1–6 5 5
Bias 0–7 1 1
Gamma > 0.01 0.125 0.150
Penalty parameter 0–1,000 150 150
ANN using Landsat 7 ETM+
Threshold 0–1 0.9 0.2
Rate 0–1 0.2 0.2
Momentum 0–1 0.5 0.9
Iteration > 0 500 500
SVM – support vector machine, ANN – artificial neural network, SDS – stand development stages, SCC – stand crown closures
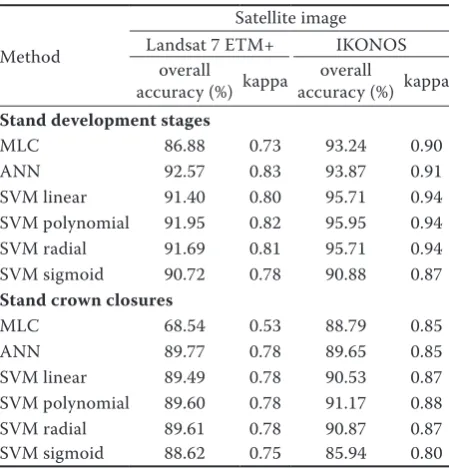
Table 3. Classification accuracies for MLC, SVM, and ANN
Method
Satellite image Landsat 7 ETM+ IKONOS
overall
accuracy (%) kappa accuracy (%) kappaoverall
Stand development stages
MLC 86.88 0.73 93.24 0.90
ANN 92.57 0.83 93.87 0.91
SVM linear 91.40 0.80 95.71 0.94 SVM polynomial 91.95 0.82 95.95 0.94 SVM radial 91.69 0.81 95.71 0.94 SVM sigmoid 90.72 0.78 90.88 0.87
Stand crown closures
MLC 68.54 0.53 88.79 0.85
ANN 89.77 0.78 89.65 0.85
[image:4.595.305.530.495.730.2]methods were selected and focused them. One of the selected methods is ANN classifiers with Land-sat 7 ETM+ Land-satellite image, and the other method is SVM polynomial function with IKONOS satel-lite image for SCC and SDS. Kappa coefficient was 0.83 with Landsat 7 ETM+ based on ANN and 0.94 with IKONOS based on SVM polynomial function
for SDS. Kappa coefficient was 0.78 with Landsat 7 ETM+ based on ANN and 0.88 with IKONOS based on SVM polynomial function for SCC (Table 3).
[image:5.595.70.527.93.312.2]Classification map from IKONOS satellite image had better classification pattern in terms of “a” and “c” SDS compare to Landsat 7 ETM+ (Fig. 3). De-graded areas could not be classified sufficiently for Fig. 3. Visual comparison of resulting maps for stand development stages by the most accurate methods: support vector machine polynomial for IKONOS (kappa = 0.94) (a), artificial neural network for Landsat 7 ETM+ (kappa = 0.83) (b), ground data maps (c)
a – regenerated, bc – young–mature, c – mature, cd – mature–overmature, d – overmature
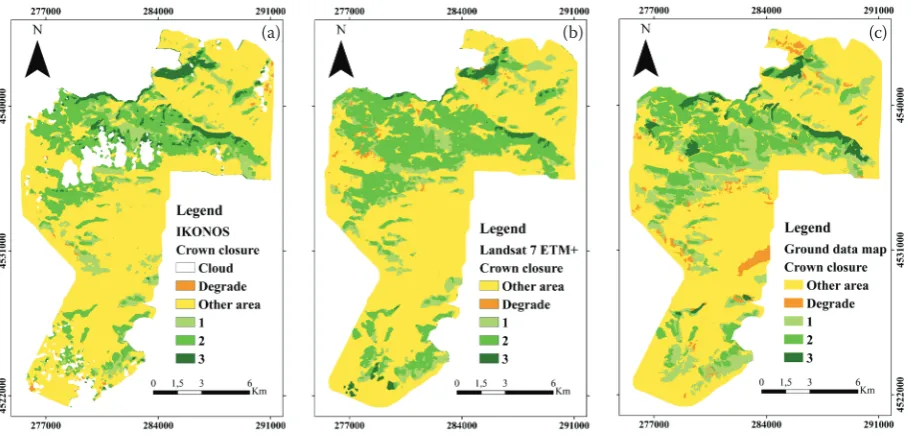
Fig. 4. Visual comparison of resulting maps for stand crown closures by the most accurate methods: support vector machine polynomial for IKONOS (kappa = 0.88) (a), artificial neural network for Landsat 7 ETM+ (kappa = 0.78) (b), ground data maps (c)
1 – low, 2 – medium, 3 – full
(a) (b) (c)
[image:5.595.72.528.380.598.2]both satellite images. However, IKONOS had bet-ter in bet-terms of “3” SCC classes (Fig. 4). Containing cloud on IKONOS satellite image was a disadvan-tage for interpreting classification map.
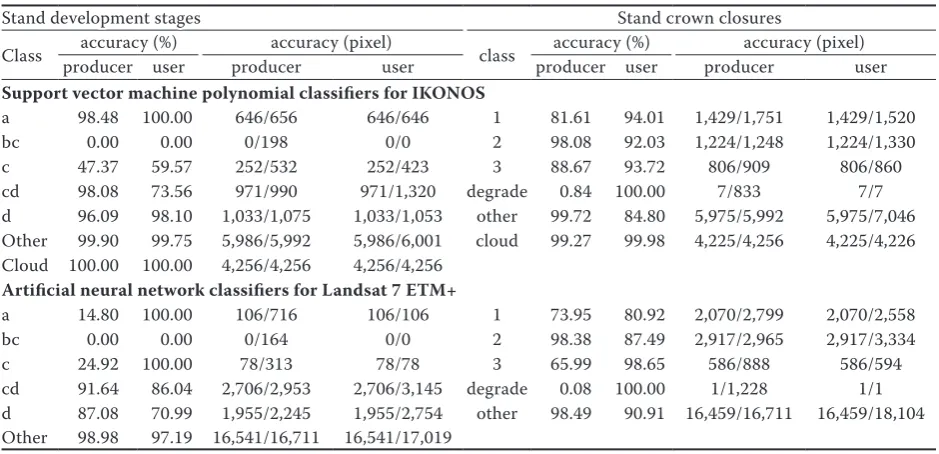
In addition, confusion matrixes based on pixel were generated for all image classifications and pre-sented for the most accurate classification methods
in Table 4. Satellite images and methods used in classifications were insufficient for classification of “bc” SDS with 26.84 ha (Table 4). “Degrade” SCC class was classified as “1” and “other areas” (Ta-ble 4). Accuracy assessments for the same methods were illustrated in Table 5. According to producer accuracy, “a” and “other” classes were the best
clas-Table 4. Confusion matrix for stand development stages and stand crown closures
Stand development stages Stand crown closures
Class a bc c ground truth (pixel)cd d other cloud total class 1 2 ground truth (pixel)3 degrade other cloud total
Support vector machine polynomial classifiers for IKONOS
a 646 646 1 1,429 74 17 1,520
bc 0 2 3 1,224 103 1,330
c 152 252 19 423 3 23 806 31 860
cd 46 273 971 30 1,320 degrade 7 7
d 10 4 1,033 6 1,053 other 319 752 5,975 7,046
Other 3 12 5,986 6,001 cloud 1 4,225 4,226
Cloud 4,256 4,256 total 1,751 1,248 909 833 5,992 4,256 14,989
Total 656 198 532 990 1,075 5,992 4,256 13,699
Artificial neural network classifiers for Landsat 7 ETM+
a 106 106 1 2,029 19 203 241 2,492
bc 0 2 158 2,942 305 1 3,406
c 78 78 3 2 583 585
cd 2 136 176 2,706 125 3,145 degrade 9 52 61
d 315 28 39 247 1,955 170 2,754 other 603 2 972 16,470 18,047
Other 293 20 165 16,541 17,019 total 2,799 2,965 888 1,228 16,711 24,591 Total 716 164 313 2,953 2,245 16,711 23,102
[image:6.595.71.531.220.471.2]a – regenerated, bc – young–mature, c – mature, cd – mature–overmature, d – overmature, 1 – low, 2 – medium, 3 – full
Table 5. Accuracy assessment for stand development stages and stand crown closures
Stand development stages Stand crown closures
Class producer useraccuracy (%) produceraccuracy (pixel)user class producer useraccuracy (%) produceraccuracy (pixel)user
Support vector machine polynomial classifiers for IKONOS
a 98.48 100.00 646/656 646/646 1 81.61 94.01 1,429/1,751 1,429/1,520
bc 0.00 0.00 0/198 0/0 2 98.08 92.03 1,224/1,248 1,224/1,330
c 47.37 59.57 252/532 252/423 3 88.67 93.72 806/909 806/860
cd 98.08 73.56 971/990 971/1,320 degrade 0.84 100.00 7/833 7/7 d 96.09 98.10 1,033/1,075 1,033/1,053 other 99.72 84.80 5,975/5,992 5,975/7,046 Other 99.90 99.75 5,986/5,992 5,986/6,001 cloud 99.27 99.98 4,225/4,256 4,225/4,226 Cloud 100.00 100.00 4,256/4,256 4,256/4,256
Artificial neural network classifiers for Landsat 7 ETM+
a 14.80 100.00 106/716 106/106 1 73.95 80.92 2,070/2,799 2,070/2,558
bc 0.00 0.00 0/164 0/0 2 98.38 87.49 2,917/2,965 2,917/3,334
c 24.92 100.00 78/313 78/78 3 65.99 98.65 586/888 586/594
cd 91.64 86.04 2,706/2,953 2,706/3,145 degrade 0.08 100.00 1/1,228 1/1 d 87.08 70.99 1,955/2,245 1,955/2,754 other 98.49 90.91 16,459/16,711 16,459/18,104 Other 98.98 97.19 16,541/16,711 16,541/17,019
[image:6.595.63.533.517.744.2]sified for SDS with IKONOS satellite image and, “a” and “c” classes were the best for user accuracy re-sults with Landsat 7 ETM+ satellite image (Table 5). In SCC classification, “2” and “other” classes were the best for producer accuracy results with IKO-NOS satellite image and, “3” and “degrade” classes were the best for user accuracy results with Landsat 7 ETM+ satellite image (Table 5).
DISCUSSION
Different satellite images (IKONOS and Land-sat 7 ETM+) and image classification algorithms (MLC, SVM, and ANN) were used for investigating the SCC and SDS. The best accuracy results showed that SDS and SCC were predicted with IKONOS image using SVM polynomial kernel function with a 0.94 and 0.88 kappa statistic values, and 95.95 and 91.17% overall accuracy assessments, respectively. The other results indicated that SDS and SCC were estimated with Landsat 7 ETM+ image using ANN with a 0.83 and 0.78 kappa statistic values, and 92.57 and 89.77% overall accuracy assessments, respectively.
There are many studies about satellite image clas-sification for stand parameters using MLC (Sivri-kaya et al. 2006; Başkent, Kadıoğulları 2007; Günlü et al. 2008; Kadıoğulları, Başkent 2008; Sivrikaya 2011; Günlü 2012). However, there are a few studies about different classification methods such as SVM and ANN to classify SDS and SCC in the literature (Bulut et al. 2017). Sivrikaya et al. (2006) classified land cover classes in Art-vin Forest Planning Unit with 82.1% accuracy and 0.79 kappa statistic. Başkent and Kadıoğulları (2007) classified land use and forest cover types in İnegöl Forest Enterprise which has typical al-luvial areas with a higher overall classification ac-curacy of 91.04% and 0.90 kappa statistics value. Regarding MLC classification method, Günlü et al. (2008) classified SDS, SCC and stand type using Landsat 7 ETM+ with 0.89, 0.86 and 0.76 kappa sta-tistic, respectively. Kadıoğulları and Başkent (2008) classified land use and forest cover types in Gümüşhane Forest Enterprise which has a typi-cal mountain area, with an accuracy of 86.58% and 0.8452 kappa statistic. Sivrikaya (2011) used Landsat 7 ETM+ and classified SDS, SCC and for-est cover type. Kappa statistics were obtained 0.90, 0.92 and 0.67 for SDS, SCC and forest cover type,
respectively. Günlü (2012) found that 0.83, 0.88 and 0.92 kappa statistics for SDS, SCC and land use classification using Landsat TM.
When the literature was examined, there were also many studies about different classification methods. Srivastava et al. (2012) examined the land use clas-sification generated from Landsat TM satellite im-age using MLC, SVM linear, SVM polynomial, SVM radial, SVM sigmoid, and ANN methods and they found that the kappa statistic values were 0.7171, 0.7496, 0.7488, 0.7493, 0.7482 and 0.7499, respec-tively. Bakırman (2014) reported that the accura-cy of land use classifications were 91.06, 92.34 and 90.64% for MLC, SVM linear and ANN methods, respectively. In another study, Taati et al. (2015) classified land use classes using Landsat 5 TM with MLC and SVM classification methods, and kappa statistic values were found 0.72 and 0.82, respective-ly. Hazini and Hashim (2015) classified land use using SVM and ANN methods with an ASTER satel-lite image and found 0.94 of kappa value of SVM and 0.82 of kappa value of ANN. Kulkarni and Lowe (2016) found that kappa statistics of land use clas-sification were 0.90, 0.99 and 0.98 using Landsat 8 with MLC, SVM and ANN classification methods, respectively. Bulut and Günlü (2016) used MLC and SVM linear, polynomial, radial, sigmoid kernel functions and classified land use with Landsat 8. Kappa statistics obtained with these methods were 0.81, 0.77, 0.79, 0.75 and 0.63, respectively. Bulut et al. (2017) used Landsat TM satellite image with MLC and SVM kernel functions for classification of SCC. Kappa statistics were 0.60 for MLC and 0.68 for SVM radial and polynomial kernel functions.
Our results were not consistent with the study of Günlü et al. (2008), Sivrikaya (2011) and Günlü (2012). Our study demonstrated that kappa statis-tics values were found 0.73 and 0.53 for SDS and SCC using Landsat 7 ETM+ with MLC method. However, we achieved a significant improvement with 0.94 kappa statistic for the development stage by using IKONOS satellite image and SVM linear, polynomial and radial kernel functions. The use of high-resolution satellite image and advanced clas-sification technique increased the success rate.
CONCLUSIONS
using ANN with a 0.83 and 0.78 kappa statistic value, and 92.57 and 89.77% overall accuracy as-sessments, respectively. The other result indicated that SDS and SCC were predicted with IKONOS image using SVM polynomial kernel function with a 0.94 and 0.88 kappa statistic value, and 95.95 and 91.17% overall accuracy assessments, respectively. The highest success was achieved for the SDS us-ing IKONOS with SVM polynomial kernel func-tion. IKONOS with SVM and Landsat 7 ETM+ with ANN gave better results. SVM classification method had better performance with the high spa-tial resolution satellite image. In the direction of our hypothesis, high resolution remotely sensed data with advanced classification algorithms gave higher success. There are many studies about the classification of stand parameters using MLC in Turkey. However, there is a need for the use of different classification methods such as SVM and ANN in order to forest stand; therefore, we think this study represents a contribution to the forestry community.
Acknowledgement
We would like to thank to ODOPEM and General Directorate of Forestry for providing data.
References
Anonymous (2007): Management Plan of Uğurlu Forest Plan-ning Unit between 2007–2026. Ardahan, Erzurum Forest Regional Directorate, Göle Forest Enterprise: 343. Anonymous (2008): Forest Management Guidelines. Ankara,
Republic of Turkey, General Directorate of Forestry: 215. Bakırman T. (2014): Comparison of satellite images classi-fied by different methods. In: Maktav D. (ed.): 5th Uzaktan
Algılama-CBS Sempozyumu, Istanbul, Oct 14–17, 2014: 1–7. Başkent E.Z., Kadıoğulları A.I. (2007): Spatial and temporal
dynamics of land use pattern in Turkey: A case study in İnegöl. Landscape and Urban Planning, 81: 316–327. Bulut S., Günlü A. (2016): Comparison of different supervised
classification algorithms for land use classes. Kastamonu University Journal of Forest Faculty, 16: 528–535. Bulut S., Günlü A., Keleş S. (2017): Evaluation of different
su-pervised classification algorithms for crown closure classes: A case study of Yapraklı Forest Planning Unit, Çankırı. In: Fakir H. (ed.): International Symposium on New Horizons in Forestry, Isparta, Oct 18–20, 2017: 133–137.
Chang C.C., Lin C.J. (2011): LIBSVM: A library for support vector machines. ACM Transactions on Intelligent Systems and Technology (TIST), 2: 27.
ERDAS LLC (2002): ERDAS Field Guide. 6th Ed. Atlanta,
ERDAS LLC: 658.
Gebreslasie M.T., Ahmed F.B., Van Aardt J.A.N. (2010): Predicting forest structural attributes using ancillary data and ASTER satellite data. International Journal of Applied Earth Observation and Geoinformation, 12S: S23–S26. Günlü A. (2012): Estimation of certain stand type parameters
(growth stage and crown closure) and land cover using Landsat TM satellite image. Kastamonu University Journal of Forest Faculty, 12: 71–79.
Günlü A., Sivrikaya F., Başkent E.Z., Keleş S., Çakır G., Kadıoğulları A.I. (2008): Estimation of stand type param-eters and land cover using Landsat-7 ETM image: A case study from Turkey. Sensors, 8: 2509–2525.
Hall R.J., Skakun R.S., Arsenault E.J. (2006): Modeling forest stand structure attributes using Landsat ETM+ data: Application to mapping of aboveground biomass and stand volume. Forest Ecology and Management, 225: 378–390.
Hazini S., Hashim M. (2015): Comparative analysis of product-level fusion, support vector machine, and artifi-cial neural network approaches for land cover mapping. Arabian Journal of Geosicences, 8: 9763–9773.
Hsu C.W., Chang C.C., Lin C.J. (2016): A Practical Guide to Support Vector Classification. Taipei, National Taiwan University: 16.
Hyyppa J., Hyyppa H., Inkinen M., Engdahl M., Linko S., Zhu Y. (2000): Accuracy comparison of various remote sensing data sources in the retrieval of forest stand attributes. For-est Ecology and Management, 128: 109–120.
Kadıoğulları A.I., Başkent E.Z. (2008): Spatial and temporal dynamics of land use pattern in Turkey: A case study in Gumushane. Environmental Monitoring and Assessment, 138: 289–303.
Kavzoglu T., Colkesen I. (2009): A kernel functions analysis for support vector machines for land cover classification. International Journal of Applied Earth Observation and Geoinformation, 11: 352–359.
Kayitakire F., Hamel C., Defourny P. (2006): Retrieving forest structure variables based on image texture analysis and IKONOS-2 imagery. Remote Sensing of Environment, 102: 390–401.
Kulkarni A.D., Lowe B. (2016): Random forest algorithm for land cover classification. International Journal on Recent and Innovation Trends in Computing and Communica-tion, 4: 58–63.
responses in the Brazilian Amazon Basin. Forest Ecology and Management, 198: 149–167.
Mohammadi J., Joibary S.S., Yaghmaee F., Mahiny A.S. (2010): Modelling forest stand volume and tree density using Landsat ETM data. International Journal of Remote Sensing, 31: 2959–2975.
Peuhkurinen J., Maltamo M., Vesa L., Packalén P. (2008): Estimation of forest stand characteristics using spectral histograms derived from an IKONOS satellite image. Photogrammetric Engineering & Remote Sensing, 74: 1335–1341.
Pilger N., Peddle D.R., Luther J.E. (2002): Estimation of forest cover type and structure from Landsat TM imagery using a canopy reflectance model for biomass mapping in Western Newfoundland. IEEE International Geoscience and Remote Sensing Symposium, 3: 1324–1326.
Sivrikaya F. (2011): The importance of spatial accuracy in characterizing stand types using remotely sensed data. African Journal of Biotechnology, 10: 14891–14906. Sivrikaya F., Keleş S., Çakır G., Başkent E.Z., Köse S. (2006):
Comparing accuracy of classified Landsat data with land use maps reclassified from the stand type maps. In: Caetano M., Painho M. (eds): 7th International Symposium on
Spa-tial Accuracy, Lisbon, July 5–7, 2006: 643–652.
Srivastava P.K., Han D., Rico-Ramirez M.A., Bray M., Islam T. (2012): Selection of classification techniques for land use/land cover change investigation. Advances in Space Research, 50: 1250–1265.
Taati A., Sarmadian F., Mousavi A., Pour C.T.H., Shahir A.H.E. (2015): Land use classification using support vector machine and maximum likelihood algorithms by Landsat-5 ETM images. Walailak Journal Science & Technology, 12: 681–687.
Tolessa T., Senbeta F., Abebe T. (2017): Land use/land cover analysis and ecosystem services valuation in the central highlands of Ethiopia. Forests, Trees and Livelihoods, 26: 111–123.
Topaloğlu R.H., Sertel E., Musaoğlu N. (2016): Assessment of classification accuracies of Sentinel-2 and Landsat-8 data for land cover/use mapping. The International Archives of the Photogrammetry, Remote Sensing and Spatial Informa-tion Sciences, XLI-B8: 1055–1059.
Ustuner M., Sanli F.B., Dixon B. (2015): Application of support vector machines for landuse classification using high-resolution RapidEye images: A sensitivity analysis. European Journal of Remote Sensing, 48: 403–422. Were K., Bui D.T., Dick Q.B., Singh B.R. (2015): A comparative
assessment of support vector regression, artificial neural networks, and random forests for predicting and mapping soil organic carbon stocks across an Afromontane land-scape. Ecological Indicators, 52: 394–403.
Wu T.F., Lin C.J., Weng R.C. (2004): Probability estimates for multi-class classification by pairwise coupling. Journal of Machine Learning Research, 5: 975–1005.