Different frequency and intensity of tillage al-ter soil physical, chemical and microbiological properties that are all indicators of soil quality (SQ) (Doran et al. 1996). Enzymes, especially dehydrogenases (DH), have been used for many decades as indicators of SQ because of their role in nutrient cycling and decomposition (Doran et al. 1996, Mikanová et al. 2012, Wolińska et al. 2013). Soil organic carbon (SOC) is the most important
indicator of SQ because of its impact on key soil properties. The soil bulk density (BD) is defined as the mass of solids per unit volume of moist soil. If BD becomes too high, it can limit plant root growth and yield production. For this reason, BD is often used as an indicator of SQ and included in many soil data sets. The value of BD that will adversely affect plant root growth and development depends on many factors including the crop being
Effects of long-term tillage practices on the quality of soil
under winter wheat
Anna M. GAJDA
1,*, Ewa A. CZYŻ
2, Jadwiga STANEK-TARKOWSKA
2,
Anthony R. DEXTER
3, Karolina M. FURTAK
1, Jarosław GRZĄDZIEL
11
Department of Agricultural Microbiology, Institute of Soil Science and Plant
Cultivation, State Research Institute, Puławy, Poland
2
Department of Soil Science, Environmental Chemistry and Hydrology,
Faculty of Biology and Agriculture, Rzeszów University, Rzeszów, Poland
3
Department of Soil Science Erosion and Land Conservation, Institute of Soil Science
and Plant Cultivation, Puławy, Poland
*Corresponding author: [email protected]
ABSTRACT
Gajda A.M., Czyż E.A., Stanek-Tarkowska J., Dexter A.R., Furtak K.M., Grządziel J. (2017): Effects of long-term till-age practices on the quality of soil under winter wheat. Plant Soil Environ., 63: 236–242.
These studies were done in 2013–2016 on the effects of two tillage systems on the quality of a loamy sand soil (Eu-tric Fluvisol) and were based on a field experiment started in 2002. Winter wheat was grown in conventional tillage (CT) with mouldboard ploughing (inversion) tillage; and reduced (non-inversion) tillage (RT) based on soil crush-ing-loosening equipment and a rigid-tine cultivator. Chopped wheat straw was used as mulch in both treatments. The physical, chemical and biological properties of the soil were investigated. RT increased soil bulk density in the 0–5 cm and 5–10 cm depth layers in comparison with CT. The greatest content of soil organic carbon (SOC) was found in the 0–5 cm layer under RT. The BIOLOG EcoPlate System showed that soil under RT had a greater meta-bolic activity and diversity of microbial communities than soil under CT. RT improved the quality of the surface soil as shown by the greater content of SOC and microbial activity measured in terms of dehydrogenases. However, the mean yields of winter wheat under RT and CT were similar. This suggests that the effects of increased bulk density (BD) on yield can be compensated by the effects of the improved microbial status.
Keywords: soil quality; cultivation; microorganisms; microbial diversity; Triticum aestivum L.
grown, and the management history (Nosalewicz and Nosalewicz 2011, Małecka et al. 2012). Several authors (Tebrügge and Düring 1999, Czyż and Dexter 2008) reported a significant increase in BD in no-tillage (NT) or reduced tillage (RT) in comparison with conventional tillage (CT) for the soil depths corresponding to the plough layer in CT. However, some authors observed no signifi-cant or systematic differences in BD between RT and CT (Ferreras et al. 2000, Anken et al. 2004). Under conditions of minimal vehicular traffic, BD is a function of natural factors (Carter 1990). Microbial diversity can be measured using various technique, e.g. the BIOLOG EcoPlate System. This allows testing for a number of ecologically-relevant substrates with replication, enables evaluation of the metabolic profile diversity of soil microor-ganisms, and allows quick determination of the ecological status of the microbial population in environmental samples (Frąc et al. 2012). Earlier studies showed that RT improves soil aeration, water infiltration, decreases SOC mineralization and therefore increases the size, diversity and ac-tivity of microbial communities. Such changes in SQ can affect plant growth and yield (Arvidsson et al. 2013, Małecka et al. 2015). This study was done to evaluate the effects of CT and RT on SQ by monitoring changes in some physical (BD), chemi-cal (SOC content) and microbiologichemi-cal (activity of DH, microbial metabolic diversity) properties of a loamy sand soil and in the yield of winter wheat.
MATERIAL AND METHODS
Field trial. A long-term field experiment was established in 2002 at the Institute of Soil Science and Plant Cultivation State Research Institute ex-perimental station in Grabów, Poland on a loamy
sand soil (Eutric Fluvisol) with initial SOC content of 0.71% at 0–10 cm depth and 0.61% at 10–20 cm depth (Czyż and Dexter 2008). Winter wheat cv. Jantarka was grown in monoculture under conventional (inversion) tillage (CT) based on the mouldboard plough (to 25 cm depth) and traditional soil tillage equipment, and reduced (non-inversion) tillage (RT) based on soil crushing-loosening equipment and a rigid-tine cultivator (to 10 cm depth). Tillage was done at the water content at or close to 0.19–0.20 kg/kg soil. This is the optimum water content for tillage of this soil as calculated from the water retention curve (Dexter and Bird 2001). Chopped wheat straw was used as mulch on both treatments. Fertilizer was applied to both treatments as follows: fall-applied mineral fertilizer Polifoska 18 kg N/ha, 60 kg P/ha and 90 kg K/ha; spring-applied mineral N (NH4NO3) 150 kg N/ha in 3 doses – 70 kg N/ha – beginning of spring growth, 55 kg N/ha – stem elongation and 25 kg N/ha – heading. Winter wheat was grown according to fertiliza-tion and weed control recommendafertiliza-tions used in Poland. The herbicide programme for tillage systems used pre-plant and post-emergence ap-plications (Komplet 560 SC 0.5 L/ha – applied in mid-late October, Chwastox Turbo 340 SL 2 L/ha – applied in early April).
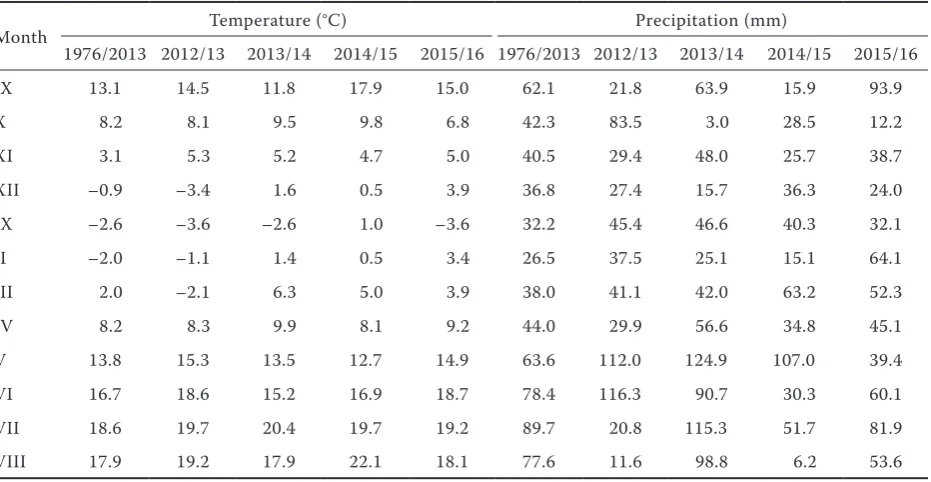
Soil samples. During years 2013–2016 soil sam-ples were collected each year from the fields at harvest with 4 replications at 0–5, 5–10, 15–20 and 30–35 cm depths. Some soil characteristics are presented in Table 1. The weather conditions are shown in Table 2. Both mean air temperature and the sum of precipitation differed significantly between the years.
[image:2.595.63.533.636.740.2]Physical properties. The soil particle size dis-tribution was determined by the Casagrande aero-metric method as modified by Prószyński (Litynski
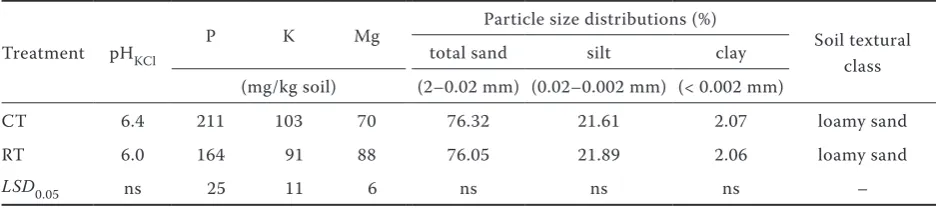
Table 1. Basic soil characteristics at 0–20 cm depth under both tillage treatments for year 2013–2016
Treatment pHKCl P K Mg
Particle size distributions (%)
Soil textural class
total sand silt clay
(mg/kg soil) (2–0.02 mm) (0.02–0.002 mm) (< 0.002 mm)
CT 6.4 211 103 70 76.32 21.61 2.07 loamy sand
RT 6.0 164 91 88 76.05 21.89 2.06 loamy sand
LSD0.05 ns 25 11 6 ns ns ns –
et al. 1976). This enabled the content of clay (mineral particles < 2 μm) to be determined. Soil bulk density was measured using 100 mL cylinder samples of undisturbed soil by weighing before and after dry-ing at 105°C for 48 h. The dry BD was calculated as the mass of dry soil per unit volume of moist soil.
Chemical properties. The SOC content was measured by wet oxidation using the Tiurin meth-od. Soil pHKCl was measured potentiometrically (1:2.5 mV) in water and in a 1 mol/L KCl solution, respectively (ISO 10390, 2005). Available P and K were determined by the Egner-Rhiem method and available Mg by the Schachtschabel method.
Microbiological activity. The activity of soil dehydrogenases was determined in moist soil using TTC (2,3,5-triphenyltetrazolium chloride) as a substrate (Casida et al. 1964).
Biolog EcoPlate method. Diversity of the ca-tabolism in the soil microbial community was analysed using the EcoPlate method (Biolog Inc., Hayward, USA). Fresh soil (1 g) was suspended in 99 mL sterile water and shaken for 20 min. Next, the samples were incubated at 4°C for 30 min. After cooling, the soil solutions were fil-tered (Bag Filter, Interscience) and each of the 96 wells on the EcoPlate were inoculated with 120 μL of sample. Microplates were incubated at 25°C for 168 h. Measurements were made every 24 h in the MicroStation at 590 nm.
Statistical analysis. Statistical analysis of vari-ance (ANOVA) was used to evaluate the effects of tillage on the measured variables, and the least significant differences (LSD) were used to compare means (P < 0.05). Pearson correlation coefficients were calculated to show the relations between soil properties and winter wheat grain yield (WWY) at P < 0.01 and P < 0.05.
RESULTS AND DISCUSSION
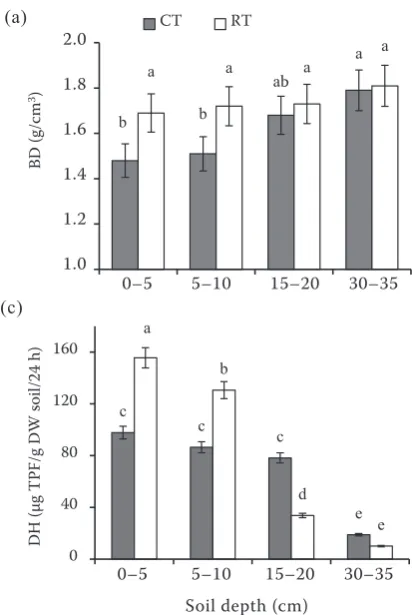
[image:3.595.67.533.126.367.2]The BD of the top soil layer was different (P < 0.05) in the two tillage systems (Figure 1a). After 11–14 years of different tillage, the RT system had in-creased BD in the top layer, especially at 0–5 cm and 5–10 cm depths as compared with CT. At the 0–5 cm and 5–10 cm depths, RT caused BD increase in the surface soil of 0.20 and 0.21 g/cm3, respectively, as compared with CT. The highest values of BD were found in the 30–35 cm layer, where no significant effect of tillage systems on BD was observed. Differences in BD between CT and RT systems were not significant at the 15–20 cm depth; however, BD in RT was slightly higher than in CT. The average values of BD at 0–20 cm un-der RT were higher (1.71 g/cm3) than under CT (1.56 g/cm3). The greatest values of BD occurred deeper (30–35 cm) for CT and RT (1.62 and
Table 2. Monthly mean air temperature and total precipitation and long-term average (1976–2013) at Grabów experimental station (Poland)
Month Temperature (°C) Precipitation (mm)
1976/2013 2012/13 2013/14 2014/15 2015/16 1976/2013 2012/13 2013/14 2014/15 2015/16
IX 13.1 14.5 11.8 17.9 15.0 62.1 21.8 63.9 15.9 93.9
X 8.2 8.1 9.5 9.8 6.8 42.3 83.5 3.0 28.5 12.2
XI 3.1 5.3 5.2 4.7 5.0 40.5 29.4 48.0 25.7 38.7
XII –0.9 –3.4 1.6 0.5 3.9 36.8 27.4 15.7 36.3 24.0
IX –2.6 –3.6 –2.6 1.0 –3.6 32.2 45.4 46.6 40.3 32.1
II –2.0 –1.1 1.4 0.5 3.4 26.5 37.5 25.1 15.1 64.1
III 2.0 –2.1 6.3 5.0 3.9 38.0 41.1 42.0 63.2 52.3
IV 8.2 8.3 9.9 8.1 9.2 44.0 29.9 56.6 34.8 45.1
V 13.8 15.3 13.5 12.7 14.9 63.6 112.0 124.9 107.0 39.4
VI 16.7 18.6 15.2 16.9 18.7 78.4 116.3 90.7 30.3 60.1
VII 18.6 19.7 20.4 19.7 19.2 89.7 20.8 115.3 51.7 81.9
1.74 g/cm3, respectively) as compared with BD at 0–20 cm. This may be due to a tillage pan that had been formed before the experiment began. An earlier research of Czyż and Dexter (2008) showed that less intense tillage resulted in significant changes in BD, water content and soil stability. Similarly, Mühlbachová et al. (2015) in a long-term field experiment on an Orthic Luvisol with clay loamy texture in the Prague-Ruzyně region (Czech Republic) found greater BD values in the 0–10, 10–20 and 20–30 cm layers of NT than in CT. Małecka et al. (2012) also found a significant difference in BD of a loamy sand (Albic Luvisols) at the 0–5 cm depth. After 7 years of cultivation RT and NT caused an increase of BD in the top soil of 0.15 and 0.30 g/cm3, respectively as com-pared with CT. Differences in BD between till-age systems were not significant at the 10–20 cm depth; however, BD in CT was slightly smaller than in RT and NT.
The SOC content at different depths under CT and RT is shown in Figure 1b. The highest SOC content 0.97 g/100 g soil was in the top layer at the 0–5 cm depths under RT. The results show that the RT treatment significantly increased the SOC content by 23% mostly in the 0–5 cm soil
layer as compared with CT (0.79 g/100 g soil). Mühlbachová et al. (2015) in a long-term field experiment also showed that RT and NT increased the SOC contents in top layers of soil. Similarly, Franzluebbers (2002) reported that the main dif-ferences between CT and NT are in the top few centimetres of soil.
The highest activity of soil DH was in the 0–5 cm and 5–10 cm depths under RT at 155.6 and 130.6 µg TPF g/DW (dry weight) soil/24 h, respectively (Figure 1c). At these depths, the soil DH activity was higher by 57.8 and 44.1 µg TPF g/DW soil/24 h, respectively, as compared with CT; this result is consistent with Doran et al. (1996) and Wolińska et al. (2013). At the 15–20 cm and 20–30 cm depths, the average activity of DH was smaller under RT than under CT. In sub-arable soil layer (30–35 cm) the DH activity was the lowest under both RT and CT at 18.9 and 10.0 µg TPF g/DW soil/24 h, respectively. RT stimulated the activity of soil microbial communities as shown by the greater DH activity in comparison with CT. This stimulation of soil DH is of importance in pro-cesses of nutrient liberation for plants. Comparable results were obtained by Mikanová et al. (2009) and Gajda et al. (2013).
b b
ab
a
a a a
a 1,0 1,2 1,4 1,6 1,8 2,0
0-5 5-10 15-20 30-35
BD (g /c m 3) CT RT
b b b
d a b c d 0,0 0,5 1,0 1,5
0-5 5-10 15-20 30-35
SO C (g /100 g so il) c c c e a b d e 0 40 80 120 160
0-5 5-10 15-20 30-35
DH ( µg T PF /g DW so il/ 24 h )
[image:4.595.73.283.92.400.2]Soil depth (cm)
Figure 1. Mean values (16 replicates) of (a) soil bulk density (BD); (b) soil organic carbon (SOC), and (c) soil dehydrogenases (DH) activity under different till-age practices at different depths for years 2013–2016. Values with different letters are statistically different
at P < 0.05. Vertical bars represent the standard error
(SE). CT – conventional tillage; RT – reduced tillage
b b
ab
a
a a a
a 1,0 1,2 1,4 1,6 1,8 2,0
0-5 5-10 15-20 30-35
BD (g /c m 3) CT RT
b b b
d a b c d 0,0 0,5 1,0 1,5
0-5 5-10 15-20 30-35
SO C (g /100 g so il) c c c e a b d e 0 40 80 120 160
0-5 5-10 15-20 30-35
DH ( µg T PF /g DW so il/ 24 h )
Soil depth (cm)
(a) (b)
(c)
Soil depth (cm)
Soil depth (cm) 0–5 5–10 15–20 30–35
0–5 5–10 15–20 30–35
The analysis of the metabolism of microorgan-isms has revealed that the microbial community metabolized all groups of substrates (Figure 2). Greater metabolic diversity was observed in RT than in CT. The different abilities of soil microor-ganisms to metabolize 31 offered sole C sources [8 carbohydrates (CH), 8 carboxylic acids (CXA), 4 polymers (PLM), 6 amino acids (AA), 3 mis-cellaneous substrates and 2 amines and amides (AMAD) – all 3-times replicated on each micro-plate] were demonstrated. Soil microorganisms in CT and RT most intensively catabolized substrates from the group of CXA, and the least those from the group AMAD. For both soils, the percentage utilization of different groups of carbon substrates is presented for 24–96 h of total incubation time, in which differentiation in microbial metabolic activity is the most visible.
After 24 h, the soil microbial community in RT metabolized the CH, PLM, CXA, AA and AMAD groups up to 31, 25, 20, 20, and 4%, respectively, whereas the microbial community in CT metabo-lized substrates differently. In CT the CH and PLM group utilization rate was slower and reached up to 12% and 7%, respectively, but only the rate of CXA group utilization reached up to 56% at the same time and was greater than in RT soil. The AA, and AMAD groups were utilized similarly as in RT soil (20% and 4–5%, respectively), but the utilization rate of PLM group was slower and reached 7%, on average, compared to RT soil.
After 48 h the metabolic activity of soil microbial populations changed in both tillage systems. After 48 h in RT, an increase in utilization rate of CXA and AMAD groups to 30% and 8% was found,
re-spectively, while the utilization rate of PLM group declined to 11% compared to the catabolic rates observed after 24 h. In CT, an 18% decrease, on average, in the rate of CXA group utilization was observed but the rates of CH, AA, AMAD, and PLM groups increased by 7, 4, 5 and 2%, respec-tively, in relation to 24 h.
After 72 h, the metabolic activity of micro-organisms had not changed significantly in RT compared with 48 h. In CT, microbial metabolic activity increased, especially in utilization of CH and PLM groups up to 26% and 11%, respectively. For the next 24 h of incubation, catabolic activity of microorganisms in soil under both treatments became more stable and the readings at 96 h did not show any significant changes in the rate of 0
20 40 60 80 100
24 48 72 96
P
C
SG
u
til
iz
at
io
n
in C
T (
%
)
Incubation time (h)
0 20 40 60 80 100
24 48 72 96
PC
SG
u
til
iz
at
io
n
in R
T
(%
)
Incubation time (h)
[image:5.595.79.531.101.247.2]PLM AMAD AA CXA CH
Figure 2. Percentage of utilization of particular carbon substrates group (PCSG) by microbial communities in-fluenced by different tillage practices within 96 h of incubation. PLM – polymers; AMAD – amines and amides; AA – amino acids; CXA – carboxylic acids; CH – carbohydrates; CT – conventional tillage; RT – reduced tillage
a a a a a
b a a a a
0 2 4 6 8
2013 2014 2015 2016 4-year average
W
W
Y (
t/
ha)
[image:5.595.326.510.520.672.2]CT RT
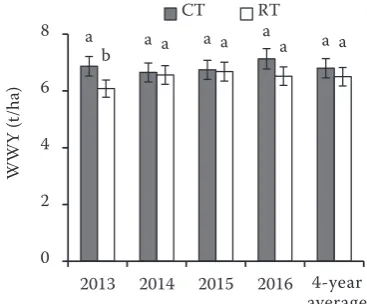
Figure 3. Mean values (16 replicates) of grain yields of winter wheat under different tillage practices for years 2013–2016. Values with different letters are
statisti-cally different at the P < 0.05. Vertical bars represent
the standard error. WWY – winter wheat grain yield; CT – conventional tillage; RT – reduced tillage
utilization of 5 groups of carbon source on incu-bated EcoPlates. Also, Yang et al. (2013) observed significantly higher utilization rates of AA, CH, and PLM groups up to 68, 67 and 23%, respectively under NT than under CT (P < 0.01). Furthermore, Habig and Swanepoel (2015) reported markedly higher metabolic diversity in RT than in CT. This was attributed to the higher disruption in microbial development, metabolic activity and abundance due to ploughing.
Tillage affects crop yield mostly through modify-ing soil BD, SOC, plant residues, and the diversity and activity of microbial communities (Małecka et al. 2015). In this study, the 4-year mean WWY under RT was 0.3 t/ha less (4.5%) than under CT, but this difference was not statistically signifi-cant (Figure 3). Arvidsson et al. (2013) reported similar results and suggested that an increase in BD reduced soil aeration, root growth and crop development, which might reduce crop yield un-der RT. However, higher microbial activity and favourable weather conditions such as temperature (2014–2016) and precipitation (2013–2015), par-ticularly in May as compared with the long-term
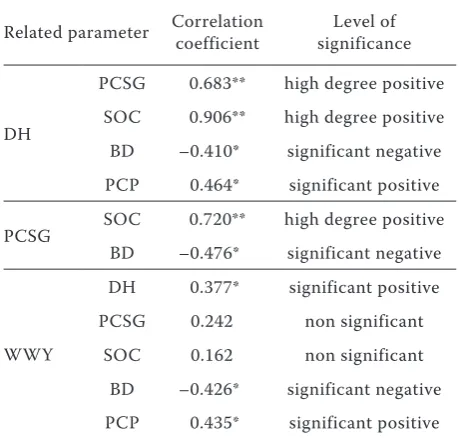
average (Table 2), may contribute to higher mi-crobial activity and nutrient liberation for plants and mitigate the decrease of WWY caused by BD increase in RT relative to CT. These correlations demonstrate the high sensitivity of the studied parameters to changes in soil and show that SOC is the key for the activity and diversity of microbial communities (Table 3). The WWY showed cor-relations with PCP (0.435*), BD (–0.426*) and DH (0.377*) at P < 0.05.
In conclusion, the study have shown that soil under long-term cultivation of winter wheat with RT resulted in greater values of SOC, enzymatic activity, and greater microbial diversity and SQ than with CT, especially in the top (0–5 cm) layer. The EcoPlate System showed that soil under RT had a greater metabolic activity and diversity of microbial communities than under CT. However, RT increased soil BD, especially in the 0–5 cm and 5–10 cm depth layers in comparison with CT. These results suggest that the effects of increased BD on yield, as discussed in the introduction, can be compensated by the effects of the improved microbial status.
REFERENCES
Anken T., Weisskopf P., Zihlmann U., Forrer H., Jansa J., Perhacova K. (2004): Long-term tillage system effects under moist cool conditions in Switzerland. Soil and Tillage Research, 78: 171–183. Arvidsson J., Westlin A., Sörensson F. (2013): Working depth in non-inversion tillage – Effects on soil physical properties and crop yield in Swedish field experiments. Soil and Tillage Research, 126: 259–266.
Casida L.E.Jr., Klein D.A., Santoro T. (1964): Soil dehydrogenase activity. Soil Science, 98: 371–376.
Carter M.R. (1990): Relative measures of soil bulk density to characterize compaction in tillage studies on fine sandy loams. Canadian Journal of Soil Science, 70: 425–433.
Czyż E.A., Dexter A.R. (2008): Soil physical properties under winter wheat grown with different tillage systems at selected locations. International Agrophysics, 22: 191–200.
Dexter A.R., Bird N.R.A. (2001): Methods for predicting the optimum and the range of soil water contents for tillage based on the water retention curve. Soil and Tillage Research, 57: 203–212. Doran J.W., Sarrantonio M., Liebig M. (1996): Soil health and
sustainability. In: Sparks D.L. (ed.): Advances in Agronomy. San Diego, Academic Press.
[image:6.595.62.292.141.360.2]Ferreras L.A., Costa J.L., Garcia F.O., Pecorari C. (2000): Effect of no-tillage on some soil physical properties of a structural Table 3. The correlation coefficients obtained between
selected soil properties, precipitation and winter wheat grain yields
Related parameter Correlation coefficient significanceLevel of
DH
PCSG 0.683** high degree positive SOC 0.906** high degree positive BD –0.410* significant negative PCP 0.464* significant positive PCSG SOC 0.720** high degree positive
BD –0.476* significant negative
WWY
DH 0.377* significant positive PCSG 0.242 non significant
SOC 0.162 non significant BD –0.426* significant negative PCP 0.435* significant positive DH – dehydrogenases activity; PCSG – particular carbon substrates group utilized by microbial communities; SOC – soil organic carbon; BD – bulk density; WWY – winter wheat grain yields; PCP – precipitation;
degraded Petrocalcic Paleudoll of the southern ‘Pampa’ of Argentina. Soil and Tillage Research, 54: 31–39.
Franzluebbers A.J. (2002): Soil organic matter stratification ratio as in indicator of soil quality. Soil and Tillage Research, 66: 95–106. Frąc M., Oszust K., Lipiec J. (2012): Community level physiological
profiles (CLPP), characterization and microbial activity of soil amended with dairy sewage sludge. Sensors, 12: 3253–3268. Gajda A.M., Przewłoka B., Gawryjołek K. (2013): Changes in soil
quality associated with tillage system applied. International Agrophysics, 27: 133–141.
Habig J., Swanepoel C. (2015): Effects of conservation agricul-ture and fertilization on soil microbial diversity and activity. Environments, 2: 358–384.
Litynski T., Jurkowska H., Gorlach E. (1976): Chemical and Ag-ricultural Analysis. Warszawa, Wydawnictwo Naukowe PWN. (In Polish)
Małecka I., Blecharczyk A., Sawińska Z., Dobrzeniecki T. (2012): The effect of various long-term tillage systems on soil proper-ties and spring barley yield. Turkish Journal of Agriculture and Forestry, 36: 217–226.
Małecka I., Blecharczyk A., Sawińska Z., Swędrzyńska D., Piechota T. (2015): Winter wheat yield and soil properties response to long-term non-inversion tillage. Journal of Agricultural Science and Technology, 17: 1571–1584.
Mikanová O., Javůrek M., Šimon T., Friedlová M., Vach M. (2009): The effect of tillage systems on some microbial characteristics. Soil and Tillage Research, 105: 72–76.
Mikanová O., Šimon T., Javůrek M., Vach M. (2012): Relationships between winter wheat yields and soil carbon under various tillage systems. Plant, Soil and Environment, 58: 540–544. Mühlbachová G., Kusá H., Růžek P. (2015): Soil characteristics
and crop yields under different tillage techniques. Plant, Soil and Environment, 61: 566–572.
Nosalewicz A., Nosalewicz M. (2011): Effect of soil compaction on dehydrogenase activity in bulk soil and rhizosphere. Inter-national Agrophysics, 25: 47–51.
Tebrügge F., Düring R.-A. (1999): Reducing tillage intensity – A review of results from a long-term study in Germany. Soil and Tillage Research, 53: 15–28.
Yang Q., Wang X., Shen Y. (2013): Comparison of soil microbial community catabolic diversity between rhizosphere and bulk soil induced by tillage or residue retention. Journal of Soil Science and Plant Nutrition, 13: 187–199.
Wolińska A., Stępniewska Z., Szymańska Z. (2013): Dehydroge-nase activity of soil microorganisms and the total DNA level in soil of different use. Journal of Agricultural Science and Technology, B 3: 613–622.