A framework for establishing the technical efficiency of Electricity
Distribution Counties (EDCs) using Data Envelopment Analysis
Shane Mullarkey
1, Brian Caulfield
⇑, Sarah McCormack
2, Biswajit Basu
3Department of Civil, Structural and Environmental Engineering, Trinity College Dublin, Ireland
a r t i c l e i n f o
Article history:
Received 7 February 2014 Accepted 19 January 2015
Keywords:
Data Envelopment Analysis Technical efficiency
Performance measurement/evaluation Electricity distribution
a b s t r a c t
European Energy market liberalization has entailed the restructuring of electricity power markets through the unbundling of electricity generation, transmission and distribution, supply activities and introducing competition into electricity generation. Under these new electricity market regimes, it is important to have an evaluation tool that is capable of examining the impacts of these market changes. The adoption of Data Envelopment Analysis as a form of benchmarking for electricity distribution regu-lation is one method to conduct this analysis. This paper applies a Data Envelopment Analysis framework to the electricity distribution network in Ireland to explore the merits of using this approach, to deter-mine the technical efficiency and the potential scope for efficiency improvements through reorganizing and the amalgamation of the distribution network in Ireland. The results presented show that overall grid efficiency is improved through this restructuring. A diagnostic parameter is defined and pursued to account for aberrations across Electricity Distribution Counties as opposed to the traditionally employed environmental variables. The adoption of this diagnostic parameter leads to a more intuitive understand-ing of Electricity Distribution Counties.
!2015 Elsevier Ltd. All rights reserved.
1. Introduction
The structural adjustment of Electricity Power Systems (EPS) liberalization over the last 20 years worldwide has seen a signifi-cant shift in focus from regulated to a deregulated environment to enhance technical efficiency, financial viability and guard against the threat of dwindling fossil fuel resources coupled with increasing fuel prices. The underlying rational behind these reforms is to foster a shift from an inefficient monopolized verti-cally-integrated industry to an efficient competitive electricity
market environment[59]. The transmission and distribution
net-works of a nation’s electricity system are natural monopolies, and as such are less affected by the recent EPS deregulation. How-ever, as electricity policy thinking has altered with private sector participants in the generation sector, regulatory reform and incen-tive regulation of electricity distribution utilities have become
more common[28]. Implementing benchmark performance
mea-surement and assessing technical efficiency of electricity
distribu-tion utilities4have seen extensive research in recent years with DEA
at the forefront of this research. Effective regulation in terms of elec-tricity distribution, network access, network interconnection and delivery prices, network investment and network service quality is a paramount component of successful EPS liberalization programmes
worldwide [36]. Data Envelopment Analysis (DEA) concepts were
first introduced by Farrell[27]but later the approach was pioneered by Charnes et al.[12]that has led to the foundations of a literature field that has formed at the interface of operational research and economics. This paper employs a DEA non-parametric methodology to establish a frontier or best practice benchmark measure of the rel-ative performance of twenty-six Electricity Distribution Counties (EDCs)5in Republic of Ireland (ROI). The aims and objectives of this
research are: (1) to establish technical efficiency and differentiate between efficient and inefficient EDCs by implementing the DEA benchmarking approach to electricity distribution in the ROI; (2) to propose specific directions to enhance operational management and to improve the utilization of resources within the inefficient EDCs and (3) to investigate the possibility of reorganizing and amalgamation of existing EDCs to improve efficiency of electricity
http://dx.doi.org/10.1016/j.enconman.2015.01.049 0196-8904/!2015 Elsevier Ltd. All rights reserved.
⇑Corresponding author. Tel.: +353 1 896 2534; fax: +353 1 677 3072. E-mail addresses: [email protected] (S. Mullarkey), [email protected] (B. Caulfield),[email protected](S. McCormack),[email protected](B. Basu).
1 Tel.: +353 1 896 1440; fax: +353 1 677 3072. 2 Tel.: +353 1 896 3321; fax: +353 1 677 3072. 3 Tel.: +353 1 896 2389; fax: +353 1 677 3072.
4We adopt the umbrella term utilities to refer to electricity distribution organi-zations, companies, districts, centers, zones, areas, regions, counties and operators.
5Electricity Distribution Counties refer to autonomous regions, or municipalities located on the island of Ireland.
Contents lists available atScienceDirect
Energy Conversion and Management
supply networks distribution system based on geographical convenience.
The research conducted in this paper adds to the field of research in evaluating the technical efficiency of power systems. Firstly, in its application to the test system in all island SEM, secondly, in its employment of input–output parameters and alternative combina-tions to develop new models based on the DEA techniques for the efficiency assessment. The input–output parameters, alternative combinations and constructed DEA models are the salient contribu-tions of the paper. A significant contribution of the current research is the wind generating regional DEA model employed in the National level efficiency context as it provides a new framework for evaluat-ing wind generation on a regional basis.
2. Single electricity system
Since 1988, the Irish electricity market has adopted a process of liberalization, prior to this Electricity Supply Board (ESB) operated as a vertically integrated state owned monopoly. The liberalization process has occurred in phases with sections of the market being progressively opened for competition, with the market entirely open since 2004. The Northern Ireland Authority for Utility Regula-tion (NAIRU) and the Commission for Energy RegulaRegula-tion (CER) commenced on the 1st November 2007 governance of the Single Electricity Market (SEM). The SEM is an All-Island cross-border electricity market incorporating both the Republic of Ireland (ROI) and Northern Ireland (NI). The SEM initiative established a wholesale electricity market for the island, which subsequently formed the All-Island Market for Electricity (AIME). In 2008, it had 2.5 million electricity customers in total, 1.8 in ROI and 0.7 million in NI[16]. As a centralized gross mandatory pool, all elec-tricity in SEM is traded through a market clearing mechanism based on generators bidding their Short Run Marginal Cost (SRMC)
and receiving the System Marginal Price (SMP)[45]. The SEM is
operated and administered by the Single Electricity Market Opera-tor (SEMO), which is a contractual joint venture between Eirgrid and the Systems Operator for Northern Ireland (SONI), the trans-mission system operators in the ROI and NI respectively (both are Independent System Operators (ISO)). The distribution system operators (DSO) of ROI and NI are owned and operated by ESB Net-works and Northern Ireland Electricity (NIE) respectively. The SEM market design has features reminiscent of markets in other juris-dictions (most notably Nordpool, the Eastern Australian market and the former British pool) but is a unique dual currency inter-jurisdictional market[16]. The SEM represents the first synchro-nous system of electricity system of its kind in the world. The transmission network consists of 6529 km of 400/220/110 kV overhead lines and 1083 km of 220/110/38 kV underground cables. Due to ROI widely dispersed and significant rural population, the electricity distribution network is typically characterized by long length of 38 kV (138,977 km) and medium voltage (20,600 km) overhead lines with low customer density of 12 per km[62]. These unique characteristics provide an interesting market to study in terms of efficiency.
The EU Third Energy Package under Directive 2009/72/EC pro-vides three unbundling models for achieving the separation of
transmission from generation and supply activities [31]. Ireland
currently does not comply with any of the proposed models as Eir-grid is licensed by the CER to act as transmission system operator (TSO) and is responsible for the operation and development of the transmission grid while ownership of the transmission asset remains with ESB, responsible for the maintenance and construc-tion of the system. The restructuring of the Irish electricity market is inevitable under the EU Directive 2009/72/EC. Further restruc-turing of the distribution network is anticipated with ESB Net-works National plan envisaging the disentanglement of the
national electricity distribution network into 26 zones[23]. As of 2012, data relating to the technical efficiency of electricity distri-bution are only available on a county basis. The registered capacity of the SEM is 11,388 MW with thermal plants contributing 84% (9535 MW), wind 11% (1331 MW), pumped storage 3% (292 MW) and hydro 2% (216 MW). The All-Island fuel mix for 2008 consisted of 61% Gas, 7% Peat, 11% Renewables, 17% Coal, 4% Oil, and 1% other. There is a growing trend evident since 2005 of an increase in contributions of Peat, Gas and Renewables at the expense of
Oil and Coal[15]. The Annual Energy Flow of the SEM in GWhs
for 2008 consisted of 29,981 generated, 26,677 from the transmis-sion system, with the distribution network consuming 18,714. The total customer sales for 2008 were 26,194, with DSO contributing 24,043 and TSO 2150. ESB Networks is the licensed owner of the electricity distribution system assets whilst ESB Networks Limited is the licensed distribution system operator responsible for the planning, development, construction, operation, maintenance and connection to the electricity distribution system. ESB Networks Limited is also responsible for the installation, maintenance and reading of electricity meters. Numerous countries are employing incentive regulation to promote efficiency improvement in elec-tricity transmission and distribution utilities[33].
3. Literature review on electricity distribution efficiency measurement
DEA has long been established as an advanced mathematical methodology for benchmarking and measuring efficiency a set of homogenous entities called Decision Making Units (DMUs)
[24,67,17]. DEA models have been adopted effectively to assess the optimal production of a wide variety of goods and services including agriculture, transport, waste management and in
partic-ular the energy sector [56,6,60,40,57,8,66,46]. Since 1980s DEA
has been used to measure the relative performance of electricity utilities. The adoption of DEA to Electricity Power Systems has been extensive as it accommodates the efficiency measurement of multi-ple outputs and multimulti-ple inputs without pre-assigned weights and where no functional form is pre-established but one is calculated from the sample observations in an empirical way[44]. These char-acteristics are particularly relevant when investigating, evaluating and modelling the performance of electricity distribution utilities. Fare et al.[26]pioneered research in this area when they measured the efficiency of electric plants in Illinois (USA) between 1975 and 1979, in order to relate the efficiency scores obtained to the regula-tion of the sector. Their findings indicate that regularegula-tion does not automatically result in efficient operation of electric utilities, nor does it result in consistent performance across plants. The relative efficiency of electricity distribution utilities has seen extensive research worldwide in the last decade due to the restructuring of electricity energy markets, particularly with the introduction of regulation, privatization and trade liberalization in numerous
coun-tries [55]. Weyman-Jones [63,64] measured the productive
effi-ciency of 12 area electricity boards in England and Wales before and after their privatization in 1990. Less than half of the area boards were technical efficient and wide divergences exist in their
performance. Weyman-Jones[64]finds there are numerous
practi-cal issues that need to resolve dangers of market collusion and
reg-ulatory commitment that exist. Miliotis [43] employed DEA to
[32]conclude there exists no significant difference between public and privately owned electricity distribution utilities in terms of technical efficiency. In contrast to this Bagdadioglu et al.[3]and
Kumbhakar and Hjalmarsson[38]find private ownership of electric
utilities leads to greater efficiency performance as opposed to pub-lic ownership. Lo et al.[41]and Chien et al.[14]investigate the effi-ciency of electricity distribution districts and service centers associated with the Taiwan Power Company (TPC) respectively. Both studies propose district and service center reorganization to increase efficiency. In both cases higher efficiency is attainable
through reorganization. Yang and Lu[65], and Chen[13]
investi-gated Taiwan’s electricity distribution sector in a rural versus urban setting found on average technical efficiency to be greater for urban areas as a result of the geographical dispersion of customers. They recommend including an environmental variable in the DEA analy-sis to account for these differing electricity distribution environ-ments (i.e. environmental variable).6 Jha et al. [35] analyse the
performance of the electricity distribution system in Nepal using weight restriction DEA techniques to measure efficiency. Again as with previous examples in the literature electricity distribution cen-tre reorganization and directions for improvement are put forward.
Pahwa et al. [49]present a method for benchmarking the
perfor-mance of the 50 largest electric distribution utilities in the U.S. based on DEA. The results analyse performance efficiency, inefficient utili-ties, input–output variables and sensitivity-based classification of utilities. They conclude inefficient utilities can adopt and develop strategic plans to improve performance. For an extensive review on applications of DEA on electricity distribution systems the reader is referred to Santos et al.[55], Jamasb and Pollitt[33], Reyes and Tovar
[53], Doraisamy[21], Kheirkhah et al.[39]and de Souza et al.[20].
4. Non-parametric Data Envelopment Analysis (DEA) efficiency measurement
DEA is a mathematical programming non-parametric tech-nique, applied in performance measurement and benchmarking
[40]. It has been applied in a range of empirical settings to identify technical inefficiencies of DMUs and provide targets for
improve-ment for inefficient DMUs. Charnes et al.[12]pioneered the DEA
approach, entitled Charnes–Cooper–Rhodes (CCR) model where a frontier based efficiency measurement is developed under con-stant returns to scale (CRS). DMUs operating on the constructed efficiency frontier are Pareto-optimal efficient units and DMUs not on the efficiency frontier are inefficient. The formulation of the primal form of the CCR linear programming model to measure total technical efficiency (TTE) for each DMU is given as
Max DMUk¼hk¼ Pm
r¼1urkyyk Pn
r¼1
m
jkxjkSubject to: Pm
r¼1urkyrz Pn
r¼1
m
jkxjz61;z¼1;. . .;s;
urk
v
jkP0; r¼1;. . .m; j¼1;. . .;n;ð1Þ
In this formulation, there are m outputs produced, n input
resources, andsDMUs or EDCs.kthDMU being evaluated in the
set ofz= 1,. . .,sDMUs, with an efficiency measure ofhkrated
rela-tive to all other DMUs. The output datayrkare the value of outputr
forDMUk, whilexjk is the inputjforDMUkduring the period of
observation.urkis the coefficient or weight assigned to outputsr
computed in the solution to the DEA model, similarly
v
rk is thecoefficient of weight assigned to inputs jcomputed in the DEA
model. All weights are restricted and non-negative. The measure
of efficiency is defined as the maximization of the ratio of weighted linear combinations of outputs to the weighted linear combina-tions of inputs, subject to the constraint that the efficiency score obtained for each DMU cannot exceed one. The efficiency score is bounded between zero and one. The above CCR model is a fractional programming model and can be transformed to a linear programming problem if either the denominator or numerator of the ratio is forced to equal one[51].
Max DMUk¼hk¼ Xm
r¼1 urkyrk
Subject to: X m
r¼1 urkyrz$
Xn
r¼1
v
jkxjz60; z¼1;. . .;s;Xn
r¼1
v
jkxjk¼1l
r;v
jPe
>0; r¼1;. . .;m; j¼1;. . .;n;ð2Þ
where
e
is an infinitesimal positive number. This form is known as the multiplier form of the linear programming problem. The dual problem of the multiplier is solved for computational convenience and examining the slack variables.Min hk$
e
Xnj¼1 s$
jkþ Xm
r¼1 sþ
rk !
Subject to: X s
z¼1
xjzkzþs$jk¼hxjk j¼1;2;. . .;n;
Xs
z¼1
yrzkz$sþrk¼yrk r¼1;2;. . .;m;
kz;s$jk;sþrkP0 z¼1;2;. . .;s:
ð3Þ
wherehkis the scalar efficiency measure of DMY ‘‘k’’ rate relative to
all other DMUs,s$
jkslack variable for input constraint,sþrkslack
var-iable for output constraints, which are both constrained and to be non-negative, andkzis the dual coefficient or weight assigned to
DMUs. Efficiency scores are constructed by measuring how far a DMU is from the frontier. DEA establishes an efficiency score for each DMU relative to other DMUs in the database that demon-strates what the ‘‘most efficient’’ DMUs are and by how much less efficient DMUs fall short [47]. Banker et al. [4] constructed the Banker–Charnes–Cooper (BCC) model under Variable Returns to Scale (VRS) environment producing an efficiency frontier measure of technical efficiency. The formulation of the BCC model is
achieved by adding the convexity constraint Ps
z¼1kz¼1 to (3).
The BCC model allows for further analysis of the CCR efficiency score by decomposing it into technical and scale efficiency compo-nents thereby permitting an investigation of scale effects[58]. Scale efficiency is a ratio of the two efficiency scores obtained in the CCR and BCC models and is not greater than one[19].
Scale efficiency¼hCCR=hBCC ð4Þ
where hCCR and hBCC are CCR and BCC efficiency scores of DMU
respectively. The scale efficiency represents the proportion of inputs that can be further reduced after pure technical in efficiency is elim-inated if scale adjustments are possible. Environmental, exogenous or non-discretionary variables are those that are not under the direct discretionary control of the DMUs or EDCs in this case. The previous illustrated DEA procedures implicitly assume DMUs control all variables, failing to account for environmental variable influences.
Examples from DEA electricity distribution literature include inverse density index, customer and network density, customer
dispersion. Banker and Morey [5] whose formulation follows,
develop a single stage approach to account for non-discretionary 6 Environmental variables refer to environmental influences, non-discretionary,
environmental variables (quasi-fixed inputs and/or outputs whose magnitudes are temporarily constrained by contractual arrangements).
Min hk$
e
Xnj2ID s$
jkþ Xm
r¼1 sþ
rk !
Subject to: X s
z¼1
xjzkzþs$jk¼hxjk j2ID;
Xs
z¼1
xjzkzþs$jk¼xjk j2IND;
Xs
z¼1
yrzkz$sþrk¼yrk r¼1;2;. . .m;
kz;s$jk;sþrkþP0 z¼1;2;. . .;s:
ð5Þ
The software package DEA-Solver version 11 was used to estimate the DEA models presented in this paper.
5. Research framework and data selection
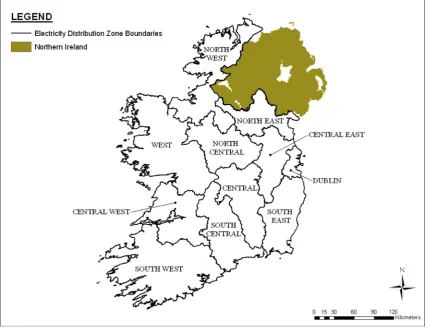
Ireland is 81,638 km2separated politically into the Republic of
Ireland (ROI) and Northern Ireland (NI). The island of Ireland con-sists of 32 counties,726 in the ROI and 6 in NI. These counties are
further divided into four provinces Leinster, Munster, Connaght and Ulster (see mapFig. 1). This paper utilizes a data set of 26 Elec-tricity Distribution Counties (EDCs) associated with ESB Networks
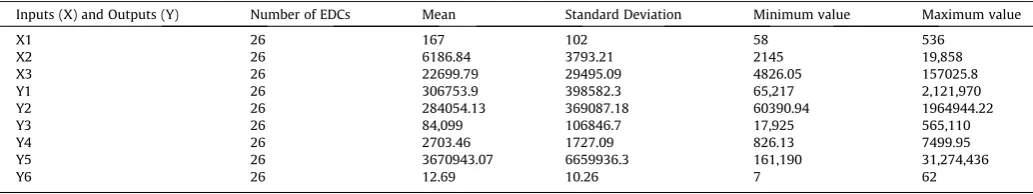
company in the ROI. Our empirical study analyses the technical effi-ciency of ESB Networks interconnected distribution system, each EDC responsible for medium and low voltage electricity distribution to a particular geographic region in the ROI (seeFig. 2andTable 1). Each EDC, autonomous region, or municipality is considered as a Decision Making Unit (DMU) under DEA analysis. The year under observation is 2008, the first full operational year of the All-Island Single Electricity Market (SEM). The use of annual data reduces the influence of seasonal effects. Five inputs and four outputs exten-sively used in similar studies that use DEA are employed in this study. The input and output variables adopted in this study are all expressed in physical units. Keeney and Raiffa[37]state a desir-able set of measurement factors should be complete, decompos-able, operational, non-redundant, and minimal. The adopted five model analysis incorporates internationally recognized variables judiciously to capture the essence of the electricity distribution process associated with ESB Networks. The database developed for DEA analysis in this study has been sourced predominately through collaborating and consultation with ESB Networks. Other sources of variable information include public sector databases SEAI, (2008), and central statistics database (CSO, Ireland). The def-inition and descriptive statistics of the variables adopted in the analysis are given inTables 2 and 3.
X1 Labour– This incorporates only the number of ESB Network
employees within each EDC irrespective of their status. It includes operation and maintenance, technical, non-technical as well as administrative employees.
X2 Distribution Network Length – This represents the 38 kV,
[image:4.595.89.514.67.396.2]Medium (MV) and Low Voltage (LV) distribution network mea-sured in (km) per EDC.
Fig. 1.Electricity Distribution Counties (EDCs) in the Republic of Ireland.
X3 Transformer Capacity– It is the total capacity of transformers connected to the distribution system for the distribution purpose. This is measured in MVA.
X4 Categorical Variable– Use of categorical variable (0,1) to
rep-resent whether EDC is composed of a city or urban centre.
Y1 Gross Energy Consumed– This represents the total energy
utilized or consumed within the EDC area. It is expressed in MWhs.
Y2 Net Energy Consumed– This is Y1 Gross Energy Consumed
less the distribution losses incurred within the area served by the EDC. Losses are included as a proxy for the technical quality of the grid or the service quality of the grid. It is expressed in MWhs.
Y3 Number of Customers– It is the total number of connection
points to supply the customers. Customers are not differentiated based upon their categories. The number of customers captures the number of nodes the utility must supply.
Y4 Service Area(km2) – The service area encapsulates the
geo-graphical differences among Electricity Distribution Counties. Both
the number of customers and the km2 of service area represent
customer area density. The service area is employed as an output variable to reflect the difficulty of meeting customer services over a less densely populated area.
Y5 Diagnostic Parameter– The industrial output per EDC
[image:5.595.78.506.69.398.2] [image:5.595.36.559.452.519.2]repre-sents the selling value of goods actually produced in the year, as Fig. 2.Electricity Distribution Zones (EDZs).
Table 1
Overview of the electricity sector market operators in the ROI and NI.
Market segment Republic of Ireland Regulator Northern Ireland Regulator
Owner Operator Owner Operator
Generation ESB and others ESB and others CER ESB and others ESB and others NIAUR
Transmission System ESB Eirgrid CER NIE SONI NIAUR
Distribution System ESB Networks ESB Networks Ltd CER NIE NIE NIAUR
Suppliers N/A Various CER N/A Various NIAUR
Table 2
Definition of variables: inputs (X) and outputs (Y).
Inputs (X) and Outputs (Y) Measurement
X1: Labour Numerical number
X2: Distribution Length Kilometre (km) X3: Transformer Capacity Megavolt ampere (MVA) X4: Categorical Variable [0,1]
Y1: Gross Energy Consumption Megawatt hour (MWh) Y2: Net Energy Consumption Megawatt hour (MWh)
Y3: No of Customers Numerical number
Y4: Service Area km2
Y5: Diagnostic Parameter (Industrial Output) Numerical number Y6: Environmental Variable (Customer Line
Density)
[image:5.595.32.285.561.674.2]reported by the business themselves, irrespective of whether sold or put into stock[9].
Y6 Environmental Variable– The customer line density defined
as the number of customers per (km) length of distribution network.
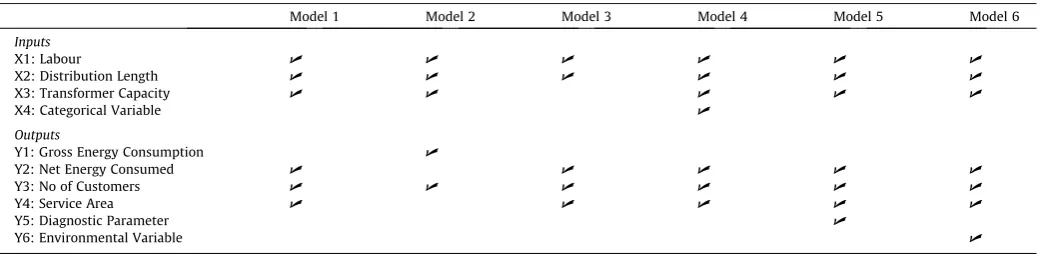
5.1. Model orientation
DEA efficiency analysis can be determined by adopting
input-minimizing or output-maximizing models.Input oriented model–
model whose objective is to minimize inputs while producing at
least the given output levels.Output oriented model– model that
attempts to maximize outputs while using no more than the observed amount of any input[19]. Traditionally, efficiency analy-ses in the electricity sector assume the output fixed in a market with the legal duty to serve all customers in a predefined service territory. Because EDCs are unable to control the amount of energy consumed (consumer demand) and the environmental factors, and because the researchers wanted to assess the technical efficiency of EDCs under the objective of minimizing the amount of resources utilized, input-oriented models were adopted.
5.1.1. Model 1 (Comprehensive)
This is the base model and all other models are a variation of the inputs and outputs employed. This model is designed to encapsu-late the overall variables impacting on the technical efficiency of electricity distribution in ROI. This is an extensive model including four inputs and three outputs. This model is an amalgamation of the first two models to represent the overall operational
character-istic of EDCs under analysis.Table 4 outlines the various models
employed in the analysis.
5.1.2. Model 2 (Basic Traditional)
From the extensive DEA literature, the choice of input/output variables for electricity distribution benchmarking needs to account for international experience and data availability. Jamasb
and Pollitt [34] review 20 benchmarking studies in terms of
electricity distribution efficiency establishing the number of
employees8 (labour), network length9 (capital) and transformer
capacity (peak load) the most frequently used input variables while output measures being energy delivered, and number of customers. There is no pre-defined set of variables to assess the performance of electricity distribution utilities and each study is case specific[29]. The basic model incorporates the above mentioned variables. Similar input/output combinations have been employed by Azadeh et al.
[1,2]and Sadjadi and Omrani[54].
5.1.3. Model 3 (Quality Service)
The inclusion of distribution losses as a proxy for the technical quality of the grid or the service quality of the grid establishes the quality of electricity distribution service offered within each EDC. Distribution losses are a source of inefficiency and are the difference between the electricity required and the electricity dis-tributed to end-users. These losses can be of technical and non-technical nature (measurement error and unmetered supplier). A reduction in costs to the consumer requires a reduction in both
forms of losses and contributes to a reduction in CO2 emissions
[52]. The Gross energy consumption less the distribution losses
gives Net energy consumption (MWh). The input/output combina-tions in model 3 have been successfully adopted by Ramos-Real et al.[52], Pacudan and De Guzman[48], Von Hirschhausen et al.
[61].
Discretionary models of DEA assume that all inputs and outputs are discretionary, i.e., controlled by the management of each DMU and varied at its discretion. In any realistic situation, however, there exists external exogenously fixed factors or non-discretion-ary inputs/outputs that are beyond the control of DMUs manage-ment that influences the performance of EDCs. The final two models attempt to acknowledge and account for these influential factors. EDCs may not be operating under equivalent environmen-tal conditions; that is certain EDCs may operate in a more favorable position in terms of population density, topography, geography, industrialized area.
5.1.4. Model 4 (Urban)
Adapted from Miliotis[43], a categorical variable is introduced to account for EDCs that contain an urban centre/city. Two groups are formed Urban Distribution Counties (UDC) that contain Irish cities and Rural Distribution Counties (RDC) that do not. Two DMU groups are formed one containing all 26 EDCs and from this group the DEA efficiency scores of UDCs containing a city are cal-culated; the second group excludes the UDCs containing a city leaving 21 RDCs. The DEA efficiency scores of the remaining RDCs without a city are calculated. This is equivalent to introducing a categorical variable[19].
5.1.5. Model 5 (Diagnostic)
[image:6.595.43.560.86.183.2]Given the nature of the Irish Electricity market and the vari-ance in usage across the country, a diagnostic parameter was chosen to highlight county differences. Non-discretionary models with traditional environmental variables such as inverse density index, customer and network density, and customer dispersion were employed with conflicting results. The industrial output variable was incorporated into Non-discretionary model to account for differences amongst EDCs in terms of electricity characteristics, geography. To the authors knowledge this vari-able has not been employed in DEA literature in a similar con-text to this research. This model incorporates all the variables in the comprehensive model whilst adding a non-discretionary Table 3
Descriptive statistic of variables of the EDCs.
Inputs (X) and Outputs (Y) Number of EDCs Mean Standard Deviation Minimum value Maximum value
X1 26 167 102 58 536
X2 26 6186.84 3793.21 2145 19,858
X3 26 22699.79 29495.09 4826.05 157025.8
Y1 26 306753.9 398582.3 65,217 2,121,970
Y2 26 284054.13 369087.18 60390.94 1964944.22
Y3 26 84,099 106846.7 17,925 565,110
Y4 26 2703.46 1727.09 826.13 7499.95
Y5 26 3670943.07 6659936.3 161,190 31,274,436
Y6 26 12.69 10.26 7 62
8 Using the number of employees imposes an implicit assumption that the aver-age number of working hours is similar across firms. Therefore, total hours worked may be a better measure for labor input. However, data availability required the use of this variable.
variable to measure each EDC Industrial output. This additional variable is in thousands of Euro and represents the selling value of goods produced within EDCs; as reported by the business themselves, it is thought this variable will represent the different geographical energy configuration across Electricity Distribution Counties (EDCs) of ESB Networks. These data were extracted
from a CSO10 (2008) survey entitled ‘‘Census of Industrial
Production’’.
5.1.6. Model 6 (Environmental)
This model includes non-discretionary models employing the traditional environmental variable customer density, to account for differences across EDCs. This model is similar to model 5 in terms of inputs/outputs employed differing only in the variable included to account for different electricity distribution character-istics across EDCs. A comparison with model 5 is therefore sought.
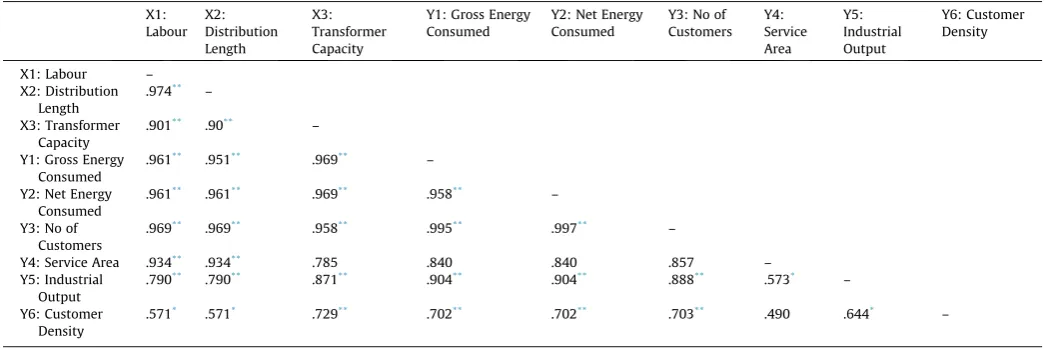
5.2. Correlation analysis of input and output variables
The relationship between inputs and outputs should be posi-tively correlated[42]. The correlation relationship between input and output variables is statistically verified using Pearson’s corre-lation. The greater the value of the correlation coefficient, the stronger the relationship between two variables is. The correlation coefficients from the input/output matrix are presented inTable 5. It can be concluded that there is a strong relationship between labour and distribution length with Pearson’s of 0.974; similarly the tables illustrate there is a weak relationship between labour and customer density 0.152. The assumption of an ‘‘isotonicity’’
relationship between input and output factors is satisfied [11].
That is, a requirement that the relationship between inputs and outputs not be erratic. Increasing the value of any input while keeping other factors constant should not decrease any output but should instead lead to an increase in the value of at least one
output. Dyson et al. [22] state this is achieved when increased
input reduces efficiency whilst increased output increases effi-ciency. Also, a desirable property of evaluation method is its dis-criminating power as a summary measure. Data selection and
model validation according to Boussofiane et al.[7] require that
the minimum number of DMU observations (EDCs) is equal to, or larger than, the product of the number of inputs and outputs. Coo-per et al.[18], Golany and Roll[30]also state the number of DMUs should be three times the sum of the input/output factors. All the models adopted, in this paper satisfy both of these conditions 26
EDCsP(3&4) or 3(3 + 4). Therefore the proposed DEA models are of high construct validity.
6. Empirical results and discussion
6.1. Model 1 (Comprehensive): Analysis and improvement directions for inefficient EDCs
The relative efficiency value of the CCR model is the overall ciency of the EDCs. If the efficiency value equals 1, the DMU is effi-cient; if it is less than 1, the evaluated EDC is inefficient[19]. The CCR model exhibits constant returns to scale assumption and mea-sures the overall efficiency for each unit, specifically by aggregat-ing pure technical efficiency and scale efficiency into one value. The BCC model with variable returns to scale relates to pure tech-nical efficiency accountable to management skills and establishes scale effects. These results are discussed in the next section. The dual linear programming formulations of the CCR and BCC models were run 26 times, i.e. one for each DMU or EDC. The results of CCR model analysis indicate that 21 EDCs are inefficient, with only 5 EDCs operating on the efficiency frontier (Westmeath, Offaly, Laois, Dublin, Leitrim).
[image:7.595.34.556.85.213.2]The average overall efficiency score of all the EDCs is 83%, with 14 EDCs scoring below this average value. This implies that the resource utilization of Electricity Distribution Counties is subopti-mal with considerable room for improvement. In order to identify, establish targets and indicate the improvement directions neces-sary for inefficient EDCs a slack analysis is employed to establish whether additional specific output amounts or a decrease in spe-cific input amounts leads to improvements in efficiency ratings. The input slack values represented inTable 6highlight the neces-sary reductions of the corresponding input factors to become tech-nically efficient generating units. It can be observed that slacks for efficient plants with an efficiency score of 100% are zero (Dublin). The potential for improvement of inefficient EDCs is also presented inTable 6. X1, X2, X3, Y2, Y3, Y4 show the potential improvements that are attainable by inefficient EDCs, if inputs and outputs are adapted accordingly. For example, the inefficient Sligo EDC can decrease employees (X1) by 5.27%, distribution length (X2) by 4.92%, transformer capacity (X3) by 4.92% and allow for an increase in energy consumption (Y1) of 19.26%. This means Sligo EDC is over utilizing its inputs at current levels and can be as efficient as its peer group. However, the differences between efficient and inefficient EDCs in terms of distributions losses are not significant. It is clear from the analysis that inefficient EDCs are predominantly associ-ated with medium and large sized service areas. The 5 efficient EDCs are all small sized service areas meaning that these small EDCs are more efficient at integrating their resources. The majority of EDCs present decreasing returns to scale characteristics. Table 4
Model specification and variables employed for analysis.
Model 1 Model 2 Model 3 Model 4 Model 5 Model 6
Inputs
X1: Labour U U U U U U
X2: Distribution Length U U U U U U
X3: Transformer Capacity U U U U U
X4: Categorical Variable U
Outputs
Y1: Gross Energy Consumption U
Y2: Net Energy Consumed U U U U U
Y3: No of Customers U U U U U U
Y4: Service Area U U U U U
Y5: Diagnostic Parameter U
Y6: Environmental Variable U
6.2. Technical and scale efficiency analysis
The BCC model was adopted to establish technical and scale efficiency of the Electricity Distribution Counties studied. These results indicate the sources of inefficiency amongst the EDCs. When interpreting the BCC scores or pure technical efficiency, the number of efficient EDC rises to 9 with the average pure tech-nical efficiency (PTE) of all the EDCs 91%. EDCs that have a scale efficiency score less than one are scale inefficient. A scale ineffi-cient EDC that exceeds the most productive scale size (MPSS) will present decreasing returns to scale. Alternatively, a scale inefficient EDC that is smaller than the most productive scale size will present increasing returns to scale. MPSS is the optimal operational perfor-mance of plants. The EDCs Westmeath, Offaly, Laois, Dublin, Lei-trim operate on both the CCR and BCC efficiency frontier displaying 100% efficiency, exhibiting constant returns to scale characteristics, and hence are Pareto–Koopmans efficient. Mayo, Galway, Cork, and Carlow, exhibit 100% BCC efficiency but a lower score in CCR, hence are operating locally efficiently but not overall efficiently due to the scale size. The first three EDCs are scale inef-ficient and should decrease the operation scales to improve overall efficiency as they present decreasing returns to scale with the exception of Carlow. Carlow should increase operational scales. Donegal, Monaghan, Clare, Longford, Louth, and Wicklow all have pure technical efficiency (PTE) scores greater than their corre-sponding scale efficiency scores. The EDCs of Monaghan, Longford and Louth should increase their operation scales as they exhibit increasing returns to scale to improve overall efficiency. Clare and Wicklow display decreasing returns to scale indicating these EDCs have considerable scope for improvements in their overall efficiency by resizing (decreasing) their scales of operation to the optimal scale MPSS. The remaining nine EDCs all display overall and local technical inefficiency, with a relatively high scale effi-ciency score. These EDCs could improve their technical effieffi-ciency by altering their resource allocation and utilization which would increase their overall efficiency score. Individual efficiency results suggest that the EDCs operating at the relatively more developed eastern part of Ireland have noticeably higher average relative effi-ciency scores, with performance of EDCs deteriorating towards rural and the western parts of Ireland. This would be due to increased population in Dublin’s surrounding EDCs with 40% of Ire-land’s population residing in the East region[10], resulting in a more densely populated distribution network.
6.3. Comparison and discussion of models
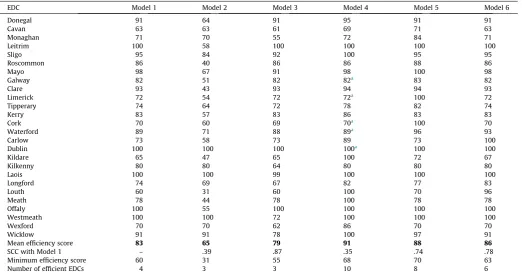
The six adopted models employ constant returns to scale tech-nologies to establish total technical efficiency (TTE) for each of EDCs under analysis. The numerical efficiency scores attained for the models are given inTable 7. The main study is the comprehen-sive model against which all other models are compared. Efficiency of each EDC is scored out of 100. The average efficiency of all the models is given. The spearman correlation coefficients are calcu-lated to establish and assess the impact of omitting/including cer-tain variables on the results obcer-tained from the comprehensive model. A spearman correlation coefficient of 100% illustrates the dropped variable(s) have no significant effect on the results obtained from the comprehensive model. The adoption of model 2 reflects the basic structural model for efficiency analysis of elec-tricity distribution utilities extensively used in the literature. The low correlation coefficient of 39% in relation to model 1 suggests omitting (I) distribution losses and (O) service area has a signifi-cant effect on the results. This trend of a very low correlation coef-ficient (35%) is also seen when comparing model 4 with model 1. This implies that establishing two DMU groups reflecting Rural Distribution Counties (RDCs) and Urban Distribution Counties (UDCs) has a significant effect on efficiency scores obtained. However, dropping the variable transformer capacity and includ-ing service area in the analysis have considerably less effect on the results, represented by the correlation coefficient of 87%. Comparing the spearman correlation coefficient results obtained for models 5 and 6, it can be seen that the inclusion of industrial output is statistically more significant (0.74) than the inclusion of the environmental variable customer density (0.78).
The inclusion of environmental and categorical variables to account for differences across EDCs has significant effects on effi-ciency scores. The descriptive statistics for the comprehensive model accounting for EDCs that contain an urban center (City)
are presented inTable 8. The comprehensive model was adopted
as the full sample of variables was sought for analysis. The total
comprehensive efficiency scores are given in Table 7 (model 1).
[image:8.595.41.564.86.261.2]The impact of including environmental categorical variable in model 4 greatly influences the efficiency scores RDCs. Comparing with model 1 average efficiency score increases from 83% to 91% with the number of efficient EDCs rising from 5 to 8. When observ-ing all 26 EDCs scale efficiency TTE is relatively low at 83% with scale efficiency being quite high at 91%. The UDC mean scale Table 5
Correlation coefficient between input and output variables.
X1: Labour
X2: Distribution Length
X3: Transformer Capacity
Y1: Gross Energy Consumed
Y2: Net Energy Consumed
Y3: No of Customers
Y4: Service Area
Y5: Industrial Output
Y6: Customer Density
X1: Labour – X2: Distribution
Length
.974** –
X3: Transformer Capacity
.901** .90** –
Y1: Gross Energy Consumed
.961** .951** .969** –
Y2: Net Energy Consumed .961
** .961** .969** .958** –
Y3: No of Customers
.969** .969** .958** .995** .997** –
Y4: Service Area .934** .934** .785 .840 .840 .857 –
Y5: Industrial Output
.790** .790** .871** .904** .904** .888** .573* –
Y6: Customer
Density .571
* .571* .729** .702** .702** .703** .490 .644* –
efficiency is quite close to this at 89% with RDCs scoring a little higher at 94%. When two DMU groups are formed relating to rural and urban electricity distribution centers, it is the former that
[image:9.595.35.556.138.403.2]outperforms the latter in terms of total, pure technical and scale efficiency. Similarly the inclusion of a non-discretionary environ-mental variable in model five increases efficiency for all EDCs with
Table 6
Individual efficiency scores of EDCs and returns to scale: Model 1.
EDC county regions TTE PTE TTE/PTE RTS % % % % % %
X1 X2 X3 Y2 Y3 Y
Donegal 91 99 91 DRS $9.04 $9.04 $9.04 21.06 0 0
Cavan 63 67 94 DRS $37.01 $37.04 $37.01 0 0 1.9
Monaghan 71 96 74 IRS $28.58 28.71 $28.58 41.31 0 0
Leitrim 100 100 100 CRS 0 0 0 0 0 0
Sligo 95 96 99 DRS $5.27 $4.92 $4.92 19.26 0 0
Roscommon 86 90 96 DRS $14.25 $14.18 $47.40 0 5.71 0
Mayo 98 100 98 DRS $1.68 $1.81 $1.68 58.46 32.7 0
Galway 82 100 82 DRS $18 $18.03 $33.86 1.35 0 0
Clare 93 99 94 DRS $7.13 $7.27 $47.75 4.89 0 0
Limerick 72 76 92 DRS $27.53 $27.63 $35.28 0 0 0
Tipperary 74 84 88 DRS $26.07 $26.07 $26.07 17.25 0 0
Kerry 83 90 92 DRS $16.79 17.05 18.14 20.13 0 0
Cork 70 100 70 DRS $30.05 $30.15 30.05 7.21 0 0
Waterford 89 90 98 DRS $11.72 $11.49 $11.49 5.14 0 0
Carlow 73 100 73 IRS $26.82 $26.81 $26.81 0 2.89 0
Dublin 100 100 100 CRS 0 0 0 0 0 0
Kildare 65 65 100 DRS $34.75 $34.75 $43.02 4.83 0 0
Kilkenny 80 87 92 DRS $20.33 $20.13 $20.13 0 5.88 3.5
Laois 100 100 100 CRS 0 0 0 0 0 0
Longford 74 96 77 IRS $25.95 $25.95 $25.95 41.04 0 0
Louth 60 80 75 IRS $39.70 39.84 $69.12 14.14 0 0
Meath 78 81 96 DRS $21.52 $21.73 $52.07 33.99 0 0
Offaly 100 100 100 CRS 0.29 0 $33.27 6.30 0 0
Westmeath 100 100 100 CRS 0 0 0 0.81 0 0
Wexford 70 78 90 DRS $29.81 $29.65 $29.65 0.81 0 0
Wicklow 91 99 91 DRS $8.93 $9.11 $8.93 0 13 20.3
Average 83 91 91 0 0
Total technical efficiency (TTE); pure technical efficiency (PTE); scale efficiency (TTE/PTE); (RTS) returns to scale; X1: Labour; X2: Distribution Length; X3: Transformer Capacity; X4: Distribution Losses; Y1: Energy Consumed; Y2: No of Customers; Y3: Service Area.
Table 7
Efficiency scores of all models adopted.
EDC Model 1 Model 2 Model 3 Model 4 Model 5 Model 6
Donegal 91 64 91 95 91 91
Cavan 63 63 61 69 71 63
Monaghan 71 70 55 72 84 71
Leitrim 100 58 100 100 100 100
Sligo 95 84 92 100 95 95
Roscommon 86 40 86 86 88 86
Mayo 98 67 91 98 100 98
Galway 82 51 82 82a 83 82
Clare 93 43 93 94 94 93
Limerick 72 54 72 72a 100 72
Tipperary 74 64 72 78 82 74
Kerry 83 57 83 86 83 83
Cork 70 60 69 70a 100 70
Waterford 89 71 88 89a 96 93
Carlow 73 58 73 89 73 100
Dublin 100 100 100 100a 100 100
Kildare 65 47 65 100 72 67
Kilkenny 80 80 64 80 80 80
Laois 100 100 99 100 100 100
Longford 74 69 67 82 77 83
Louth 60 31 60 100 70 96
Meath 78 44 78 100 78 78
Offaly 100 55 100 100 100 100
Westmeath 100 100 72 100 100 100
Wexford 70 70 62 86 70 70
Wicklow 91 91 78 100 97 91
Mean efficiency score 83 65 79 91 88 86
SCC with Model 1 – .39 .87 .35 .74 .78
Minimum efficiency score 60 31 55 68 70 63
Number of efficient EDCs 4 3 3 10 8 6
[image:9.595.34.557.466.742.2]UDCs greatly influenced (Cork, Limerick, Waterford and Galway). Comparing model 5 with model 1 in terms of average efficiency score increases from 83% to 88% with the number of efficient EDCs rising from 4 to 10. This is intuitively what one would expect with UDCs producing greater industrial output than RDCs. All EDCs see an increase in efficiency. Non-discretionary models employing the traditional environmental variables inverse density, customer den-sity and customer dispersion were pursued. The model incorporat-ing the customer density variable was most significant. A direct comparison can therefore be made with our constructed diagnostic model employing non-discretionary industrial output (model 5) in place of the traditional environmental variable customer density (model 6). In terms of average overall efficiency model 5 returns a higher efficiency of 88% as opposed to model 6 with 86%. Also the number of efficient EDCs in model 5 is 8, this falls to 5 when observing model 6 inTable 7. All EDCs obtain a higher efficiency score in diagnostic model 5 when compared with the environmen-tal model 6. The diagnostic parameter industrial output has more explanatory power when attempting to account for differing electricity distribution characteristics across EDCs when compared with traditional environmental variables that have been exten-sively adopted in the DEA literature.
6.4. Efficiency improvement through reorganization of EDCs
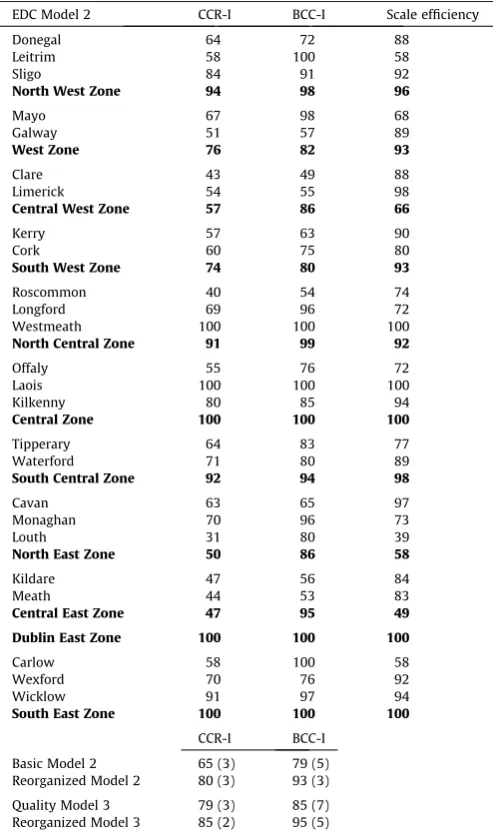
In this study, we investigated possible reorganization alterna-tives to reduce the number of EDCs, to improve resource utilization and to promote efficiency. Reorganization and operational mergers are feasible methods to increase efficiency. Thus, the objective of EDC reorganization was focused on improving overall efficiency. Based on geographical convenience, a restructuring and amalgam-ation of the current 26 EDCs within ESB Networks distribution framework have been hypothesized. Ireland with its relatively small size, sparse population and installed capacity would benefit from the aggregation of the 26 EDCs to 11 more efficient and man-ageable Electricity Distribution Zones (EDZs). This would also greatly reduce duplication of services between EDCs. Due to geo-graphical limitations, only adjacent EDCs are combined to form EDZs. To examine the reorganization alternatives, the CCR and BCC models were applied to establish total technical efficiency (TTE) and pure technical efficiency (PTE) along with scale efficiency (SE). Due to the reduction in number of DMUs employed compar-isons are only made with the original basic and quality models (2 and 3) These models have been extensively adopted in the literature. The results of the restructuring are displayed inTable 9. For example EDCs Offaly, Laois and Kilkenny can combine to form the Central Electricity Distribution Zone.
[image:10.595.314.561.86.505.2]In terms of the basic model in both cases, the efficiency results obtained are significantly higher after TTE increasing 15% from 65% to 80% whilst PTE efficiency increased 14% from 79% to 93% after
Table 8
Descriptive statistics of EDCs divided into categories of RDCs and UDCs.
Model 1 Number of EDCs Mean efficiency score Standard Deviation Minimum value Maximum value No of efficient EDCs All EDCs
TTE 26 0.83 0.126 0.60 100 4
PTE 26 0.91 0.106 0.65 100 9
SE 26 0.91 100 6
RDCs
TTE 21 0.91 0.099 0.69 100 9
PTE 21 0.96 0.068 0.71 100 14
SE 21 0.94 100 9
UDCs
TTE 5 0.83 0.126 0.72 100 1
PTE 5 0.93 0.175 0.76 100 3
SE 5 0.88 100 1
[image:10.595.41.567.613.742.2]SE = TTE/PTE; EDCs – Electricity Distribution Counties; RDCs – Rural Distribution Counties; UDCs – Urban Distribution Counties.
Table 9
Reorganization of EDCs into EDZs to improve efficiency.
EDC Model 2 CCR-I BCC-I Scale efficiency
Donegal 64 72 88
Leitrim 58 100 58
Sligo 84 91 92
North West Zone 94 98 96
Mayo 67 98 68
Galway 51 57 89
West Zone 76 82 93
Clare 43 49 88
Limerick 54 55 98
Central West Zone 57 86 66
Kerry 57 63 90
Cork 60 75 80
South West Zone 74 80 93
Roscommon 40 54 74
Longford 69 96 72
Westmeath 100 100 100
North Central Zone 91 99 92
Offaly 55 76 72
Laois 100 100 100
Kilkenny 80 85 94
Central Zone 100 100 100
Tipperary 64 83 77
Waterford 71 80 89
South Central Zone 92 94 98
Cavan 63 65 97
Monaghan 70 96 73
Louth 31 80 39
North East Zone 50 86 58
Kildare 47 56 84
Meath 44 53 83
Central East Zone 47 95 49
Dublin East Zone 100 100 100
Carlow 58 100 58
Wexford 70 76 92
Wicklow 91 97 94
South East Zone 100 100 100
CCR-I BCC-I Basic Model 2 65 (3) 79 (5) Reorganized Model 2 80 (3) 93 (3) Quality Model 3 79 (3) 85 (7) Reorganized Model 3 85 (2) 95 (5)
reorganization of EDCs. A similar trend is observed when compar-ing the quality model where both the TTE and PTE scores were higher after restructuring than before. TTE increases by 6% to 85% and PTE increases by 10% to 95%. When observing all eight models under constant and variables returns to scale, comparing pre and post electricity distribution restructuring, little variation is shown amongst the number of efficient DMUs but efficiency is gained when employing the Electricity Distribution Zones concept for distribution.
7. Conclusions
This study has extended the literature on efficiency analysis to the electricity distribution sector in the Republic of Ireland. The employment of the Irish electricity distribution system and Elec-tricity Distribution Counties (EDCs) as the main research focus has never been done. The paper provides a DEA framework to mea-sure technical efficiency, to establish whether empirical efficiency gains were possible, and to investigate the reorganization of the electricity distribution network for efficiency gains. The paper has explored the efficiency and benchmarks of the EDCs from a comprehensive viewpoint with the employment of five differing models to capture the characteristics of EDCs. Analysis, discussion and presentation of key findings comparing all five models are pre-sented. External factors that are not controllable by EDCs can inhi-bit efficiency. This was accounted for by adopting a categorical variable to account for urban/rural environments and a diagnostic parameter to account for differing electricity distribution charac-teristics across EDCs, and comparisons were made with employing traditional environmental variables. The adoption of the diagnostic parameter proves to be a superior variable. The proposed reorgani-zation alternative of employed Electricity Distribution Zones (EDZs) achieved higher efficiency scores of up to 10%. The results of this paper can assist ESB Networks to improve the operational management of EDCs. Also, this empirical analysis can provide use-ful information to the policy makers responsible for electricity dis-tribution regulation under changing market regimes. The DEA benchmark approach employed here offers an alternative form of electricity distribution regulation open to the Commission for Energy Regulation (CER) in Ireland as opposed to the status quo of OPEX and CAPEX regulation. This alternative approach can be adopted by other countries with similar electricity distribution environments.
Acknowledgements
The authors wish to thank and appreciate the generous contri-butions from Electricity Supply Board (ESB) Networks in relation to data sourcing, guidance and advice in particular Kevin Niall ESB Network Strategy Manager.
References
[1]Azadeh A, Ghaderi SF, Omrani H, Eivazy H. An integrated DEA-COLS-SFA
algorithm for optimization and policy making of electricity distribution units.
Energy Policy 2009;37:2605–18.
[2]Azadeh A, Ghaderi SF, Omrani H. A deterministic approach for performance
assessment and optimisation of distribution units in Iran. Energy Policy
2009;37:274–80.
[3]Bagdadioglu N, Price CW, Weyman-Jones TG. Efficiency and ownership in
Turkish distribution: a non-parametric model of the Turkish experience.
Energy Econ 1996;18:1–23.
[4]Banker RD, Charnes A, Cooper WW. Some models for estimating technical and
scale inefficiencies in DEA. Manage Sci 1984;30:1078–92.
[5]Banker RD, Morey RC. The use of categorical variables in data envelopment
analysis. Manage Sci 1986;35:1613–27.
[6]Bevilacqua M, Braglia M. Environmental efficiency analysis for ENI oil
refineries. J Clean Prod 2002;10:85–92.
[7]Boussofiane A, Dyson RG, Thanassoulis E. Applied data envelopment analysis.
Eur J Oper Res 1991;52:1–15.
[8]Caulfield B, Bailey D, Mullarkey S. Using data envelopment analysis as a public
transport project appraisal tool. Transp Policy 2013;29:74–85.
[9] Central Statistics Office (CSO) Census of Industrial Production (CIP). Dublin, Ireland; 2008.
[10] Central Statistics Office (CSO) Census on Population 2011. 2011 Preliminary results. Dublin, Ireland; 2011.
[11]Charnes A, Clark T, Cooper WW, Golany B. A development study of data
envelopment analysis in measuring the efficiency of maintenance units in the
US Air Force. Ann Oper Res 1985;2:95–112.
[12]Charnes A, Cooper WW, Rhodes E. Measuring the efficiency of decision-making
units. Eur J Oper Res 1978;2:429–44.
[13]Chen T. An assessment of technical efficiency and cross-efficiency in Taiwan’s
electricity distribution sector. Eur J Oper Res 2002;137:421–33.
[14]Chien CF, Lo FY, Lin JT. Using DEA to measure the relative efficiency of the
service centre and improve operation efficiency through reorganisation. IEEE
Trans Power Syst 2003;18:366–433.
[15] Commission for Energy Regulation (CER). Fuel mix and CO2 emissions disclosure 2009. Dublin, Ireland; 2009.
[16]Conlon P. The integration of electricity markets in Ireland under the ISO
model. Dublin, Ireland: Electricity Supply Board (ESB) International; 2010.
[17]Cook WD, Seiford LM. Data envelopment analysis (DEA) – thirty years on. Eur J
Oper Res 2009;192:1–17.
[18]Cooper WW, Li S, Seiford M, Tone K, Thrall RM, Zhu J. Sensitivity and stability
analysis in DEA: some recent development. J Prod Anal 2001;16:31–47.
[19]Cooper WW, Seiford LM, Tone K. Data envelopment analysis: a comprehensive
text with models, applications, references and DEA-solver software. 2nd
ed. New York: Springer; 2007.
[20]de Souza MVP, Souza RC, Pessanha JFM, da Costa Oliveria CH, Diallo M. An
application of data envelopment analysis to evaluate the efficiency level of the operational cost of Brazilian electricity distribution utilities. Socio-Econ Plan
Sci 2014;48(3):169–74.
[21] Doraisamy SM. Benchmarking the performance of UK electricity distribution network operators: a study of quality, efficiency and productivity using data envelopment analysis. PhD thesis, University of Warwick; 2004.
[22]Dyson RG, Allen R, Camanho AS, Podinovski VV, Sarrico CS, Shale EA. Pitfalls
and protocols in DEA. Eur J Oper Res 2001;132:245–59.
[23] Electricity Supply Board. HV Network Investment Plan – National: 2009–2019. Dublin, Ireland; 2009.
[24]Emrouznejad A, Parker BR, Tavares G. Evaluation of research in efficiency and
productivity: a survey and analysis of the first 30 years of scholarly literature
in DEA. Socio-Econ Plan Sci 2008;42:151–7.
[25]Estache A, Rossi M, Ruzzier C. The case for international coordination of
electricity regulation: Evidence from the measurement of efficiency in South
America. J Regul Econ 2004;25:271–95.
[26]Fare R, Grosskopf S, Logan J. The relative efficiency of Illinois electric utilities.
Resour Energy 1983;1983(5):349–67.
[27]Farrell MJ. The measurement of productive efficiency. J R Stat Soc Ser A: Gen
1957;120:253–90.
[28] Farsi M, Fetz A, Filippini M. Benchmarking and regulation in the electricity distribution sector. Centre for Energy Policy and Economics (CEPE) Working Paper, no. 54; 2007.
[29] Giannakis D, Jamasb T, Pollitt M. Benchmarking and incentive regulation of quality of service: an application to the UK electricity distribution utilities. Cambridge Working Papers in Economics. CWPE 0408; 2005.
[30]Golany B, Roll Y. An application procedure for DEA. OMEGA 1989;17:237–50.
[31]Groenendijk W. Unbundling under the third energy package. University of
Utrecht; 2009.
[32]Hjalmarrson L, Veiderpass A. Efficiency and ownership in Swedish electricity
retail distribution. J Prod Anal 1992;3:7–23.
[33]Jamasb T, Pollitt M. Benchmarking and regulation: international electricity
experience. Util Policy 2001;9:107–30.
[34]Jamasb T, Pollitt M. International benchmarking and regulation: an application
to European electricity distribution utilities. Energy Policy 2003;31:1609–22.
[35]Jha DK, Yorino N, Karki NJ. Evaluating performance of electricity distribution
centres and improving relative operational efficiencies through
reorganisation: a case of Nepal. Int J Emerg Electr Power Syst 2011;12:2.
[36]Joskow PL. Lessons learned from electricity market liberalization. Energy J Spec
Iss 2008:9–42.
[37]Keeney R, Raiffa H. Decisions with multiple objectives: preferences and value
trade-offs. New York, NY: Cambridge University Press; 1993.
[38]Kumbhakar SC, Hjalmarsson L. Relative performance of public and private
ownership under yardstick competition: electricity retail distribution. Eur
Econ Rev 1998;42:97–122.
[39]Kheirkhah A, Azadeh A, Saberi M, Azaron A, Shakouri H. Improved estimation
of electricity demand function by using of artificial neural network, principal component analysis and data envelopment analysis. Comput Ind Eng
2013;64(1):425–41.
[40]Liu X, Wen Z. Best available techniques and pollution control: a case study on
China’s thermal power industry. J Clean Prod 2012;23:113–21.
[41]Lo FY, Chien CF, Lin JT. A DEA study to evaluate the relative efficiency and
investigate the district reorganisation of the Taiwan Power Company. IEEE
Trans Power Syst 2001;2:55–6.
[42]Luo X, Donthu N. Benchmarking advertising efficiency. J Adv Res
[43]Miliotis PA. Data envelopment analysis applied to electricity distribution
districts. J Oper Res Soc 1992;43:549–55.
[44]Murillo-Zamorano LR. Economic efficiency and frontier techniques. J Econ Surv
2004;18:33–45.
[45] Nepal R, Jamasb T. Market integration, efficiency, and interconnectors: the Irish single electricity market. Electricity Policy Research Group (EPRG) Working Paper 1121; 2011.
[46]Omrani H, Beiragh RG, Kaleibari SS. Performance assessment of Iranian
electricity distribution companies by an integrated cooperative game data envelopment analysis principal component analysis approach. Int J Electr
Power Energy Syst 2015;64:617–25.
[47]Önüt S, Soner S. Analysis of energy use and efficiency in Turkish manufacturing
sector SMEs. Energy Convers Manage 2007;48:384–94.
[48]Pacudan R, De Guzman E. Impact of energy efficiency policy to productive
efficiency of electricity distribution industry in the Philippines. Energy Econ
2002;24:41–54.
[49]Pahwa A, Feng X, Lubkeman D. Performance evaluation of electric distribution
utilities based on data envelopment analysis. IEEE Trans Power Syst
2003;18(1):400–5.
[50]Pollitt M. Ownership and performance in electric utilities: the international
evidence on privatisation and efficiency. Oxford: Oxford University Press; 1995.
[51]Ramanathan R. An analysis of energy consumption and carbon dioxide
emissions in countries of the Middle East and North Africa. Energy
2005;30:2831–41.
[52]Ramos-Real FJ, Tovar B, Iootty M, Almeida EF, Pinto JHQ. The evolution and
main determinants of productivity in Brazilian electricity distribution 1998–
2005, an empirical analysis. Energy Econ 2009;31:298–305.
[53]Reyes RP, Tovar B. Measuring efficiency and productivity change (PTF) in the
Peruvian electricity distribution companies after reforms. Energy Policy
2009;37:2249–61.
[54]Sadjadi SJ, Omrani H. Data envelopment with uncertain data: an application
for Iranian electricity distribution companies. Energy Policy 2008;36:4247–54.
[55]Santos SP, Amado CAF, Rosado JR. Formative evaluation of electricity distribution utilities using data envelopment analysis. J Oper Res Soc 2010;62(1):1–22.
[56]Sarkis J, Weinrach J. Using data envelopment analysis to evaluate
environmentally conscious waste treatment technology. J Clean Prod
2001;9:417–27.
[57]Simões P, Cruz NF, Marques RC. The performance of private partners in the
waste sector. J Clean Prod 2012;29:214–21.
[58]Thakur T, Deshmukh SG, Kaushik SC. Efficiency evaluation of the state owned
electric utilities in India. Energy Policy 2006;34:2788–804.
[59] Trevino L. Liberalisation of the electricity market in Europe: an overview of the electricity technology and the market place. MIR-Working Paper-2008-002; 2008.
[60]Vázquez-Rowe I, Villanueva-Rey P, Iribarren D, Moreira T, Feijoo G. Joint life cycle assessment and data envelopment analysis of grape production for vinification in the Rias Baixas appellation (NW Spain). J Clean Prod 2012;27:92–102.
[61]Von Hirschhausen C, Cullmann A, Kappeler A. Efficiency analysis of German
electricity distribution utilities – non-parametric and parametric tests. Appl
Econ 2006;38:2553–66.
[62]Walsh A. ESB tackles system renewal transmission and distribution
world. Dublin, Ireland: ESB Networks; 2006.
[63]Weyman-Jones TG. Productivity efficiency in a regulated industry: the area
electricity boards of England and Wales. Energy Econ 1991;13:116–22.
[64]Weyman-Jones TG. Problems of yardstick regulation in electricity distribution.
In: Bishop M, Kay J, Mayer C, editors. The regulatory challenge. Oxford: Oxford
University Press; 1995. p. 423–43.
[65]Yang C, Lu WM. Assessing the performance and finding benchmarks of the
electricity distribution districts of Taiwan Power Company. IEEE Trans Power
Syst 2006;21:853–61.
[66]Zhou G, Chung W, Zhang Y. Measuring energy efficiency performance of
China’s transport sector: a data envelopment analysis approach. Expert Syst
Appl 2014;41(2):709–22.
[67]Zhou P, Ang BW, Poh KL. A survey of data envelopment analysis in energy and