Original Article
Expression and clinical value of
multidrug resistance-associated proteins
(MRP) 1 to 6 in Chinese pediatric patients
with B-precursor acute lymphoblastic leukemia
Jin Yang1, Bao-Ling Qiu1, Chen-Yan Zhou1, Qi Zhou1, Jian-Qin Li1, Jian Pan1, Wei-Ying Gu2, Xiao-Fei Qi3,
Rui-Hua Chen3, Yi-Na Niu4, CS Chen5, Shao-Yan Hu1
1Department of Hematology & Oncology, Children’s Hospital of Soochow University, Suzhou, Jiangsu, China; 2The
First People’s Hospital of Changzhou, Third Affiliated Hospital of Suzhou University, Changzhou, Jiangsu, China;
3The First Affiliated Hospital of Soochow University, Suzhou, Jiangsu, China; 4Xinxiang Medical University, Xinxiang, Henan, China; 5Loma Linda University, CA 92354, USA
Received November 21, 2016; Accepted November 27, 2016; Epub February 1, 2017; Published February 15, 2017
Abstract: In this study we detected the expression pattern of MRP1-6 in126 newly diagnosed B-precursor ALL (BP-ALL) children by real-time RT-PCR in China. We found that all 6 members of MRPs were expressed with a distinct pat-tern: MRP1 showed close relation with WBC counts, treatment response, and relapse; Higher expression of MRP2 in the TEL/AML1 positive group; MRP5 and MRP6 expressed lower in E2A/PBX1 positive group; High expression of MRP1, 5, 6 showed a close relation with poor response to the treatment; MRP1 and MRP6 expressed higher in relapse stage. Furthermore, each member expression alone didn’t show any impact on the relapse-free survival in BP-ALL. However, when MRP1 was combined with other MRP members such as MRP5 or MRP6, the patient cohort could be stratified into 4 subgroups with relapse. Patients with high MRP1and low MRP5 or 6 had the most favor-able relapse-free survival. Our study illustrated a new pattern of MRPs related to relapse-free survival.
Keywords: Multidrug resistance-associated protein family members, acute lymphoblastic leukemia, B-precursor, relapse-free survival
Introduction
Acute lymphoblastic leukemia (ALL) is the most frequent malignancy in childhood. With the advancement of modern antileukemic agents and improved supportive care in contemporary clinical trials, the 5-year survival rate of child-hood ALL has been incrementally improved in both developing and developed countries [1-4]. However, some patients still fail to respond to therapy and others relapse with resistant dis-ease. Drug resistance remains a leading cause of death in pediatric ALL.
Several mechanisms of drug resistance were
identified, of which ATP binding-cassette (ABC)
transporters was mainly involved in chemosen-sitivity [5-11]. The superfamily of ABC trans-porters mainly consists of the multidrug
resis-protein (BCRP), and the family of multidrug re- sistance-associated proteins (MRPs). Current-
ly, nine MRP genes have been identified, of
which the MRP transporters (MRP1-6) are
known to be involved in the effleux of chemo -theraputic agents that are generally used in the treatment of ALL, including doxorubicin, vincris-tine, etoposide, 6-mercaptopurine, and metho-trexate [12-15]. Although MRP family shares strong similarity on structure, function and
sub-strate specificity, the reports on their clinical
relevance in ALL are still controversial. The expression of MRP1 has been studied in larger groups of ALL patients and failed to show as- sociation with response to chemotherapy [9]. Higher levels of MRP3 were found in patients with a poor in vivo response to prednisone, but
this could not be confirmed by an
of expression of all MRP genes, except MRP4 which indicated that high MRPs expression cor-relate with an unfavorable prognosis indepen-dently of age [17].
In view of the strong overlapping functions of the members of MRPs, the aim of this study is to investigate the correlation of mRNA expres-sion of all six relevant MRP genes (MRP1-6) with the clinical feature, cytogenetic abnormal-ity, and clinical outcome in childhood ALL treat-ed under Cooperative Study Protocol (CCLG-ALL 2008) in China.
Materials and methods
Patients
During the period of January 2012 to April. 2013, 126 patients newly diagnosed B-pre- cursor ALL (BP-ALL) were enrolled to the study at the Children’s Hospital of Soochow Univer- sity. Follow-up time ended in May 2015. T-cell ALL and mature ALL were excluded from analy-sis because of their unique leukemia biology, associated risk characteristics, and treated under different protocols as well. Patients with
BP-ALL were classified as standard-risk ALL
(SR-ALL), intermediate-risk ALL (IR), and high-risk ALL (HR-ALL) and were treated according to the protocol from Chinese Children Leuke-
mia Group (CCLG-2008) risk-stratified ALL regi -mens [18]. The study was reviewed and ap- proved by the Institutional Review Board, and was conducted in accordance with the De- claration of Helsinki.
Analysis of minimal residual disease (MRD)
MRD was obtained during the study period from end-of-induction bone marrow specimens and was were analyzed with a six-laser FACS
Calibur flow cytometer with CellQuest and
CellQuestPro software (BD Biosciences, San Jose, CA) and were performed according to the established protocol [19-22]. MRD was ana-lyzed either as continuous variable or as
posi-tive or negaposi-tive (defined by using a threshold
of 0.01% residual leukemia blasts) as estab-lished from previous large cohorts in pediatric ALL [23].
Definition
Relapse was defined as very early relapse (VER, less than 18 months from the first induction
therapy), early relapse (ER, 18 months or more
after first diagnosis and less than 6 months
from stopping therapy), and late relapse (LR, 6 months or more after stopping therapy), respectively [24]. Complete remission (CR) was
defined as <5% leukemic blasts in bone mar -row, absence of blasts in peripheral blood,
and absence of leukemic blasts in spinal fluid
or other extramedullary sites. Central nervous
system (CNS) disease at diagnosis was defined by a WBC count of greater than 5 cells/μL with identifiable blasts in the cerebral spinal fluid
(CSF) or by a pathological mass detected by cranial computed tomography, with or without CSF pleocytosis. The presence of more than
1000 blasts/μL peripheral blood blasts on day 8 after prednisone treatment was defined as
prednisone poor responder (PPR) [25].
Sample collection and RNA isolation and qRT-PCR
Mononuclear cells from bone marrow were iso-lated on Ficoll-Isopaque (Nycomed, Oslo, Nor- way) density gradient by centrifugation. The cells concentration at 2×10⁶/ml was
cryopre-served in RPMI 1640 supplemented with 10% FCS and 10% DMSO (Merck, Amsterdam, the Netherlands) and stored in liquid nitrogen. The median percentage of blasts in patient material was 80%±20% (mean ± SD). Total cellular RNA was isolated from ALL blasts using RNeasy Mini Kit including DNase digestion (Qiagen, Hilden, Germany). From some samples total cellular RNA was extracted using 1 mL of Trizol rea- gent (Life Technologies, Breda, Netherlands). The amount of RNA was measured by photo- metry. Subsequently, 1 microgram RNA was re- verse transcribed in 20 microliter reverse tran-scriptase buffer containing 10 mmol/L DTT, 0.5 mmol/L each of dATP, dGTP, dCTP, and dTTP, 200 units of Moloney murine leukemia virus reverse transcriptase, 5 units of RNase inhibi-tor, and 10 ng/microliter random primers (MBI Fermentas, St. Leon-Rot, Germany).
Quantitative RT-PCR (qRT-PCR) was performed using the ABI Prism 7700 Sequence Detector (Applied Biosystems, Foster City, CA). Primers for the MRPs and b-actin and products were
amplified based on the protocol previously
de-scribed [26].
The expression of the MRP genes was
ed for 15.87% (20/126) of patients. MRD data were available in 109 cases during this study.
Eight patients were VER, and 4 patients were
ER, no LR at cut off data of data collection (May The expression of each gene in each sample
[image:3.612.91.355.85.297.2]was analyzed in duplicates. Meanwhile, sam-ples from 20 cases without leukemia were used as control.
Table 1. Initial patient data
No.
Number of patients 126
Median age (mean ± SD), y (range) 5.8±3.6
Sex, male/female 62/64
Median WBC, 109/L (range) 26.8 (0.54-638)
Median percentage of leukemic cells, WBC (range) 26.8 (0.54-638)
Median HB, g/L (range) 79 (46-160)
Median PLT count, ×109/L (range) 71 (9-375)
Bone marrow blast, % 89 (41-98)
Peripheral Blood blast, % 72 (0-95)
TEL/AML1, yes/no 36/90
E2A/PBX1, yes/no 12/114
BCR/ABL, yes/no 4/122
MLL related 12/114
Response to prednisone, good†/poor‡ 20/106
Relapse, VER/ER/no 8/4/114
†Less than 109 leukemic cells/L on day 8. ‡More than 109 leukemic cells/L on day 8.
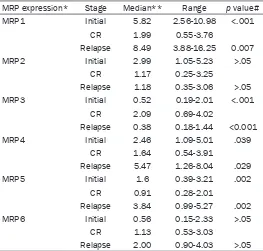
Table 2. MRPs expression at different stage of BP-ALL
MRP expression* Stage Median** Range p value#
MRP1 Initial 5.82 2.56-10.98 <.001
CR 1.99 0.55-3.76
Relapse 8.49 3.88-16.25 0.007
MRP2 Initial 2.99 1.05-5.23 >.05
CR 1.17 0.25-3.25
Relapse 1.18 0.35-3.06 >.05
MRP3 Initial 0.52 0.19-2.01 <.001
CR 2.09 0.69-4.02
Relapse 0.38 0.18-1.44 <0.001
MRP4 Initial 2.46 1.09-5.01 .039
CR 1.64 0.54-3.91
Relapse 5.47 1.26-8.04 .029
MRP5 Initial 1.6 0.39-3.21 .002
CR 0.91 0.28-2.01
Relapse 3.84 0.99-5.27 .002
MRP6 Initial 0.56 0.15-2.33 >.05
CR 1.13 0.53-3.03
Relapse 2.00 0.90-4.03 >.05
NOTE: *The relative expression of MRPs was calculated by 2-ΔΔCt, namely, ΔCT (MRP1-6)=CT (MRP1-6)-CT (β-actin gene), ΔΔCt=ΔCT (MRP1-6) of patients -ΔCT (MRP1-6) of control. **The values are given as median (25th-75th
percentile). #Compared with CR.
Statistical analysis
Because the levels of MRP expre- ssion were not evenly distribu- ted, nonparametric methods were used. The Mann Whitney U test was done to compare MRP ex- pression between two groups. For more than two groups, the Krus- kal-Wallis test was employed. With the Spearman rank test, the cor- relation between MRP expression and other continuous variables was determined. Life-table esti-mates were employed to analyze double genes effects on relapse and Chi-square was run to com-pare subgroups’ differences. Me- dian values (the 50th percentile)
were used as cutoffs for high ver-sus low MRP expression. All P val-ues are given for two-sided tests and P<0.05 was considered sig-nificant. Analyses were done
us-ing SPSS 16.0 for Windows soft-ware (SPSS, Chicago, IL).
Results
Patient characteristics
The clinical, cytogenetic findings
and laboratorial features of 126 BP-ALL cases are shown in Table 1. Patients age range from 0.5 to 13.3 years with the median age of 5 years, and the predominant age group is in between age 1 and age 10 (n=100). The gender ratio is balanced (female:male; 62:64). WBC ranged from 1.6 to 395.6 (×109/L) at median of 25.3
(×109/L). The incidence of TEL/
[image:3.612.91.354.352.603.2]account-2015). No CNSL or testicular leukemia relapse was noted in this population.
MRP1-6 expression in BP-ALL during treat-ment course
Bone marrow specimen at diagnosis from 126 BP-ALL was analyzed for MRP1-6 using qRT-PCR. MRP1-6 expression can be detected in all cases. However, the expression levels of
MRPs were significantly different as shown by
median level (Table 2 and Figure 1). Correlation analysis revealed that MRP5 had a statistic positive correlation with all other MRP mem-bers (P<0.05). MRP1 showed a relative poor
correlation with other MRP members, except with MRP5. We further analyzed the expression levels of MRP1-6 in BP-ALL during treatment course, we found that the expression level of
MRP1,3,4,5 had a significant difference at ini -tial stage compared with complete remission, further increased after relapse. (Table 2), which indicated that MRPs expressing pattern has a close relation in predicting treatment response and outcome.
Correlation of MRP expression and clinical fea-tures in BP-ALL with univariate analysis
The number of cases is small and makes multi-variate analysis unreliable. We analyzed MRPs in relation to initial WBC. MRP1 and MRP4 were
member of MRPs showed different expression with clinical features of BP-ALL.
The correlation of MRPs with treatment re-sponse in patients with BP-ALL
MRP1 had a close correlation with treatment response. The PPR patients had a statistically higher expression of MRP1 (P=0.01) (Table 3). MRP1 expression also showed a positive cor-relation with MRD level on day 33 (122.65 ver-sus 97.14, P=0.045), and 12 week
post-che-motherapy (158.76 versus 87.97, P<0.001).
MRP5 also had a higher expression in the group with positive MRD than negative MRD on day 33 and 12 week (Table 3). MRP4 and MRP6 expression showed statistically higher in the group with higher level of MRD on week 12
(P<0.05) (Table 3). However, MRP2 and MRP3 didn’t show any statistic difference on the treatment response. Our results suggest that MRP1 is the most important parameter in pre-dicting drug response of MRPs in BP-ALL pa- tients. Pattern of MRPs expression can pre- dict treatment response in BP-ALL patients. LR patients had lowest MRP1 expression, and HR patients had highest expression of MRP1 with
the P<0.001 (Table 2). MRP6 expressed high-est in the HR group and lowhigh-est in IR group (P=0.012). Meanwhile, relapse patients had a statistically higher expression of MRP1 and MRP6 at their initial stage (Table 3). However, Figure 1. Relative expression of MRPs in initial patients with BP-ALL. The
relative expression was calculated as following, the Ct value of each MRP divided by the Ct value of β-actin gene and amplified for 10000 times. The horizontal bar of the box represented median.
statistically higher in the group of WBC above 50× 109/L than that in WBC low-
er group (133.16 vs. 101.37, and 16.68 vs. 8.80, respe- ctively) (Table 3). Analyzing the correlation of MRPs with known fusion genes as
crite-ria for risk stratification of
ALL, we found that MRPs cor-relates in different pattern. For example, in the group of patients with TEL/AML1 positive had a higher level of MRP2 and patients with E2A/PBX11 positive had a lower expression of MRP5
and MRP6 (P<0.05).
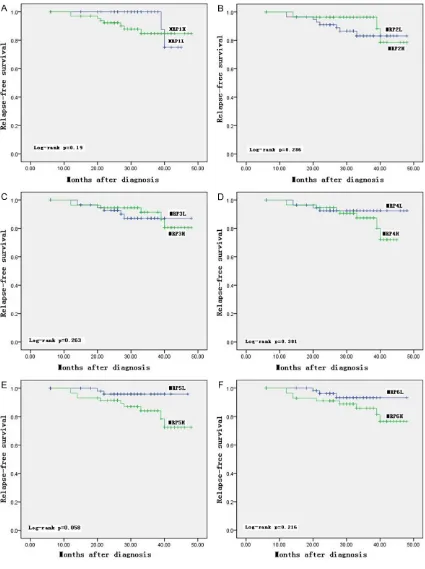
(Figure 3B and 3D). Our results indicated that MRP1 combining with other members may be
useful in refining subtype of ALL for the highest
risk of relapse. Discussion
Our study indicates that MRP1-6 is commonly
expressed in all BP-ALL though with significant
variation and change diversely during the treat-ment course. Among all MRPs, MRP1 has the highest and MRP3, the lowest expression by Q-RT-PCR. Most members of MRPs except MRP2 and MRP3 increased at relapse stage. The population with MRP1H were characterized
with PPR, high MRD level on day 33th and 12
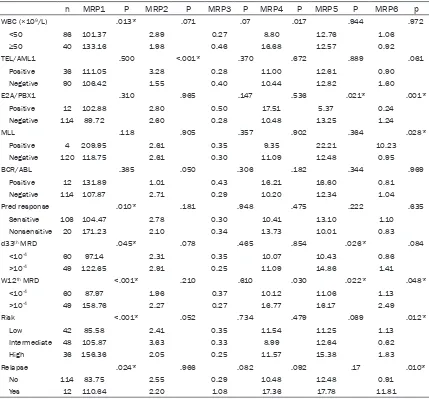
MRP1 or MRP6 alone didn’t affect relapse-free survival with P>0.05 (Figure 2A and 2F).
When we reclassified the patients combin-ing MRP1 with MRP5, patients were classified
into 4 subgroups, namely A (MRP1H/5L), B
(MRP1H/5H), C (MRP1L/5L), and D (MRP1L/5H)
[image:5.612.92.521.83.482.2](Figure 3A). The relapse rate was compared within these 4 subgroups with the method of life-table estimates, we found that subgroup A patients didn’t develop relapse within follow-up term, and about 35% of subgroup D patients relapsed early, and group B and group C rank- ed the second and third relapse rate (P= 0.007) (Figure 3C). Same trend was observed when MRP1 and MRP6 was combined together
Table 3. The expression pattern of MRP family members in pediatric B-ALL patients
n MRP1 P MRP2 P MRP3 P MRP4 P MRP5 P MRP6 p
WBC (×109/L) .013* .071 .07 .017 .944 .972
<50 86 101.37 2.89 0.27 8.80 12.76 1.06
≥50 40 133.16 1.98 0.46 16.68 12.57 0.92
TEL/AML1 .500 <.001* .370 .672 .889 .061
Positive 36 111.05 3.28 0.28 11.00 12.61 0.90
Negative 90 106.42 1.55 0.40 10.44 12.82 1.60
E2A/PBX1 .310 .965 .147 .536 .021* .001*
Positive 12 102.88 2.80 0.50 17.51 5.37 0.24
Negative 114 89.72 2.60 0.28 10.48 13.25 1.24
MLL .118 .905 .357 .902 .364 .028*
Positive 4 209.95 2.61 0.35 9.35 22.21 10.23
Negative 120 118.75 2.61 0.30 11.09 12.48 0.95
BCR/ABL .385 .050 .306 .182 .344 .969
Positive 12 131.89 1.01 0.43 16.21 16.60 0.81
Negative 114 107.87 2.71 0.29 10.20 12.34 1.04
Pred response .010* .181 .948 .475 .222 .635
Sensitive 106 104.47 2.78 0.30 10.41 13.10 1.10
Nonsensitive 20 171.23 2.10 0.34 13.73 10.01 0.83
d33th MRD .045* .078 .465 .854 .026* .084
<10-4 60 97.14 2.31 0.35 10.07 10.43 0.86
>10-4 49 122.65 2.91 0.25 11.09 14.86 1.41
W12th MRD <.001* .210 .610 .030 .022* .048*
<10-4 60 87.97 1.96 0.37 10.12 11.06 1.13
>10-4 49 158.76 2.27 0.27 16.77 16.17 2.49
Risk <.001* .052 .734 .479 .069 .012*
Low 42 85.58 2.41 0.35 11.54 11.25 1.13
Intermediate 48 105.87 3.63 0.33 8.99 12.64 0.62
High 36 156.36 2.05 0.25 11.57 15.38 1.83
Relapse .024* .966 .082 .092 .17 .010*
No 114 83.75 2.55 0.29 10.48 12.48 0.91
Yes 12 110.64 2.20 1.08 17.36 17.78 11.81
Figure 2. Relapse-free survival in children from the various MRPs subdivided into two groups of low (L) and high (H). A: MRP1; B: MRP2; C: MRP3; D: MRP4; E: MRP5; F: MRP6.
weeks and high WBC, age >10 year as well as. However, MRP1 expression alone is not signi-
ficantly associated with relapse-free survival
sub-prior to drug treatment, just like our results. However, the impact of MRP1 on the outcome of ALL remains controversial. Some studies re- ported that increased MRP1 expression upon diagnosis had no impact on the event-free sur-vival of children or adults [11, 31-33]. On the contrary, some authors declared that MRP1
expression influenced relapse-free survival [17,
34, 35]. Mahjoubi et al. reported overexpres-sion of MRP1 occurred in Iranian pediatric leu-kemia patients at relapse [34] which was
con-sistent with our results but they didn’t find any
relation between MRP1 mRNA levels and other
groups with significant different outcome were identified. The rates of relapse from highest
risk were patients with low MRP1 and high MRP6 (D group), and lowest in high MRP1 and low MRP6 (A group). To our best knowledge, such correlation between MRPs and clinical characteristics has not been reported in BP-ALL.
Anticancer drugs are highly subjected to MRPs
effluex mechanism and render ineffectiveness
[image:7.612.93.520.75.500.2]of chemotherapeutic agents [30]. Elevated level of MRP1 is often found in malignant cells
MRP5, and SMRP genes in B precursor ALL (n=76) and T-ALL (n=32) in 2003. They found that all 5 genes were expressed with a great variability which was consistent with our re- sults. Meanwhile, they also found that MRP3
expression was associated with a significantly
worse prognosis (P=0.008) independent of immunophenotype or sex [16]. In our study, the MRP3 gene was detected in 126 BP-ALL with lower expression at initial and relapse stage and higher expression after complete remis-sion (CR). Further analysis also didn’t show any correlation of MRP3 with clinical character-istics, cytogenetics, treatment response, and relapse.
Except the earlier reports by Plasschaert et al. group [17, 31], MRP4-6 expressions are rare reported. In our study, we found that relapse patients had higher expressions of MRP4-6
than CR group and showed significant correla -tion with high WBC, high MRD and gene rear-rangements (Tables 2 and 3). However, we
didn’t find their impacts on relapse-free surviv -al with univariate an-alysis (-all P values >0.05) (Figure 2). Due to the complexity of MRPs, we attempt to reclassify patients based on the median expression of MRP1/5 or MRP1/6 into
4 subgroups and indicated that such classifica -tion is more useful in identifying patients with higher risk of relapse (Figure 3). Such classifi -cation may predict the outcome of pediatric BP-ALL in addition to conventional prognostic factors. However, more questions remain for the best use of such preliminary in future. In conclusion, all MRPs were detectable in pe- diatric ALL and yet with distinct pattern. Pros- pective study in cooperated such markers are
necessary to further define roles of MRPs in
prognosis and treatment outcome. Acknowledgements
The authors would like to thank the grants from Jiangsu Province’s Clinical Medical Science and Technology Projects (Grant No. BL2013014), National Natural Science Foundation of China (No. 81100371 and No. 81370627), Priority Academic Program Development of Jiangsu Higher Education Institutions (PAPD), and Na- tional clinical key subject construction project. Disclosure of conflict of interest
None. clinical characteristics, In our study, we not only
found that MRP1 expression in relapse group was higher compared with CR group, but also found that high MRP1 expression is close cor-related with PPR, high MRD level on day 33th
and 12 weeks, high WBC, and age >10 year. Recently, Rahgozar et al. [36] reported that MRP1 was positively related with the level of minimal residual disease (MRD) which was
consistent with our findings. In our study we
found that high expression of MRP1 had a positive correlation with poor response to ther-apy. Cortez et al. [37] reported that express- ion levels of MRP1 gene in patients classi-
fied as being at high risk was associated with
higher rates of 5-year event-free survival (EFS)
(P=0.01). Such findings were interpreted as
low toxicity associated death rate in the high-risk patients with high expression of MRP1 gene [37]. Due to our follow-up cutoff duration is short, we focused on the relation of MRP1 expression upon diagnosis with relapse-free survival and found that MRP1 expression either
high (>50% percentile) or low (<50% percentile) didn’t exert influence on relapse-free survival
(P=0.19) (Figure 2A). Our results are quite dif-ferent from the report by Plasschaert et al. In 2005, they detected MRP1-6 expression in 56 pediatric patients, among them 15 cases were T-ALL, and only 39 cases were B-ALL. In our study, we enrolled 126 cases with B-ALL and treated under the protocol of CCLG-ALL-2008 which might partly explain the discrepancy. Recently, MRP2 polymorphisms with metho-trexate serum levels and its toxic effects in children with ALL was described [38, 39]. The expression level of MRP2 was rare reported in the literatures. Plasschaert reported that patients with higher MRP2 expression had a shorter term of relapse-free survival which was different from ours. The main reason might be our shorter follow-up duration though we detected a bigger size of patients (126 patients
vs. 39 patients) [17]. In our findings we found
that patients with TEL/AML1 showed a statisti-cally higher expression of MRP2 than those negative patients (Table 2) which is first report -ed by our group. However, MRP2 expression didn’t affect the relapse-free survival (P=0.286) (Figure 2B) Steinbach et al. [16] found that
in follow-up. Pediatr Hematol Oncol 2001; 18: 27-36.
[9] den Boer ML, Pieters R, Kazemier KM, Rottier MM, Zwaan CM, Kaspers GJ, Janka-Schaub G, Henze G, Creutzig U, Scheper RJ, Veerman AJ. Relationship between major vault protein/lung resistance protein, multidrug resistance-asso-ciated protein, P-glycoprotein expression, and drug resistance in childhood leukemia. Blood 1998; 91: 2092-2098.
[10] Wuchter C, Leonid K, Ruppert V, Schrappe M, Büchner T, Schoch C, Haferlach T, Harbott J, Ratei R, Dörken B, Ludwig WD. Clinical signifi -cance of P-glycoprotein expression and func-tion for response to inducfunc-tion chemotherapy, relapse rate and overall survival in acute leu-kemia. Haematologica 2000; 85: 711-721. [11] Sauerbrey A, Voigt A, Wittig S, Häfer R, Zintl F.
Messenger RNA analysis of the multidrug re-sistance related protein (MRP1) and the lung resistance protein (LRP) in de novo and re-lapsed childhood acute lymphoblastic leuke-mia. Leuk Lymphoma 2002; 43: 875-879. [12] Borst P, Evers R, Kool M, Wijnholds J. A family
of drug transporters: the multidrug resistance associated proteins. J Natl Cancer Inst 2000; 92: 1295-1302.
[13] Kool M, van der Linden M, de Haas M, Baas F, Borst P. Expression of human MRP6, a homo-logue of the multidrug resistance protein gene MRP1, in tissues and cancer cells. Cancer Res 1999; 59: 175-182.
[14] Wielinga PR, Reid G, Challa EE, van der Heijden I, van Deemter L, de Haas M, Mol C, Kuil AJ, Groeneveld E, Schuetz JD, Brouwer C, De Abreu RA, Wijnholds J, Beijnen JH, Borst P. Thiopurine metabolism and identification of the thiopurine metabolites transported by MRP4 and MRP5 overexpressed in human em-bryonic kidney cells. Mol Pharmacol 2002; 62: 1321-1331.
[15] Kool M, van der Linden M, de Haas M, Scheffer GL, de Vree JM, Smith AJ, Jansen G, Peters GJ, Ponne N, Scheper RJ, Elferink RP, Baas F, Borst P. MRP3, an organic anion transporter able to transport anticancer drugs. Proc Natl Acad Sci U S A 1999; 96: 6914-6919.
[16] Steinbach D, Wittig S, Cario G, Viehmann S, Mueller A, Gruhn B, Haefer R, Zintl F, Sauerbrey A. The multidrug resistance-associated protein 3 (MRP3) is associated with a poor outcome in childhood ALL and may account for the worse prognosis in male patients and T-cell immuno-phenotype. Blood 2003; 102: 4493-4498. [17] Plasschaert SL, de Bont ES, Boezen M, vander
Kolk DM, Daenen SM, Faber KN, Kamps WA, de Vries EG, Vellenga E. Expression of multi -drug resistance-associated proteins predicts prognosis in childhood and adult acute lym-Address correspondence to: Shao-Yan Hu, Depart-
ment of Hematology & Oncology, The Children’s Hospital of Soochow University, 303 Jingde Road, Suzhou 215003, Jiangsu, China. Tel: 86-512-677- 88409; Fax: 86-512-67786202; E-mail: hu_shaoy-an@sina.com
References
[1] Conter V, Aricò M, Basso G, Biondi A, Barisone E, Messina C, Parasole R, De Rossi G, Locatelli F, Pession A, Santoro N, Micalizzi C, Citterio M, Rizzari C, Silvestri D, Rondelli R, Lo Nigro L, Ziino O, Testi AM, Masera G, Valsecchi MG; Associazione Italiana di Ematologia ed Oncologia Pediatrica. Long-term results of the Italian association of pediatric hematology and oncology (AIEOP) studies 82, 87, 88, 91 and 95 for childhood acute lymphoblastic leuke-mia. Leukemia 2010; 24: 255-264.
[2] Möricke A, Zimmermann M, Reiter A, Henze G, Schrauder A, Gadner H, Ludwig WD, Ritter J, Harbott J, Mann G, Klingebiel T, Zintl F, Niemeyer C, Kremens B, Niggli F, Niethammer D, Welte K, Stanulla M, Odenwald E, Riehm H, Schrappe M. Longterm results of five con -secutive trials in childhood acute lymphoblas-tic leukemia performed by the ALL-BFM study group from 1981 to 2000. Leukemia 2010; 24: 265-284.
[3] Hunger SP, Lu X, Devidas M, Camitta BM, Gaynon PS, Winick NJ, Reaman GH, Carroll WL. Improved survival for children and adolescents with acute lymphoblastic leukemia from 1990-2005: a report from the Children’s Oncology Group. J Clin Oncol 2012; 30: 1663-1669. [4] Pui CH, Mullighan CG, Evans WE, Relling MV.
Pediatric acute lymphoblastic leukemia: where are we going and how do we get there? Blood 2012; 120: 1165-1174.
[5] Pirker R, Wallner J, Geissler K, Linkesch W, Haas OA, Bettelheim P, Hopfner M, Scherrer R, Valent P, Havelec L, et al. MDR1 gene expres -sion and treatment outcome in acute myeloid leukemia. J Natl Cancer Inst 1991; 83: 708-712.
[6] Marie JP. Drug resistance in hematologic ma-lignancies. Curr Opin Oncol 2001; 13: 463-469.
[7] Sauerbrey A, Zintl F, Volm M. P-glycoprotein and glutathione S-transferase pi in childhood acute lymphoblastic leukaemia. Br J Cancer 1994; 70: 1144-1149.
[27] Loh ML, Goldwasser MA, Silverman LB, Poon WM, Vattikuti S, Cardoso A, Neuberg DS, Shannon KM, Sallan SE, Gilliland DG. Prospective analysis of TEL/AML1-positive pa-tients treated on dana-farber cancer institute consortium protocol 95-01. Blood 2006; 107: 4508-4513.
[28] Shurtleff SA, Buijs A, Behm FG, Rubnitz JE, Raimondi SC, Hancock ML, Chan GC, Pui CH, Grosveld G, Downing JR. TEL/AML1 fusion re-sulting from a cryptic t(12;21) is the most com-mon genetic lesion in pediatric ALL and de-fines a subgroup of patients with an excellent prognosis. Leukemia 1995; 9: 1985-1989. [29] Chiaretti S, Vitale A, Cazzaniga G, Orlando SM,
Silvestri D, Fazi P, Valsecchi MG, Elia L, Testi AM, Mancini F, Conter V, te Kronnie G, Ferrara F, Di Raimondo F, Tedeschi A, Fioritoni G, Fabbiano F, Meloni G, Specchia G, Pizzolo G, Mandelli F, Guarini A, Basso G, Biondi A, Foà R. Clinico-biological features of 5202 patients with acute lymphoblastic leukemia enrolled in the Italian AIEOP and GIMEMA protocols and stratified in age cohorts. Haematologica 2013; 98: 1702-1710.
[30] Deeley RG, Westlake C, Cole SP. Transmem- brane transport of endo- and xenobiotics by mammalian ATP-binding cassette multidrug re-sistance proteins. Physiol Rev 2006; 86: 849-899.
[31] Plasschaert SL, Vellenga E, de Bont ES, van der Kolk DM, Veerman AJ, Sluiter WJ, Daenen SM, de Vries EG, Kamps WA. High functional P-glycoprotein activity is more often present in T-cell acute lymphoblastic leukaemic cells in adults than in children. Leuk Lymphoma 2003; 44: 85-95.
[32] Kakihara T, Tanaka A, Watanabe A, Yamamoto K, Kanto K, Kataoka S, Ogawa A, Asami K, Uchiyama M. Expression of multidrug resis-tance-related genes does not contribute to risk factors in newly diagnosed childhood acute lymphoblastic leukemia. Pediatr Int 1999; 41: 641-647.
[33] Valera ET, Scrideli CA, Queiroz RG, Mori BM, Tone LG. Multiple drug resistance protein (MDR-1), multidrug resistance related protein (MRP) and lung resistance protein (LRP) gene expression in childhood acute lymphoblastic leukemia. Sao Paulo Med J 2004; 122: 166-171.
[34] Mahjoubi F, Akbari S. Multidrug resistan- ce-associated protein 1 predicts relapse in Iranian childhood acute lymphoblastic leuke-mia. Asian Pac J Cancer Prev 2012; 13: 2285-2289.
[35] Huh HJ, Park CJ, Jang S, Seo EJ, Chi HS, Lee JH, Lee KH, Seo JJ, Moon HN, Ghim T. Prognostic significance of multidrug resistance gene 1 (MDR1), multidrug resistance-related protein (MRP) and lung resistance protein phoblastic leukemia. Clin Cancer Res 2005;
11: 8661-8668.
[18] Lu J, Ashwani N, Zhang M, He H, Lu J, Wang Y, Zhao W, Cao L, Ji Z, He Y, Hunag Y, Chen R, Hu S. Children diagnosed as mixed-phenotype acute leukemia didn’t benefit from the CCLG-2008 protocol, retrospective analysis from single center. Indian J Hematol Blood Transfus 2015; 31: 32-37.
[19] Weir EG, Cowan K, LeBeau P, Borowitz MJ. A limited antibody panel can distinguish B-pre- cursor acute lymphoblastic leukemia from nor-mal B precursors with four color flow cytome -try: implications for residual disease detection. Leukemia 1999; 13: 558-567.
[20] Borowitz MJ, Pullen DJ, Winick N, Martin PL, Bowman WP, Camitta B. Comparison of diag-nostic and relapse flow cytometry phenotypes in childhood acute lymphoblastic leukemia: implications for residual disease detection: a report from the children’s oncology group. Cytometry B Clin Cytom 2005; 68: 18-24. [21] Veltroni M, De Zen L, Sanzari MC, Maglia O,
Dworzak MN, Ratei R, Biondi A, Basso G, Gaipa G; I-BFM-ALL-FCM-MRD-Study Group. Expre- ssion of CD58 in normal, regenerating and leukemic bone marrow B cells: implications for the detection of minimal residual disease in acute lymphocytic leukemia. Haematologica 2003; 88: 1245-1252.
[22] DiGiuseppe JA, Fuller SG, Borowitz MJ. Overex- pression of CD49f in precursor B-cell acute lymphoblastic leukemia: potential usefulness in minimal residual disease detection. Cyto- metry B Clin Cytom 2009; 76: 150-155. [23] Borowitz MJ, Pullen DJ, Shuster JJ, Viswanatha
D, Montgomery K, Willman CL, Camitta B; Children’s Oncology Group Study. Minimal re-sidual disease detection in childhood precur-sor-B-cell acute lymphoblastic leukemia rela-tion to other risk factors. A children’s oncology group study. Leukemia 2003; 17: 1566-1572. [24] Parker C, Waters R, Leighton C, Hancock J,
Sutton R, Moorman AV, Ancliff P, Morgan M, Masurekar A, Goulden N, Green N, Révész T, Darbyshire P, Love S, Saha V. Effect of mitoxan -trone on outcome of children with first relapse of acute lymphoblastic leukaemia (ALL R3): an open-label randomised trial. Lancet 2010; 376: 2009-2017.
[25] Dördelmann M, Reiter A, Borkhardt A, Ludwig WD, Götz N, Viehmann S, Gadner H, Riehm H, Schrappe M. Prednisone response is the stron-gest predictor of treatment outcome in infant acute lymphoblastic leukemia. Blood 1999; 94: 1209-1217.
[38] Sharifi MJ, Bahoush G, Zaker F, Ansari S, Rafsanjani KA, Sharafi H. Association of -24CT, 1249GA, and 3972CT ABCC2 gene polymor-phisms with methotrexate serum levels and toxic side effects in children with acute lym-phoblastic leukemia. Pediatr Hematol Oncol 2014; 31: 169-177.
[39] Liu Y, Yin Y, Sheng Q, Lu X, Wang F, Lin Z, Tian H, Xu A, Zhang J. Association of ABCC2 -24C>T polymorphism with high-dose methotrexate plasma concentrations and toxicities in child-hood acute lymphoblastic leukemia. PLoS One 2014; 9: e82681.
(LRP) mRNA expression in acute leukemia. J Korean Med Sci 2006; 21: 253-258.
[36] Rahgozar S, Moafi A, Abedi M, Entezar-E-Ghaem M, Moshtaghian J, Ghaedi K, Esmaeili A, Montazeri F. mRNA expression profile of multidrug-resistant genes in acute lympho-blastic leukemia of children, a prognostic val-ue for ABCA3 and ABCA2. Cancer Biol Ther 2014; 15: 35-41.
![2 Phenylimidazo[1,2 a]pyridine 3 carbaldehyde](data:image/gif;base64,R0lGODlhAQABAIAAAP///wAAACH5BAEAAAAALAAAAAABAAEAAAICRAEAOw==)