JOURNAL OF FOREST SCIENCE, 61, 2015 (10): 422–430 doi: 10.17221/52/2015-JFS
Estimating red deer abundance using the pellet-based
distance sampling method
R.T. Torres
1, A.M. Valente
1, T.A. Marques
2, C. Fonseca
11CESAM, Department of Biology, University of Aveiro, Aveiro, Portugal
2Centre for Research into Ecological and Environmental Modelling, University of St Andrews,
St Andrews, Scotland
ABSTRACT: Many European agricultural landscapes have been abandoned facilitating the comeback of large
un-gulates. In Portugal, the increase in red deer numbers caused local conflicts with landowners reporting economic losses in forest and agricultural plantations. A great effort is needed to mitigate human-red deer conflicts through management strategies. Successful management strategies require reliable information on population trends. Here we propose an easy and readily applied method to estimate an increasing ungulate population. We estimated the red deer population density in a Mediterranean environment located in northeastern Portugal: Lombada National Hunting Area (LNHA) and Serra de Montesinho (SM), using pellet group counts coupled with distance sampling to account for pellet detectability. The estimated red deer density using a stratified detection function was 5.81 indd per 100 ha for LNHA and 1.34 indd per 100 ha for SM (95% CI: 3.65–9.25 and 0.74–2.42, respectively). For the entire area, the estimated density was 3.38 deer per 100 ha (95% CI: 2.18–5.24). Monitoring population trends is crucial to assess the impact of methods aimed at reducing the population size or impact and here we provided an example of a robust method that can be implemented to continuously monitor expanding populations.
Keywords: cervidae; distance sampling; deer density; pellet group counting; rural areas
Man has shaped European landscapes for hun-dreds of years (Vos, Meekes 1999). Whereas agri-cultural intensification has increased food produc-tion, it also imperilled biodiversity worldwide (e.g. Donald et al. 2001; Benton et al. 2002; Green et al. 2005). Europe, a highly populated continent, with intensive agriculture and heavy industry, has been taming its wilderness. After World War II, agricul-tural land was abandoned and traditional land use practices declined throughout many of Europe’s rural landscapes (Höchtl et al. 2005). This rural depopulation trend is well patent in some Mediter-ranean areas, which have lost more than half of their population in the last decades (Navarro, Pereira 2012). In Portugal, during the 1970s, big migration waves from rural communities to the cities occurred (Pinto-Correia, Mascarenhas 1999). Thus,
ar-able land was abandoned and resulted in important landscape transformations: cultivated areas were renaturalized, with spread of natural vegetation, in-cluding both shrub land and forest. As a result, Med-iterranean vegetation areas have increased in cover. As an example, from 1984 to 1999, areas of central Spain have recorded 35% growths in the vegetation (Romero-Calcerrada, Perry 2004). Land aban-donment also has implications for biodiversity and ecosystem function. The restoration of natural areas has, in some cases, resulted in the restoration of nat-ural ecosystems functions, facilitating the comeback of native large mammals (Navarro, Pereira 2012). At present, large carnivores are recolonizing Europe, highlighting their capacity to survive in human-dominated landscapes (Chapron et al. 2014). Coor-dinated legislation across European countries played
from land abandonment. The paradigm regarding ungulates has changed: from a decrease in
num-bers and distribution in the 19th century (Côte
et al. 2004) to the actual scenario of expanding
populations over Europe (Apollonio et al. 2010).
As ungulate populations increase, their impacts on the ecosystem tend to inevitably increase, of-ten causing conflicts with human land use goals
(see Putman et al. 2011a for a review). Some
of the negative effects of such increase include
(i) damage to agriculture (e.g. Cotê et al. 2004),
(ii) damage to forestry through browsing and bark
stripping (e.g. Cotê et al. 2004), (iii) deer-vehicle
collisions (e.g. Bruinderink, Hazebroek 1996;
Langbein et al. 2011), (iv) transmission of
diseas-es to humans (e.g. Tei et al. 2003) and domdiseas-estic livestock (e.g. Górtazar et al. 2007).
While just a century ago it was almost facing
ex-tinction in Portugal, the Iberian red deer Cervus
ela-phus hispanicus is one of the ungulates that has reg-istered a significant expansion in Iberian Peninsula in recent years (Vingada et al. 2010). A sequence of reintroduction programs during the 90’s coupled with natural dispersion from Spanish populations led to stable red deer populations. These are now common and widespread throughout Portugal, with the most representative populations located near
border areas with Spain (Vingada et al.2010). With
increasing distribution and densities, impacts on the ecosystem are likely to increase, as well as the risk of human-red deer conflict in the future (Torres et al. 2014a). The increase in red deer numbers is causing local conflicts with landowners reporting economic losses in forest plantations and agricultural planta-tions (Rosa 2006). Impacts from red deer are
de-scribed as an ever-growing problem in agriculture
(e.g. Putman, Staines 2004; Trdan, Vidrih 2008). Conflicts are naturally most evident in areas where forestry and/or agricultural production are the main economic activity. This has been shown to be very relevant in rural mountain communities in Portu-gal (Rosa 2006). Additionally, rural communities often feel particularly neglected by damage caused by wildlife, particularly in natural parks that they perceive as imposed by more powerful urban elites (Skogen et al. 2008). Local populations are becom-ing increasbecom-ingly concerned about the impacts of red deer population increase over agricultural and for-estry production as this is their only economic rev-enue. This can in turn imperil natural and protected
information on abundance and population trends. Nevertheless, the choice of any given method de-pends on the ecology and behaviour of the species of interest, the management questions to be answered, and the type of habitat the species inhabit. Indirect methods (e.g. pellet group counting) have several advantages since they are cheaper than direct meth-ods, they provide a good cost-performance, they en-able the prospection of large forested areas and can be performed all the year round and at any daytime, not being dependent on the species ethology, as di-rect methods are. In fact, according to Marques et al. (2001) in woodland areas (such as our study area) direct methods are not often feasible or they are po-tentially biased. Furthermore, the non-complexity
of this indirect method allows that e.g.park
rang-ers collect the data enabling the continuity of deer monitoring. Here, we propose an easy and read-ily applied method to estimate the density of red deer in a rural area in the northeast of Portugal. We sought a method to assess population trends con-sidering temporal variation to detect fluctuations on population density, useful at multiple spatial scales that can be easily used by managers across the entire red deer range in Portugal. Addition-ally, we discuss the importance of social concerns in finding a balance between different stakeholders and wildlife needs.
MATERIAL AND METHODS
Study area. The study was carried out in Mon-tesinho Natural Park (6°30'–7°12'W, 41°43' to 41°59'N), part of the European Union’s Natura 2000
Network, covering an area of 75,000 ha(Fig. 1). The
terrain consists of rolling hills with elevation ranges from 438 to 1,481 m. The climate is Mediterranean with the mean annual temperature varying between 3°C in the coldest month and 21°C in the warmest month and mean precipitation between 600 and 1,500 mm. The vegetation is diverse, characterized
mainly by oak (Quercus pyrenaica, Quercus
rotundi-folia, Quercus suber), sweet chestnut (Castanea
sa-tiva) and maritime pine (Pinus pinaster). The shrub
vegetation is dominated by heather (Erica spp.),
gum rockrose (Cistus ladanifer) and furze (Ulex
include the wild boar (Sus scrofa) and the roe deer (Capreolus capreolus). The study area is crossed by some rivers and includes small villages with a low
human presence (9.5 people/km2). Since 1960, the
population has decreased about 60%, from ca 3,600 inhabitants to ca 1,400 (INE 1960, 2001). A number of national roads, which provides connection be-tween Portugal and Spain, cross the study area.
Field methods and sampling design. The sur-vey area was divided into 2 geographic strata: Serra de Montesinho (SM: 24,800 ha) and Lombada Na-tional Hunting Area (LNHA: 20,830 ha). This was done to allow separate estimates by these relevant management areas (red deer is hunted in LNHA during September – even though the hunting bag is between 5 and 7 animals, in some years that num-ber is not filled – but not in SM). Transect location followed a systematic design with a random start, ensuring that transects were representative of the whole area. In total, there were 49 transects: 27 in LNHA and 22 in SM (Fig. 1). Each transect was 1,000 m long; to maximize spatial coverage while re-ducing sampling dependence, transects were divid-ed into 100 m on-effort segments spacdivid-ed by 200 m off-effort segments, in a total of 4 times 100 m on-effort and 6 times 100 m off-on-effort per transect. The transects were considered the independent sam-pling units for encounter rate variance estimation (see details below). Fieldwork was performed from January 2012 to October 2013 (2012: January and November; 2013: January, February and October). A handheld Global Positioning System (GPS) unit and a compass were used to ensure straight line transects. A rope was used to facilitate the progress in a straight line in a woodland habitat, ensuring the
prospection of 1 m from each side of the line. Ad-ditionally, this facilitates accurate measurements of perpendicular distance of the pellet groups to the transect line. Whenever a pellet group was detect-ed, the perpendicular distance from the centre of the group to the transect line was recorded with a measuring tape. Only pellet groups with six or more individual pellets, produced at the same defecation event, identified for similar size, shape, texture and colour (Mayle et al. 1999), were considered to mini-mize the risk of counting one spread group as more than one pellet group. Four additional observation level covariates potentially influencing detection
were collected: (i) pellet group size (medium:
be-tween 6 to 40 individual pellets vs. large: more than
40 individual pellets); (ii) group dispersion
(aggre-gated vs. scattered); (iii) habitat type around the
pel-let group (open vs. closed); and (iv) visibility, i.e. if
the pellet group was clearly visible or not. Fieldwork was implemented by two observers, one of them constant throughout all surveys.
Density estimation. Taking into account habitat conditions and the available resources, an indirect density estimation method was implemented. Ani-mal density was estimated within a distance sam-pling framework. Distance samsam-pling, conditional on an adequate survey design, is based on four key
assumptions: (i) objects (pellet groups in this case)
on the transect line are always detected; (ii)
sam-pling is instantaneous and objects do not move in
response to the observer before being detected; (iii)
perpendicular distances to the centre of the
tran-sect line are accurate and (iv) strictly, obtaining
[image:3.595.143.446.57.257.2]estimates for the parameters of the detection func-tion by maximum likelihood requires detecfunc-tions to Fig. 1. Location of the study area in the Iberian Peninsula (the distribution of sampling plots in the two study sites: SM – Serra de Montesinho, LNHA – Lombada National Hunting Area)
SM
LNHA
0 100 200 km
2001). The decrease in detectability with increasing distance from the transect line is modelled using a detection function (Buckland et al. 2001; Miller
et al. 2013), typically represented by g(x),
repre-senting the probability of detecting an object if it
is at distance x from the centre of the transect line.
This function is then used to estimate the detection
probability P within the covered area, as Eq. (1):
(1)
where:
w – truncation distance,
g(x) – probability of detecting an object if it is at distance x, π(x) – distribution of available distances with respect to
the line.
This distribution is assumed to be uniform by de-sign, which is reasonable with the random
place-ment of the transect lines. The estimate of P leads
to a density estimator as follows. For the ni
detect-ed pellet groups in stratum i, an estimate of animal
density ˆDiis given by Eq. (2):
(2)
where: ˆ
Dip – pellet group density estimator,
ˆα – pellet production rate: on average, how many pellet groups a deer produces per day,
ˆβ – decay of pellet groups, ni – pellet groups in stratum i,
Li – total on-effort line length in stratum i (i = 1.2), w – truncation distance,
ˆ
Pi – detection probability of a group within the covered area in stratum i.
How many days does it take a pellet group not to be recognized as a group (> of 6 individuals). This nota-tion implies that both α and β are assumed constant across strata. Note that the animal density estimator
is just the pellet group density (Dp) estimator,
divid-ed by the requirdivid-ed production and decay rates. The
global density (D) estimate is obtained as a weighted
average of stratum specific estimates, with stratum’s areas as weights (Buckland et al. 2001), i.e. Eq. (3):
(3)
where: ˆ
Dl – stratum density, Ai – stratum area.
In this study α and β were obtained from differ-ent sources. The mean number of days that a pel-let group takes to disappear (β) was assumed to be 227 ± 24 days, a value provided by Torres et al. (2013) for red deer in MNP. The production rate (α) was considered to be 25, value estimated in the UK (Mayle et al. 1999; The Deer Initiative 2008). We address the plausibility of these values and conse-quences of bias in these parameters and their preci-sion (or lack thereof) in the final density estimates in the discussion.
Data analysis. Analyses were implemented in Distance 6.0 software (RUWPA, St. Andrews, UK) (Thomas et al. 2010). To evaluate the influence of available covariates in the detection function, we considered Multiple Covariate Distance Sampling (MCDS) analyses (Marques et al. 2007). Data were right-truncated at 5% (95 cm), a standard pro-cedure (Marques 2004; Ward et al. 2004) to fa-cilitate parsimonious model fitting, avoiding fitting spurious bumps in the tail of the detection function (Marques et al. 2001). Three key function models (half-normal, uniform and hazard-rate) were con-sidered, adding adjustment terms (cosine, simple polynomial and Hermite polynomial) as required to improve the model fit (Buckland et al. 2001). Model selection was based on AIC (Burnham, Anderson 1984), with goodness-of-fit tests and visual inspection of the histogram aiding the pro-cess. A Cramer-von Mises goodness-of-fit test was used as absolute measures of fit, to evaluate the ad-equacy of the final model chosen for inference.
RESULTS
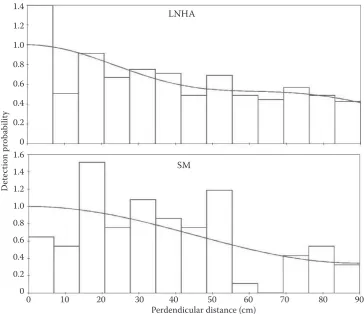
In a total of 19,600 m of effort (SM – 8,800 m; LNHA – 10.800 m) 527 pellet groups were detected. As expected, the number of records monotonously decreased with distance. Surprisingly, given the rig-orous survey design and field methods, coupled with the fact that objects being detected were im-mobile, a larger number than expected of small dis-tances (below 7.5 cm) was present, especially for LNHA. Nevertheless, the results were insensitive to this peak with regard to the broad shoulder pres-ent in the data. The model that better fitted the dis-tance data was a half-normal model for LNHA (a), and a uniform model for SM (b), both with the cosine adjustment term (Fig. 2). Although a pooled analysis
wg x xdx P
0 ) ( )
(
1 π
β α β
αˆˆ 2 ˆ ˆˆ ˆ
ˆ
i i
i p
i i
P w L
n D
D = =
αβ αβ
�� =∑∑������ ����� �
� � ���
was carried out, the most parsimonious model with regard to AIC was considered the detection function to be stratified by area, with the uniform model with the cosine adjustment term corresponding to a bet-ter fit (Fig. 3). Somewhat unpredictably, none of the covariates contributed to a better fit of the model, and thus the model with the distance alone was selected
for further inference (further implications of this re-sult can be found in the Discussion). The
goodness-of-fit P-values for such a model were 0.008 (LNHA)
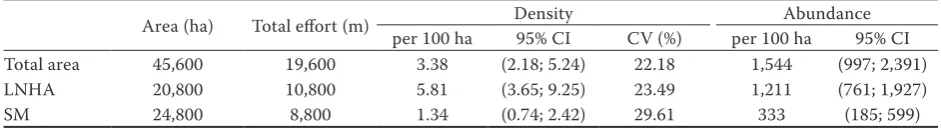
and 0.035 (SM) (Table 1). Deer density estimates per stratum were 5.81 indd 100 ha (95% CI of 3.65 to 9.25) for LNHA and 1.34 indd per 100 ha (95% CI of 0.74 to 2.42) for SM, with the coefficient of variation 23.49%
0 10 20 30 40 50 60 70 80 90 Perdendicular distance (cm)
1.6 1.4 1.2 1.0 0.8 0.6 0.4 0.2 0
D
et
ec
tion pr
ob
ability
[image:5.595.113.478.55.369.2]1.4 1.2 1.0 0.8 0.6 0.4 0.2 0
Fig. 2. Stratified detection function of the distance data for study sites (observed distances were right-truncated to elimi-nate the largest 5% of the distances)
LNHA
SM
0 10 20 30 40 50 60 70 80 90 Perdendicular distance (cm)
1.6
1.4 1.2
1.0
0.8
0.6
0.4 0.2
0
D
et
ec
tion pr
ob
ability
Fig. 3. Pooled detection function of the distance data for survey area using a uniform model key function and a cosine adjustment term (observed distances were right-truncated to eliminate the largest 5% of the distances)
[image:5.595.115.481.508.692.2]and 29.61%, respectively. The global density estimate was 3.38 indd per 100 ha (95% CI of 2.18 to 5.24) with the coefficient of variation 22.18% (Table 2).
DISCUSSION
The estimated red deer density over the study area was 3.38 indd per 100 ha, with densities higher in LNHA than SM (LNHA: 5.81 indd per 100 ha and SM: 1.34 indd per 100 ha). This was expected as this population results from natural dispersion from the Spanish border populations and the first nucleus of red deer populations in MNP was origi-nally established in LNHA and they continued ex-panding from there (Santos 2009). Santos (2007; 2009) and Carvalho (2011), using conventional animal-based distance sampling, estimated that red deer densities in LNHA were 3.26 indd per 100 ha and 1.75 indd per 100 ha, respectively. Even though our density estimates are slightly higher than those obtained previously, it is difficult to compare our estimates with these two studies because these au-thors surveyed only the northern part of the LNHA whereas we surveyed the whole area, and field work was from different years.
estimate ungulate density (Apollonio et al. 2010). Among indirect methods, pellet group counting has been widely used to estimate deer densities through-out the world (Marques et al. 2001; Jathanna et al. 2003; Smart et al. 2004; Herrero et al. 2013; Valente et al. 2014) and while some authors have argued against it (e.g. Morellet et al. 2007), others have recommended it, claiming that it can be used to efficiently assess the population size and trends (e.g. Acevedo et al. 2008). For many species direct methods are not often feasible and are potentially biased in woodland habitats due to elusive animal behaviour leading to extremely reduced detectabil-ity (Torres et al. 2014b; Valente et al. 2014). Ad-vantages of pellet group counts include being easy to implement over large areas, requiring low financial and logistical resources and being especially useful in areas with low visibility (Marques et al. 2001; Smart et al. 2004). Here we used an indirect meth-od based on pellet groups coupled with distance sampling to estimate red deer density. The need of conversion factors (e.g. decay rate and production rate of red deer) can decrease the precision of an estimate (Plumptre 2000). Here we expect mini-mal bias arising from the decay rate, as it was re-cently calculated for both the species and the region of interest (Torres et al. 2013). Since decay rates can vary across habitats, the use of a site-specific value for each dominant habitat instead of a mean value should be investigated in future work. The key problem with our estimate is certainly the use of a production rate obtained in another place and time (Mayle et al. 1999). Furthermore, the value used does not have a precision measure associated with it, therefore the variance reported here ignores a potential source of variation. While this is a short-coming, it also shows a clear strength of the modular form of the estimator used here: as soon as a pro-duction rate and corresponding standard error are obtained for our region, the density estimates and
Stratified 4,483.44* 0.00
Pooled 4,484.36 0.92 0.010
Covariate
size 4,488.37 4.93 0.010
shape 4,488.46 5.02 0.010
detectability 4,488.18 4.74 0.010
habitat 4,487.70 4.26 0.010
[image:6.595.64.293.72.188.2]AIC – Akaike Information Criterion, ΔAIC – Differences in AIC scores, CvM – P-values associated with the Cramer-von Mises goodness-of-fit tests, LNHA – Lombada National Hunting Area, SM – Serra de Montesinho, Individual LNHA; Individual SM and Stratified – summarize the two individual analyses: LNHA, SM; *sum of the 2 previous individual analyses
Table 2. Red deer density, abundance and 95% CI in total area, LNHA and SM
Area (ha) Total effort (m) per 100 ha Density 95% CI CV (%) per 100 haAbundance95% CI
Total area 45,600 19,600 3.38 (2.18; 5.24) 22.18 1,544 (997; 2,391)
LNHA 20,800 10,800 5.81 (3.65; 9.25) 23.49 1,211 (761; 1,927)
SM 24,800 8,800 1.34 (0.74; 2.42) 29.61 333 (185; 599)
[image:6.595.62.533.660.725.2]corresponding variances reported here could be eas-ily updated. Obtaining such production rate should therefore be a major goal for the effective manage-ment of these populations.
Surprisingly, none of the available covariates had an impact on the detectability of pellet groups. The dis-tance-only detection function led to the most parsi-monious model to explain the pellet group detectabil-ity. This reflects the fact that the pooling robustness of distance sampling holds and that sometimes MCDS provides no additional practical gain beyond con-ventional distance sampling, especially for situations like here where there is a broad shoulder. Nonethe-less, under certain circumstances MCDS can be used to reduce variance estimates, by explaining some of the variance in detectability. MCDS might also allow less biased estimates of density, and further, covari-ate influence on detectability might be interesting in itself. Therefore, we encourage researchers to collect data regarding covariates believed to have an impact on the detectability of the study objects, since they can have an important role in modelling the
detec-tion funcdetec-tion (Marques et al.2007). All the distance
sampling assumptions were met in this study: (1) it is unlikely that the pellet groups on the transect line were missed; even if they were, as we were looking for static objects in a very narrow transect, g(0) as-sumption would suffer at worst minor violations, (2) because pellets are immobile, the perpendicular distances to the centre of the transect line measure-ment error should be negligible. As a result, all the distance sampling assumptions were met, which is obviously a big advantage when compared with the use of animal-based distance sampling. When com-pared to direct methods, indirect methods have demonstrated to provide feasible and robust results, validating the pellet group count method (Acevedo et al. 2008). In our particular case, the use of pellet group counts (an indirect methodology) allowed the survey of a large forested area, with a good cost-performance and provided estimates of density and abundance over several months. Additionally, after a well-established monitoring protocol, field signs are relatively easy to identify, allowing surveys to be done by non-professionals (e.g. volunteers), obviously decreasing the survey costs while ensuring the conti-nuity of data collection. This approach, applied over time, will allow tailoring management strategies to demographic data, and to assess the results of man-agement measures applied throughout the monitor-ing plan. Urbanek et al. (2012) showed that pellet group counting coupled with distance sampling pro-vides less biased estimates and was 88% cheaper than aerial surveys. When compared with direct methods,
pellet group counting can be performed at any time during the year and does not need elaborate equip-ment neither professional biologists to perform field work (Marques et al. 2001). While the distance sam-pling data analysis represents perhaps an additional step over using raw counts, it also allows gains in lo-gistical, financial, and analytical efficiency, with the added benefit of more precise and comparable abun-dance estimates. This should be a major goal in future studies regarding red deer in our study area.
We proposed an approach to monitor the pop-ulation abundance. Nevertheless, estimation of the population size should not be considered the only requirement to monitor red deer populations: managers need additional information to be con-sidered and monitored (e.g. habitat composition, impacts on vegetation and agriculture, collisions with vehicles, among others).
Red deer was considered the ungulate with the largest negative impact in Montesinho (Rosa 2006), responsible for significant agricultural and forest damage, so its population management is the most critical wildlife management issue in our study area. Red deer densities have been increasing in Portugal in general, being however smaller than in other ar-eas in Europe (Spain: 19.51 ± 3.19 indd per 100 ha – Acevedo et al. 2008; UK: 14.5 ± 11.25 indd per 100 ha – Smart et al. 2004), so the need to take rigorous measures to prevent the costs of red deer overabundance is evident. Particularly in our study area the locals are becoming more willing to increase Iberian wolf densities so that they can prey red deer, therefore decreasing the impact of deer on agricul-ture. In our study area, particularly in the LNHA, it was estimated that economic losses caused by wild ungulates have a significant impact on farmers’ in-come (Rosa 2006). Knowing the abundance of deer is vital to make population management decisions. For example, estimates of the population size before and after an action can be used to judge the suc-cess of management programs (Rutberg, Naugle 2008). However, accurate estimates of abundance are difficult to obtain, and management is often hin-dered by the lack of confidence in census methods.
see potential conflict areas. Our study showed that distance sampling applied with an indirect method such as pellet group counting can be successfully ap-plied. The primary advantage of this method is that it can be implemented over large areas, at any time of the year, and by any person, and it is cheap, saving considerable time and money. This paper provides an example of a robust method that can be imple-mented to continuously monitor expanding popula-tions. Therefore, we recommend that this method should be used consistently through time and space to ensure valid comparisons or assessments of deer populations.
Acknowledgements
We are grateful to several institutions that pro-vided invaluable support: Nature and Forestry Conservation Institute and especially Núcleo Flo-restal de Bragança.
References
Acevedo P., Ruiz-Fons F., Vicente J., Reyes-García R., Alzaga V., Gortázar C. (2008): Estimating red deer abundance in a wide range of management situations in Mediterranean habitats. Journal of Zoology, 276: 37–47.
Apollonio M., Andersen R., Putman R. (2010): European
Ungulates and Their Management in the 21st Century.
Cambridge, Cambridge University Press: 604.
Benton T.G., Vickery J.A., Wilson J.D. (2003): Farmland biodiversity: is habitat heterogeneity the key? Trends in Ecology and Evolution, 18: 182–188.
Buckland S.T., Anderson D.R., Burnham K.P., Laake J.L., Borchers D.L., Thomas L. (2001): Introduction to Distance
Sampling. Oxford, University Oxford: 432.
Burnham K.P., Anderson D.R. (1984): The need for distance data in transect counts. Journal of Wildlife Management, 1248–1254.
Bruinderink G.W.T.A., Hazebroek E. (1996): Ungulate traffic collisions in Europe. Conservation Biology, 10: 1059–1067. Carvalho J. (2011): Monitorização da população de veado
(Cervus elaphus L.) na Zona de Caça Nacional da Lom-bada, Nordeste Transmontano: Época 2010/2011. [Red deer monitoring in Lombada National Hunting Areas.] [Bachelor Thesis.] Aveiro, Aveiro University: 116. Chapron G., Kaczensky P., Linnell J.D., Von Arx M., Huber
D., Andrén H., Nowak S. (2014): Recovery of large
carni-Donald P.F., Green R.E., Heath M.F. (2001): Agricultural intensification and the collapse of Europe›s farmland bird populations. Proceeding of the Royal Society of London: Series of Biological Sciences, 268: 25–29.
Gortázar C., Ferroglio E., Höfle U., Frölich K., Vicente J. (2007): Diseases shared between wildlife and livestock: a European perspective. European Journal of Wildlife Research, 53: 241–256.
Green R.E., Cornell S.J., Scharlemann J.P., Balmford A. (2005): Farming and the fate of wild nature. Science, 307: 550–555. Herrero J., Torres R.T., Prada C., García-Serrano A., Gime-nez-Anaya A., Fernández-Arberas O. (2013): Sustainable monitoring of roe deer in public hunting areas in the
Span-ish Pyrenees.Forest Systems, 22: 456–462.
Höchtl F., Lehringer S., Konold W. (2005): “Wilderness”: what it means when it becomes a reality – a case study from the southwestern Alps. Landscape Urban and Plan-ning, 70: 85–95.
INE (1960): X Recenseamento Geral da População. Tomo II: Famílias, Convivências e População residente e presente, por freguesias, Concelhos, Distritos e Centros Urbanos. Lisboa, Instituto Nacional de Estatística.
INE (2002): XIV Recenseamento Geral da População; IV Recenseamento Geral da Habitação. Lisboa, Instituto Nacional de Estatística.
Jathanna D., Karanth K.U., Johnsingh A.J.T. (2003): Estima-tion of large herbivore densities in the tropical forests of southern India using distance sampling. Journal of Zool-ogy, 261: 285–290.
Langbein J., Putman R., Pokorny B., Apollonio M., Andersen R. (2010): Traffic Collisions Involving Deer and Other Un-gulates in Europe and Available Measures for Mitigation. Ungulate Management in Europe: Problems and Practices. Cambridge, Cambridge University Press: 215–259. Mayle B.A., Peace A.J., Gill R.M.A. (1999): How Many Deer?
A Field Guide to Estimating Deer Population Size. Edin-burgh, Forestry Commission: 96.
Marques F.F.C., Buckland S.T., Goffin D., Dixon C.E., Borch-ers D.L., Mayle B.A., Pease A.J. (2001): Estimating deer abundance from line transect surveys of dung: sika deer in southern Scotland. Journal of Applied Ecology, 38: 349–363. Marques T.A. (2004): Predicting and correcting bias caused
by measurement error in line transect sampling using mul-tiplicative error models. Biometrics, 60: 757–763. Marques T.A., Thomas L., Fancy S.G., Buckland S.T. (2007):
Improving estimates of bird density using Multiple-Covar-iate Distance Sampling. Auk, 124: 1229.
and future directions. Methods of Ecology and Evolution, 4: 1001–1010.
Morellet N., Gaillard J.M., Hewison A.J.M., Ballon P., Boscar-din Y., Duncan P., Klein F., Maillard D. (2007): Indicators of ecological change: new tools for managing populations of large herbivores. Journal of Applied Ecology, 44: 634–643. Navarro L.M., Pereira H.M. (2012): Rewilding abandoned
landscapes in Europe. Ecosystems, 15: 900–912.
Pinto-Correia T., Mascarenhas J. (1999): Contribution to the extensification/intensification debate: new trends in the Portuguese montado. Landscape Urban and Planning, 46: 125–131.
Putman R., Langbein J., Green P., Watson P. (2011a): Identify-ing threshold densities for wild deer in the UK above which negative impacts may occur. Mammal Review, 41: 175–196. Putman R., Watson P., Langbein J. (2011b): Assessing deer densities and impacts at the appropriate level for manage-ment: a review of methodologies for use beyond the site scale. Mammal Review, 41:197–219.
Romero-Calcerrada R., Perry G.L. (2004): The role of land abandonment in landscape dynamics in the SPA Encinares del rıo Alberche y Cofio, Central Spain, 1984–1999. Land-scape Urban and Planning, 66: 217–232.
Rosa J.L.N. (2006): Efeitos dos ungulados bravios na agri-cultura e floresta no Parque Natural de Montesinho: o caso da zona de caça nacional da lombada. [Effects of Wild Ungulates in the Agriculture and Forestry in the Montesinho Natural Park: the Case of Lombada National Hunting Area.] [MSc Thesis.] Portugal, Instituto Politéc-nico de Bragança: 83.
Rutberg A.T., Naugle R.E. (2008): Population-level effects of
immunocontraception in white-tailed deer (Odocoileus
virginianus). Wildlife Research, 35: 494–501.
Santos J.P. (2007): Dinâmica populacional do veado (Cervus
elaphus) no Nordeste Transmontano. [Red Deer Popula-tion Dynamics in Northeast Portugal.] [Bachelor Thesis.] Aveiro, University of Aveiro: 63.
Santos J.P. (2009): Estudo populacional do veado (Cervus
ela-phus L.) no Nordeste Transmontano. [Red Deer Population Dynamics in Northeast Portugal.] [MSc Thesis.] Aveiro, University of Aveiro: 97.
Smart J.C., Ward A.I., White P.C. (2004): Monitoring wood-land deer populations in the UK: an imprecise science. Mammal Review, 34: 99–114.
Skogen K., Mauz I., Krange O. (2008): Cry wolf!: narratives of wolf recovery in France and Norway. Rural Sociology, 73: 105–133.
Tei S., Kitajima N., Takahashi K., Mishiro S. (2003): Zoonotic transmission of hepatitis E virus from deer to human be-ings. Lancet, 362: 371–373.
The Deer Initiative (2008): Records & Surveys: Dung Count-ing. England & Wales Best Practice Guides. Wrexham, The deer initiative: 4.
Thomas L., Buckland S.T., Rexstad E., Laake J., Strindber S., Hedley S.L., Bishop J.R.B., Marques T., Burnham K.P. (2010): Distance software: design and analysis of distance sampling surveys for estimating population size. Journal of Applied Ecology, 47: 5–14.
Torres R.T., Santos J., Fonseca C. (2013): Persistence of roe (Capreolus capreolus) and red (Cervuselaphus) deer pellet-groups in a Mediterranean mosaic landscape. Wildlife Biology in Practice, 9:7–18.
Torres R.T., Santos J., Fonseca C. (2014a): Factors influencing red deer occurrence at the southern edge of their range: A Mediterranean ecosystem. Mammalian Biology, 79: 52–57. Torres R.T., Herrero J., Prada C., Garcia-Serrano A., Fernan-dez-Arberas O., Garcia-Post R. (2014b): Estimating the
population density of Iberian wild goat Capra pyrenaica
and mouflon Ovis aries in a Mediterranean forest
environ-ment. Forest Systems, 23: 36–43.
Trdan S., Vidrih M. (2008): Quantifying the damage of red
deer (Cervus elaphus) grazing on grassland production
in southeastern Slovenia. European Journal of Wildlife Research, 54: 138–141.
Urbanek R.E., Nielsen C.K., Preuss T.S., Glowacki G.A. (2012): Comparison of aerial surveys and pellet based distance sampling methods for estimating deer density. Wildlife Society Bulletin, 36: 100–106.
Valente A.M., Fonseca C., Marques T.A., Santos J.P., Rodri-gues R., Torres R.T. (2014): Living on the edge: roe deer (Capreolus capreolus) density in the margins of its geo-graphical range. PLoS ONE, 9: e88459.
Vingada J., Fonseca C., Cancela J., Ferreira J., Eira C. (2010): Ungulates and their management in Portugal. In: European
Ungulates and Their Management in the 21st Century.
Cambridge, Cambridge University Press: 618.
Vos W., Meekes H. (1999): Trends in European cultural land-scape development: perspectives for a sustainable future. Landscape Urban and Planning, 46: 3–14.
Ward A.I., White P.C., Critchley C.H. (2004): Roe deer
Capre-olus capreCapre-olus behaviour affects density estimates from distance sampling surveys. Mammal Review, 34: 315–319.
Received for publication May 26, 2015 Accepted after corrections October 12, 2015
Corresponding author: