Abstract—Mobile learning (m-Learning) has often been
described as a new learning paradigm. The difference in the rates of acceptance and usage of the m-Learning platform, especially in the higher education sector, is an interesting quandary that has attracted several research studies. Researchers have examined the idea from several angles and produced a copious amount of literature devoted to explaining the interrelationships. However, almost all of this research suffers from a lack of systematic analysis, even though the research is all highly quantitative in nature. This research offers a systematic way of analyzing the learner’s perception of a successful m-Learning platform that can be emulated in other studies to understand the critical success factors of m-Learning in different contexts. It was found that personalization, content presentation, learner productivity, Internet access, and blended learning affected learner perception the most.
Index Terms— mobile learning, learner’s perception, critical
success factors
I. INTRODUCTION
OBILE learning (m-Learning) is a learning platform where wireless communication technology is used to impart education. The platform makes use of the fact that the technology allows anyone to access information and learning materials at their convenience at any time, wherever they happen to be. This means that learners now have control of the time and pace at which they want to learn, changing the way education is viewed by most people [1][2]. Needless to say, this offers exciting possibilities to expand the horizons of education. At the same time, the extent of ramifications to the educational sector means it engenders skeptical feelings in the very people it is expected to benefit.
The structure of the paper is as follow. Section 2 presents a brief literature review where several relevant aspects related to m-Learning and perception have been discussed. Section 3 presents the research model and the hypotheses that would be tested. Section 4 presents the research
This manuscript was received July 22, 2014; revised August 05, 2014. Muasaad Alrasheedi is a Ph.D. Candidate in Software Engineering with Electrical and Computer Engineering Department, Western University, London, Ontario, Canada N6A5B9. He is also a Member of IAENG (Tel: +15196970919; fax: +1519-8502436; e-mail: [email protected]).
Luiz Fernando Capretz is a Professor of Software Engineering and Assistant Dean (IT and e-Learning) with the Electrical and Computer Engineering Department, Western University, London, Ontario, Canada N6A5B9 (e-mail: [email protected]).
methodology. Section 5 presents the analysis of data comprising demographic analysis, correlation analysis, and determination of regression equation. Section 6 presents a discussion of the results and the limitations of the present study. Section 7 presents the conclusion.
II. LITERATURE REVIEW
The unique feature of a m-Learning platform that makes it a new educational platform is mobility. The concept of mobility refers to the prospect of having flexibility in terms of time, place, pace, and space that is not achievable when using non-mobile versions of devices [3]. In theory, m-Learning offers learners the opportunity of learning at any time and any place. However, it must be understood that the terms “any timeˮ and “any placeˮ are limited from being universally true due to issues of connectivity as well as safety restrictions [4]. Mobility, combined with collaborative learning, makes the m-Learning platform different from any other existing learning platform, whether it is traditional face-to-face learning or other technology-based platforms like e-Learning [5].
Several researchers who were attempting to investigate the area of m-Learning have repeatedly mentioned that the concept is will-defined [6]. The fact that computing power, Internet, and mobile technologies all increased at the same time has led many researchers to equate them when they are researching the m-Learning platform. We side with the notion given by [7] that m-Learning is an upshot of d-learning, i.e., distance learning and e-learning. The technology employs electronic and wireless principles to ensure that distance learning is viable for learners as a mainstream educational option [7] [8].
The m-Learning platform has changed the learning paradigm, and it has the potential to alter the way education is imparted. Most of the pilot studies reviewing the adoption and success of m-Learning within universities tend to focus only on the technical capabilities [9].
As m-Learning technology is entirely dependent on the interaction between humans and machines, focusing solely on the capability of mobile devices and applications only limits the picture. The perspective of success factors must also extend to the usage of m-Learning in different contexts [2] [3].
III. RESEARCH MODEL AND HYPOTHESIS
The purpose of the research is to present a research model for assessing how and to what extent different factors
Learner Perceptions of a Successful Mobile
Learning Platform: a Systematic Empirical
Study
Muasaad Alrasheedi and Luiz Fernando Capretz
influence user perception (learners), as shown in Figure 1.
Fig. 1. Research model – critical success factors affecting the success of m-Learning from learners perspectives.
Without doubt, learners are the target user group around which the entire platform has been built, and, hence, their individual attitudes are extremely important. Our previous research found 13 factors that affect the overall attitude towards the m-Learning platform [10]. To determine user satisfaction levels, we have conducted a detailed survey targeting the learners using the m-Learning platform. Overall, the objective of the research is to determine the answer to the following question: “To what extent do the critical success factors have an impact on learner perceptions of a m-Learning platform?” The multiple linear regression equation of the model is as follows:
Learner perception = c0 + c1f1 + c2f2 + c3f3 + c4f4 + c5f5 + c6f6 + c7f7 + c8f8 + c9f9 + c10f10 + c11f11 + c12f12 + c13f13.
In the equation c0, c1, c2, c3, c4, c5, c6, c7, c8, c9, c10, c11, c12, and c13 are coefficients and f1, f2, f3, f4, f5, f6, f7, f8, f9, f10, f11, f12, and f13 are the 13 independent variables. To empirically investigate the research question, the 13 hypotheses are derived with a belief that they will all positively affect learner perception.
IV. RESEARCH METHODOLOGY
As the primary focus of m-Learning is the learners, who also form the largest user group, the present study focuses on gathering their opinions in a systematic manner. To collect the data, we gave the questionnaire to various undergraduate students studying different courses in five universities in Saudi Arabia. We assured the students that the survey was confidential: their identity would not be disclosed and their primary responses would be used for this study only. We received a total of 202 completed questionnaires.
A. Reliability and Validity Analysis of Measuring Instrument
Among the responses of the questionnaire regarding perception of various aspects of the m-Learning platforms, nine are straightforward and involve single-tem measurement scales. However, the remaining four factors are measured using multi-item rating scales – learner productivity, learner community development, platform accessibility, and Internet access. The overall learner
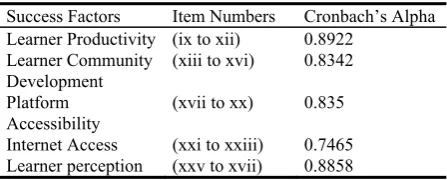
perception measurement also involved use of a multi-item rating scale. In these particular cases, it is important to assess the reliability of the measurement scales. Reliability analyses indicate the reproducibility of a measurement and are done using an internal consistency analysis to calculate the Cronbach’s alpha. Various researchers have cited different satisfactory levels for the reliability coefficient. Some like van de Ven and Ferry believe that a coefficient of 0.55 and higher is satisfactory [11]. However, recent researcher’s such as Osterhof, believe that the coefficient must be at least 0.6 [12]. In our case, the reliability coefficient in all cases is >0.74, which means that the measuring instruments used are reliable. Table 1 below shows the values of Cronbach’s alpha and PCA eigen values for the factors discussed.
TABLE 1
CRONBACH’S ALPHA FOR MULTI-MEASURING RATING SCALES
Success Factors Item Numbers Cronbach’s Alpha Learner Productivity (ix to xii) 0.8922
Learner Community Development
(xiii to xvi) 0.8342
Platform
Accessibility (xvii to xx) 0.835 Internet Access (xxi to xxiii) 0.7465 Learner perception (xxv to xvii) 0.8858
B. Reliability and Validity Analysis of Measuring Instrument
The data analysis procedure consists of three steps. First, a parametric correlation is found between the dependent and independent variables to see if any of the variables, i.e., hypotheses, can be rejected. This is followed by conducting a non-parametric correlation using the same set of data; the purpose is to reduce the threat to external validity [13].
V. HYPOTHESIS TESTS AND RESULTS
A. Demographic distribution of the population
This section provides a description of the demographic distribution of the survey population. The total population of the research consisted of 202 students.
[image:2.595.315.539.265.355.2]B. Hypothesis testing using a parametric test and a non-parametric test
To test hypotheses H1-H13 of the research model, parametric and non-parametric statistics were used to examine the Pearson and Spearman correlation coefficients among the individual independent variables, i.e., the critical success factors and the dependent variable, which is learner perception. The results of the statistical calculation for the Pearson correlation coefficient are shown in Table 2 below. It is well known that the lower the p-value the better the chance of rejecting the null hypothesis and, hence, the more significant is the result in terms of its statistical significance [14]. In the present case, all the p-values are 0.00. This means that the results are significant.
TABLE 2
HYPOTHESIS TESTING USING A PARAMETRIC TEST
Hypothesis Critical Success Factor Pearson Correlation Coefficient
Spearman Correlation Coefficient H1 Technical competence of
learners
0.626 0.613
H2 Technical competence of
instructors 0.588 0.556 H3 Personalization 0.463 0.442 H4 Learner autonomy 0.575 0.568 H5 User friendly design 0.600 0.571 H6 Application working 0.583 0.551 H7 Presentation of content 0.613 0.606 H8 Assimilation with curriculum 0.546 0.492 H9 Learner productivity 0.750 0.727 H10 Learner community
development
0.551 0.519
C. Testing of the Research Model
As mentioned earlier, the multiple linear regression equation for our model is as given below:
Learner perception = c0 + c1f1 + c2f2 + c3f3 + c4f4 + c5f5 + c6f6 + c7f7 + c8f8 + c9f9 + c10f10 + c11f11 + c12f12 + c13f13.
The response variable is the learner perception and all the critical success factors are continuous predicators. No categorical predicators were included for the present analysis. Table 3 below shows the regression analysis results of the research model.
The first interesting part of the analysis is that not all the coefficients are positive. The factors – personalization, learner autonomy, application working, assimilation with curriculum, and learner community development – all have negative coefficients. Further, the p-values < 0.05 point to significant results. But p-values are greater for the following factors: technical competence of learners, learner autonomy, user friendly design, application working, assimilation with curriculum, learner community development, and platform accessibility. Thus the corresponding hypotheses – H1, H2, H4, H5, H6, H8, H10, and H11 – are rejected. The final regression equation is as follows:
Learner perception = 0.182 – 0.1056 (personalization) + 0.161 (presentation of content) + 0.3761 (learner productivity) + 0.2356 (Internet access) + 0.2252 (blended learning)
As can be seen, the personalization is negative in this case. The model accounts for 67.91% variability in the
dependent variable, i.e., learner perception.
TABLE 3
MULTIPLE REGRESSION ANALYSIS OF THE RESEARCH MODEL
Critical Success Factor Coefficient term Coefficient value t-value p-value
Technical competence of
learners f1 0.1071 1.83 0.068 Technical competence of
Instructors f2 0.0421 0.70 0.483 Personalization f3 -0.1056 -2.04 0.043 Learner autonomy f4 -0.0011 -0.02 0.985 User friendly design f5 0.0879 1.46 0.147 Application working f6 -0.808 -1.31 0.192 Presentation of content f7 0.161 3.35 0.001 Assimilation with
curriculum f8 -0.0657 -1.13 0.260 Learner productivity f9 0.3761 4.50 0.000 Learner community
development f10 -0.1037 -1.57 0.118 Platform accessibility f11 0.0725 1.11 0.269 Internet access f12 0.2356 3.58 0.000 Blended learning f13 0.2252 4.30 0.000
VI. DISCUSSION OF RESULTS
The data analysis of the survey covers only a limited section of the results. The gender distribution skewed towards the male students, but female students were a significant part of the population. A majority of the students were under the age of 25 and in undergraduate full-time study. Finally, the student population consisted mainly of computer and other engineering students. Some of the questionnaire consisted of multiple-response rating scales, and so the first step constituted determining whether the overall responses were valid. The values of Cronbach’s alpha in the relevant parameters (learner productivity, learner community development, platform accessibility, Internet access, and the dependent variable “learner perceptionˮ were all found to be higher than 0.7, which was easily above the most recently decided threshold of 0.6. Hence, the averages of the response could be used for determining the individual variable coefficients in the research mode.
In order to remove the threats to external validity, both parametric and non-parametric studies were carried out. The coefficients were similar in both the tests, though the Spearman’s Rho tended to be somewhat lower than Pearson’s coefficient. More importantly, none of the hypotheses could be rejected at this stage because, statistically speaking, all were found to be significant with a p-value of 0.00. The next crucial result was that none of the correlation coefficients were lower than 0.4, suggesting that the data was at least fairly correlated and none of the hypotheses could be rejected based on the issue of poor correlation.
learners, learner autonomy, user friendly design, application working, assimilation with curriculum, learner community development, and platform accessibility. The remaining variables were included in the regression equation. All of the variables except personalization had the expected direction based on the original hypotheses.
VII. LIMITATION OF THE STUDY
The present research was detailed in terms of the analysis of learner responses. However, there are certain limitations and they are mostly related to the analysis of data. The regression included only the continuous parametric data. This is because the large number of variables meant that the other categorical parameters (like age, gender, education levels, etc.) were not a part of the analysis at the present time. This analysis can be a part of the future analysis, which can also include a reformation of the regression analysis after removal of the non-significant parameters. This would provide more balanced and accurate responses correlated with the demographic characteristics of the leaners.
VIII. CONCLUSION
The present study conducted a systematic and detailed investigation into the factors affecting learner perception that is based on a survey taken from more than five universities. The purpose was to understand the specific factors that affected learner perception at the higher education levels. Additionally, the extent of the effect of individual factors was also a related objective. The results of the analysis showed that the following parameters were relevant to learner perception: personalization, presentation of content, learner productivity, Internet access, and blended learning. The future work would consist of relating how demographic factors affect the responses of the learners.
APPENDIX
Here is a part of the learner’s perception questionnaire represented in this research (the measuring instruments used five Likert-type scale for each question):
i. Learning to operate the University’s m-Learning platform is easy for me
ii. My instructors find it easy to operate the University’s m-Learning platform
iii. I can customize the m-Learning application to reflect my individual choices
iv. The m-Learning application lets me learn subjects at my own pace
v. I find it easy to get the m-Learning application do what I want it to do
vi. My interaction with the m-Learning application is clear and understandable
vii. It is more interesting to learn my subjects using the m-Learning application
viii. The m-Learning application contains all related topics, as per curriculum
ix. Using the m-Learning application has made it easier to learn the subjects
x. I find the m-Learning application useful for learning the subjects
xi. Using the m-Learning application has increased my productivity
xii. I can finish leaning activities more quickly using the m-Learning platform
xiii. I use the m-Learning platform to contact fellow students about schoolwork
xiv. I use the m-Learning platform to contact my instructors about schoolwork
xv. The discussion forum on the m-Learning platform is easy to use
xvi. The discussion forum on the m-Learning platform is helpful to me
xvii. It is easy to access the m-Learning platform from the University’s website
xviii. The m-Learning platform is accessible from outside the University campus
xix. The m-Learning platform is accessible even when I am on the move
xx. The m-Learning platform is accessible from home xxi. It is easy for me to access the Internet on the University campus
xxii. It is easy for me to access the Internet when I am on the move
xxiii. It is easy for me to access the Internet when I am home
xxiv. I combine the m-Learning platform and contact lectures for the best results
xxv. I plan to use the m-learning platform to learn my subjects in future
xxvi. I would like to use the m-Learning platform to learn my subjects in future
xxvii. I think learning subjects using the m-Learning platform is a good idea.
ACKNOWLEDGMENT
The first author would like to thanks the Ministry of Higher Education in Saudi Arabia for his scholarship.
REFERENCES
[1] Ally, M. Mobile learning: transforming the delivery of education and
training. Edmonton, Alberta, Canada: Athabasca University Press,
2009.
[2] Ally, M. Mobile Learning: Transforming the Delivery of Education
and Training. Edmonton: Athabasca University Press, 2009.
[3] Andrews, T., Smyth, R., Tynan, B., Berriman, A., Vale, D., & Cladine, R. Mobile technologies and rich media: expanding tertiary
education opportunities in developing countries. In A. G.
Abdel-Wahab, & A. A. El-Masry, Mobile Information Communication Technologies Adoption in Developing Countries: Effects and
Implication. New York: Idea Group Inc. (2010)
[4] Saccol, A., Barbosa, J. L., Schlemmer, E., & Rienhard, N.. Corporate
m-learning: applications and challenges. In R. Guy, Mobile
Learning: Pilot Projects and Initiatives. California: Information
Science, 2010.
[5] Kukulska-Hulme, A., & Taxler, J. Designing for mobile and wireless
learning. In H. Beetham, & R. Sharpe, Rethinking Pedagogy for a
Digital Age: Designing and Delivering e-Learning (pp. 180-192). London: Roultedge, 2007.
[6] Hamm, S., Saltsman, G. J., Baldridge, & Perkins, S. A Mobile
Pedagogy Approach for Transforming Learners and Faculty. In Z. L.
Berge, & L. Muilenburg, Handbook of Mobile Education. New York: Routledge, 2013.
[7] Chaka, C. From Classical Mobile Learning to Mobile Web 2.0
Learning. In R. Guy, The Evolution of Mobile Teaching and Learning
(pp. 79-102). Santa Rosa: Informing Sciene Press, 2009.
[9] Kukulska-Hulme, A. Introduction. In A. Kukulska-Hulme, & J. Traxler (Eds.), Mobile learning: a handbook for educators and
trainers (pp. 1-6). New York: Roultedge, 2005.
[10] Alrasheedi, M. & L.F. Capertz, A meta-analysis of critical success
factors affecting mobile learning. IEEE International Conference on
Teaching, Assessment and Learning for Engineering (TALE), Bail, pp 262 – 267, 2013.
[11] Van de Ven, A. H., & L, F. D. Measuring and Assessing
Organizations. New York: Wiley, 1980.
[12] Osterhof, A. Classroom Applications of Educational Measurement. New Jersey: Prentice Hall, 2001.
[13] Raza, A., Capretz, L. F., & Ahmed, F. Users’ perception of open
source usability: an empirical study. Engineering with Computers,
28(109), pp: 109-121, 2012.